

 PDF
PDF ePub
ePub Citation
 Print
Print


INTRODUCTION
Chronic kidney disease (CKD) is widely recognized as an independent risk factor for cardiovascular morbidity and mortality (123). Early detection, prevention, and management of CKD are an important health issues facing Korea today. In addition, previous epidemiological studies have shown that mildly decreased kidney function, even above the diagnostic threshold of CKD, is strongly associated with increased cardiovascular risk (456). [REMOVED HYPERLINK FIELD][REMOVED HYPERLINK FIELD]Thus, it is important to be able to detect a modifiable risk factor for decline of kidney function at an early stage before kidney damage.
Obesity is a leading cause of CKD above and beyond chronic diseases such as hypertension, diabetes, and dyslipidemia (78). Traditionally, altered renal hemodynamics causing glomerular hyperfiltration and activating the renin-angiotensin system in obese patients have been associated with renal impairment (9). Recently, clinical and experimental researches have shown that abdominal fat accumulation may lead to chronic low-grade systemic inflammation, insulin resistance, dyslipidemia, and/or increased synthesis of vasoactive and fibrogenic substances, and these changes may have a negative influence on kidney cells, and cause pathologic changes (910). Conceivably, these metabolic effects on kidney could continue to the general healthy population (8).
Body mass index (BMI) is most widely used as an anthropometric measure of obesity (11). However, it is not a reliable indicator of central obesity because it tends to overrate obesity in adults with a large amount of muscle mass (12). Waist circumference (WC) is also generally accepted as a barometer of central obesity (11), and it may be better predictor of abdominal visceral fat than BMI. However, it has great inter-ethnic variability (1314). In addition, BMI and WC frequently yield similar results in previous epidemiologic studies (14). Other indicators, such as conicity index (C-index), have been developed to more clearly represent the fat distribution associated with abdominal obesity (14). Because the formula for calculating the C-index is complex and it is hard to get the exact answer even with a calculator, its utility in the clinic is limited.
Dual-energy X-ray absorptiometry (DXA) is widely used to obtain more accurate data on human body composition. A previous study reported that fat distribution measured by DXA was more closely related to metabolic abnormality (15). However, some authors have argued that anthropometry is superior to direct body fat measures for predicting metabolic risks (16). Thus there is no clear consensus on which indicator should be used to estimate metabolic risk, especially that involving renal impairment (14). Therefore, we made a simple equation to estimate relative visceral fat composition and compared the ability of BMI, WC, C-index, and trunk/body fat mass ratio (T/Br) from DXA to estimate the effect of abdominal fat on mildly decreased kidney function in the healthy population.
MATERIALS AND METHODS
Study population
The data were collected from public use data sets of the Korean National Health and Nutrition Examination Survey (KNHANES) IV and V conducted by the Korean Centers for Disease Control and Prevention (KCDC) among non-institutionalized Korean civilians between 2008 and 2011. KNHANES was a cross-sectional and national representative survey with a multistage and stratified sample design. The voluntary participants provided written informed consent prior to their enrollment. Their records, except for survey date, were anonymized prior to analysis.
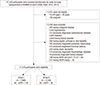
A total of 37,249 individuals participated in the KNHANES 2008–2011. Exclusion criteria for this study included: participants for whom data were lacking (anthropometric or laboratory data), those under 20 years of age, pregnant women, those with any medical problems, and presence of CKD with estimated glomerular filtration rate (eGFR, mL·min-1·1.73 m-2) below 60 or urine albumin-to-creatinine ratio (UACR, mg/g) above 30. The total number of eligible participants was 11,319 (Fig. 1).
Anthropometric measurements
Anthropometric measurements were made by well-trained examiners. Height was measured to the nearest 0.1 cm using a portable stadiometer (Seriter, Bismarck, ND, USA). BMI (kg/m2) was determined using weight and height measurements taken in light clothing without shoes and was rounded to the nearest tenth. Systolic and diastolic blood pressures (BPs) were measured 3 times using a mercury sphygmomanometer (Baumanometer; Baum, Copiague, NY, USA) in the sitting position after at least 5 minutes rest. Average values of the 3 recorded systolic and diastolic BPs was used in the measurements. WC (cm) was measured with flexible tape at the narrowest point between the lowest border of the rib cage and the uppermost lateral border of the iliac crest, at the end of normal expiration. C-index was calculated using WC (m), weight (kg), and height (m) from the formula (17):

Biochemical assessment
Blood samples were drawn from all subjects after a minimum fast of 8 hours. Fasting plasma concentrations of glucose and lipoproteins were measured by enzymatic methods with a Hitachi Automatic Analyzer 7600 (Hitachi, Tokyo, Japan) in a central laboratory. Urinary albumin was measured on spot urine by the immunoturbidimetric method and urinary creatinine by the colorimetric method, to obtain UACR. The level of 25-hydroxyvitamin D3 was determined with a radiommunoassay kit (Diasorin, Stillwater, MN, USA), and hemoglobin A1c was measured with an HLC-723G7 (Tosoh, Tokyo, Japan). Kidney function was estimated using the Chronic Kidney Disease Epidemiology Collaboration (CKD-EPI) equation (18).
DXA scanning
All DXA measurements were obtained with a Discovery-W fan-beam densitometer (Hologic, Inc., Bedford, MA, USA). This measures total fat mass in grams and as a percentage of body mass; the latter is calculated as:
Fat mass/(Fat mass + Lean tissue mass + Bone mineral content) × 100
The trunk region consists of the area bordered by a horizontal line below the chin, vertical borders lateral to the ribs, and oblique lines passing through the femoral necks. The leg region included all tissues below these oblique lines. Measurement of lean body mass (LBM) excluded fat and bone mineral content (19).
Definitions of main factor and outcome
We measured relative body fat composition in the trunk by DXA calculated using percentage of fat mass from the equation:
T/Br (%) = Fat mass in trunk/Fat mass in whole body except head × 100
In this cross-sectional study, we defined eGFR ≥ 60 and < 90 as mildly decreased kidney function and eGFR ≥ 90 and ≤ 120 as normal kidney function, respectively.
Statistical analysis
All data, including socio-demographic data, medical conditions, anthropometric and clinical measurements, and laboratory results, are presented as means ± standard error or frequencies (and proportions). Data were analyzed using sampling weights to account for multistage and stratified sampling. The generalized linear model was used to compare quantitative variables and Pearson's χ2 test was used to compare proportions for categorical variables. Odds ratios (ORs) with 95% confidence intervals (95% CIs) were calculated in logistic regression models according to risk of mildly decreased kidney function. Receiver operating characteristic (ROC) curves were used to compare the ability of risk factors to discriminate between the patients who developed mildly decreased kidney function and those who did not. Nonparametric methods were used to compare areas under the ROC curves (AUCs). Two-tailed P < 0.05 was considered statistically significant. All statistical analyses were performed using Statistical Analysis Software (SPSS ver. 9.3; SAS Institute Inc., Cary, NC, USA).
RESULTS
Baseline characteristics of participants
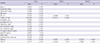
Overall, the 11,319 participants were divided into 2 groups according to eGFR: group I (n = 7,980), eGFR ≥ 90 and ≤ 120; and group II (n = 3,339), eGFR ≥ 60 and < 90. Group II had higher BMI (23.2 ± 0.1 vs. 23.6 ± 0.1 kg/m2, P < 0.001), WC (79.2 ± 0.2 vs. 81.5 ± 0.2 cm, P < 0.001), C-index (1.173 ± 0.002 vs. 1.199 ± 0.002 m1½·kg-½, P < 0.001), LBM (44.1% ± 0.2% vs. 45.4% ± 0.3%, P < 0.001), and T/Br (100.4% ± 0.2% vs. 105.1% ± 0.3%, P < 0.001) than group I. Other anthropometric, clinical, and biochemical characteristics of the participants are summarized in Table 1.
Table 1
Baseline characteristics according to eGFR*
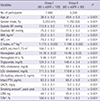
eGFR = estimated glomerular filtration rate, BP = blood pressure, BMI = body mass index, WC = waist circumference, C-index = conicity index, HDL = high-density lipoprotein, LDL = low-density lipoprotein, PTH = parathyroid hormone, UACR = urine albumin-to-creatinine ratio, LBM = lean body mass, T/Br = trunk/body fat mass rate.
*Kidney function was estimated using the Chronic Kidney Disease Epidemiology Collaboration equation; †Includes ex-smokers and current smokers; ‡T/Br was calculated by the equation: T/Br (%) = percentage of fat mass in trunk/percentage of fat mass in whole body except head × 100.
Linear regression analysis
As shown in Fig. 2, scatter plots of T/Br vs. conventional anthropometric indices of obesity point to positive correlations between them. Furthermore, linear regression analysis revealed that T/Br was closely related to eGFR (β = −0.3173, P < 0.001), and this relationship remained significant after adjustment for age, gender, systolic BP, BMI, WC, C-index, hemoglobin, and smoking amount (β = −0.0962, P < 0.001; Table 2).
Fig. 2
Scatter plots with trending lines showing the correlation between BMI, WC, C-index, and T/Br. T/Br has positive correlation with conventional anthropometric indices of central obesity.
BMI = body mass index, WC = waist circumference, C-index = conicity index, T/Br = trunk/body fat mass ratio.
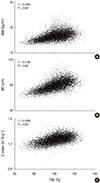
Table 2
Linear regression for eGFR
eGFR = estimated glomerular filtration rate, BP = blood pressure, BMI = body mass index, WC = waist circumference, C-index = conicity index, HDL = high-density lipoprotein, LDL = low-density lipoprotein, PTH = parathyroid hormone, UACR = urine albumin-to-creatinine ratio, LBM = lean body mass, T/Br = trunk/body fat mass rate, Model I = adjusted for age, gender, systolic BP, BMI, hemoglobin, and smoking amount, Model II = adjusted for age, gender, systolic BP, BMI, WC, C-Index, hemoglobin, and smoking amount.
Logistic regression models
When group II was compared to group I, the crude OR of T/Br for mildly decreased kidney function was 1.046 (95% CI = 1.039–1.053; Table 3). Adjustment for age, gender, systolic BP, BMI, C-index, hemoglobin, glucose, high-density lipoprotein (HDL)-cholesterol, and smoking amount did not attenuate this association (adjusted OR = 1.020; 95% CI = 1.007–1.033), and it indicates that higher T/Br is significantly associated with early decline of kidney function. LBM was related to early decline of kidney function in the logistic regression model I (adjusted OR = 1.044; 95% CI = 1.021–1.067), but further adjustment for C-index and marital state diminished the relationship.
Table 3
Logistic regression for mildly decreased kidney function
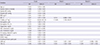
OR = odd ratio, CI = confidence interval, BP = blood pressure, BMI = body mass index, WC = waist circumference, C-index = conicity index, HDL = high-density lipoprotein, LDL = low-density lipoprotein, PTH = parathyroid hormone, UACR = urine albumin-to-creatinine ratio, LBM = lean body mass, T/Br = trunk/body fat mass rate, Model I = adjusted for age, gender, systolic BP, BMI, hemoglobin, glucose, HDL-cholesterol, and smoking amount, Model II = adjusted for age, gender, systolic BP, BMI, C-Index, hemoglobin, glucose, HDL-cholesterol, and smoking amount.
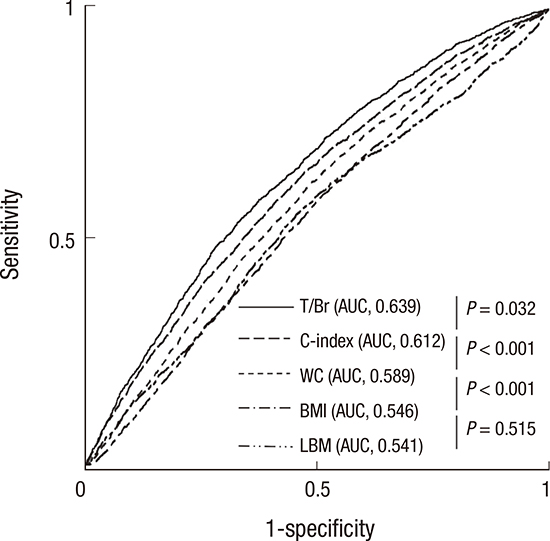
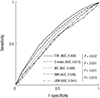
To obtain an additional measure of the predictive values of the risk factors, we created ROC curves and compared AUCs. This showed that T/Br (AUC = 0.639; 95% CI = 0.624–0.653), C-index (AUC = 0.612; 95% CI = 0.607–0.636), and WC (AUC = 0.589; 95% CI = 0.574–0.604) had higher predictive values than BMI (AUC = 0.546; 95% CI = 0.531–0.561). However, there was no significant difference in AUC between LBM and BMI (Fig. 3).
Fig. 3
ROC curves representing ability to predict early decreased kidney function. T/Br has better precision in predicting mildly decreased kidney function than other obesity-related indices.
ROC = receiver operating characteristic, T/Br = trunk/body fat mass ratio, C-index = conicity index, WC = waist circumference, BMI = body mass index, LBM = lean body mass, AUC = area under curve.
DISCUSSION
This study provides a comprehensive overview of the performance of the T/Br derived from DXA as a predictor of early decline of kidney function, and demonstrates that T/Br has the strongest association with mild loss of kidney function in the general population. These findings point to the use of T/Br as an early warning of possible decreased kidney function in people who are unaware of the risk of CKD.
Our results revealed that, compared with controls, participants with mildly decreased kidney function were more hypertensive and obese and had higher serum triglyceride levels and lower HDL-cholesterol levels. These findings are consistent with previous landmark studies showing that metabolic syndrome and its components increased cerebro-cardiovascular risk and were strongly associated with poor kidney outcomes (2021).
Our linear regression analysis showed that obesity-related indicators such as anthropometric indices and T/Br had a closer relation to kidney function than to other compartments of metabolic syndrome. This finding suggests that obesity is a major metabolic factor associated with the progression of kidney disease. Growing body of evidences show that elevated abdominal fat mass, namely visceral obesity, is one of dangerous clinical determinants inducing many clinical illnesses (8222324), and it could lead to kidney dysfunction via a variety of mechanisms including local secretion of pro-inflammatory cytokines/chemokines, direct compression of the kidney and renal arteries, and activation of the sympathetic nervous system or the renin-angiotensin-aldosterone system (25). Our results indicate that anthropometric indices of central obesity and T/Br bear a significant relation to early decreased kidney function.
Our logistic regression analysis revealed that T/Br and C-index were strong predictors of early decreased kidney function in the general population, but WC was not. WC is the most frequently used indicator of central obesity. However, there is controversy over whether it is associated with decreased kidney function (26). A Japanese prospective study found that steeper increases of WC were related to a more rapid decline of renal function, while a Southeast Asian cohort study demonstrated that it was not significantly associated with CKD prevalence or the risk of developing CKD (27). Thus, it appears to be a weak indicator estimating adverse influence of visceral obesity on kidney function (26). Recently, C-index was developed and improved accuracy in the estimation of abdominal fat accumulation. Sezer et al. (26) reported that C-index appeared to be a strong predictor of systemic inflammation, cardiovascular risk, and loss of kidney function in pre-dialysis CKD patients. However, such anthropometric indicator is difficult to interpret biologically, less sensitive to weight gain, and does not take into account the effect of hydration state on body weight (142829). In case of C-index, the complex equation may limit its widespread use. On the other hand, our results showed that T/Br may be a suitable alternative indicator in estimating the adverse effect of the central obesity on the kidneys.
One of the major findings of our study was that the AUC of T/Br for predicting early decreased kidney function was significantly higher than those of the 3 other anthropometric indices. Although total body and regional scans using DXA yield accurate measures of body composition, DXA cannot differentiate directly between visceral and subcutaneous fat and the use of irradiation is undesirable in certain groups, such as children and the pregnant (3031). Also, some authors have argued that an anthropometric index was strongly associated with visceral fat in participants with CKD, and others have shown that total body fat change measured by bioelectrical impedance analysis is related to a reduction in eGFR in the elderly population (3233). However, the 3 components of body, namely lean mass, fat mass and bone mineral density, can be easily measured in the whole body or individual body segments by a single whole body DXA scan (30), and some approach could minimize the confounding effect of subcutaneous fat mass in estimating visceral obesity. In the present study, straightforward measurements of the fat mass of the whole body or individual body segments were only weakly related to decreased kidney function (data not shown), but adjusting fat mass in the trunk by whole body fat mass significantly improved their accuracy. Thus, our study raises the possibility that T/Br could be a novel DXA indicator of abdominal fat accumulation. However, because there have been very few clinical studies of the use of visceral/total fat mass ratio, a long-term prospective study is needed to establish whether T/Br as a DXA measurement is a good indicator of the presence of chronic illness caused by metabolic syndrome, especially visceral obesity.
Interestingly, we observed that estimated kidney function was negatively correlated with serum hemoglobin level; this is consistent with a previous report assessing the possible association between hemoglobin level and kidney function in early CKD patients (34). Mechanistically, it is possible that activation of the renin-angiotensin system in early CKD patients contributes to an increased production of erythropoietin to maintain tissue oxygen content (34). Because CKD is a systemic inflammatory disease and elevated pro-inflammatory factors are associated with anemia and low iron status (35), much controversy persists. We performed adjusted regression analyses to minimize the effects of possible confounding variables on kidney function.
There are some limitations to this study. First, because the number of participants with GFR < 60 mL·min-1·1.73 m-2 or UACR > 30 mg/g in KNHANES was very small, we could not investigate the relationship between visceral obesity and CKD development. Second, because of the limitations of cross-sectional studies, we could not assess the positive/negative effect of visceral obesity on the characteristics and patterns of changes of kidney function. Third, we did not obtain the anatomical or radiologic data on subcutaneous or visceral adipose tissue by magnetic resonance imaging and computed tomography that could have helped to distinguish the harmful effects of visceral obesity from those of subcutaneous adiposity (36). Finally, since T/Br is, strictly speaking, machine-based, it is not readily performed in primary care.
The results of the present study show that an increase in the proportion of trunk fat mass may be related to early deterioration of kidney function in the general population. Also, additional assessment of body fat composition using DXA may provide precise information for predicting the risk of kidney impairment along with other obesity-related indicators. To confirm these findings, there is need for a large population-based prospective study in the general population to establish the exact association among T/Br, visceral obesity, and kidney function.
 XML Download