

 PDF
PDF ePub
ePub Citation
 Print
Print


INTRODUCTION
The mortality rate is one of the key indicators of an intensive care unit (ICU) quality. However, the severity of patients' illnesses, comorbidities, and demographics all strongly affect the mortality rate (1). Thus a comparison of unadjusted mortality rate among ICUs without consideration of severity or other case-mix variables might provide an incorrect estimate of ICU quality. In a multicenter study, the crude mortality rate of tertiary pediatric ICUs was four times higher than that of non-tertiary pediatric ICUs (2). The latter does not suggest that the performance of the tertiary pediatric ICU was poor, as tertiary hospitals are usually referral hospitals to which more severe patients are referred. Therefore, when we compare mortality data of certain units or patients' groups for the purpose of quality care or research, the mortality data must be adjusted.
Mortality data on ICU patients is usually adjusted using mortality prediction models. In general pediatric ICUs, the Pediatric Index of Mortality (PIM) 3, Pediatric Risk of Mortality (PRISM) III, are commonly used mortality prediction models (345), whereas the Acute Physiology and Chronic Health Evaluation (APACHE), Simplified Acute Physiology Score and Mortality Probability Model are commonly used in adult ICUs (6). Regional variations, such as different national health systems, different populations, or disease prevalence, might affect the performance of these scoring systems. Thus, some validation studies of the applicability of these scoring systems to Korean adult patients have been conducted in Korea (789).
To the best of our knowledge, there has been no validation study of PIM3 scoring system for pediatric patients in Korea. Another consideration when applying PIM score in Korean ICUs is the age of the patients. The developmental data of PIM score were validated for children aged < 16 years at the time of ICU admission, but patients aged < 18 years are admitted to pediatric ICUs in Korea. Therefore, the aims of this study were: 1) to validate the recently updated PIM3 score for Korean pediatric patients; and 2) to validate the PIM3 score for patients in an extended age group (< 18 years).
MATERIALS AND METHODS
Study design
This was a retrospective cohort study of patients admitted to the pediatric intensive care unit (PICU) of a single tertiary institute, from 1st January 2010 to 31st December 2014. This unit (15 beds) is a combined medical and surgical unit. Four beds are allocated for surgical patients. Immediate postoperative cardiac patients are usually admitted to another dedicated pediatric cardiac surgical unit, but can be admitted to this PICU when medical support is more emphasized than postoperative care. Many surgical patients, especially in a post organ transplantation state, are admitted to the specialty ICU shared by adult patients.
The inclusion and exclusion criteria were similar to those of previous studies of the PIM and revised versions (PIM2 and PIM3) (41011), except for the age of the patients. In contrast to the criteria in previous studies, which included only patients aged < 16 years, the present study included patients aged < 18 years. All consecutive patients admitted to the PICU were included. Readmissions were considered as new admissions, but patients transferred to other hospital units were excluded.
Data collection
The data were collected by a licensed medical records officer and reviewed by researchers (intensive care physicians) collaborating in the study. Data on the following parameters were collected to calculate the PIM3 score: 1) Systolic blood pressure (SBP), mmHg (unknown = 120); 2) Pupillary reactions to bright light (> 3 mm and both fixed = 1; other or unknown = 0); 3) ([FiO2 × 100]/PaO2). PaO2 mmHg, FiO2 at the time of PaO2 if oxygen via endotracheal tube or headbox (FiO2 or PaO2 unknown, [{FiO2 × 100}/PaO2] = 0.23); 4) Base excess in arterial or capillary blood, mmol/L (unknown = 0); 5) Mechanical ventilation at any time during the first hour in ICU (no = 0; yes = 1); 6) Elective admission to ICU (no = 0; yes = 1); 7) Recovery from surgery or a procedure is the main reason for ICU admission (no = 0; yes, recovery from a bypass cardiac procedure = 1; yes, recovery from a non-bypass cardiac procedure = 2; yes, recovery from a noncardiac procedure = 3); 8) Low-risk diagnosis (no or in doubt = 0; yes = 1); 9) High-risk diagnosis (no or in doubt = 0; yes = 1); and 10) Very high-risk diagnosis (no or in doubt = 0; yes = 1). Low-risk diagnosis consists of asthma, bronchiolitis, croup, obstructive sleep apnea, diabetic ketoacidosis, and seizure disorder. High-risk diagnosis consists of spontaneous cerebral hemorrhage, cardiomyopathy or myocarditis, hypoplastic left heart syndrome, neurodegenerative disorder, and necrotizing enterocolitis. Very high-risk diagnosis consists of cardiac arrest preceding ICU admission, severe combined immune deficiency, leukemia or lymphoma after first induction, bone marrow transplant recipient, and liver failure. Patients with multiple diagnoses were assigned to only 1 risk-diagnosis group, which has the highest risk score. PIM3 score and probability of death were calculated by formulas presented in the development study (4).
PIM3 score = (3.8233 × pupillary reaction) + (−0.5378 × elective admission) + (0.9763 × mechanical ventilation) + (0.0671 × [absolute {base excess}]) + (−0.0431 × SBP) + (0.1716 × [SBP2/1,000]) + (0.4214 × [{FiO2 × 100}/PaO2]) − (1.2246 × bypass cardiac procedure) − (0.8762 × non-bypass cardiac procedure) − (1.5164 × noncardiac procedure) + (1.6225 × very high-risk diagnosis) + (1.0725 × high-risk diagnosis) − (2.1766 × low-risk diagnosis) − 1.7928.
Probability of death = exp (PIM3 score)/[1 + exp (PIM3 score)].
Data on parameters that differed in the PIM2 version, including the main reason for ICU admission, cardiac bypass surgery, diagnosis category (low-, high-risk), were collected as described in the developmental study of PIM2 (11). Physiological variables from the time of first ICU contact to 1 hour after arrival in the ICU were recorded. The formulas and coefficients presented in previous PIM2 and PIM3 studies were used to calculate the predicted mortality of each patient (411).
Statistical analysis
The SAS Program (Ver. 9.3; SAS Institute, Cary, NC, USA) was used for all the statistical analyses. All tests were 2-tailed, and a value of P < 0.05 was considered statistically significant. Descriptive statistics were used to present age, gender, length of stay, observed mortality, and predicted mortality.
To evaluate the performance of the PIM2 and PIM3 scoring systems in patients aged < 18 years, we assessed the calibration and discrimination power of the score. We also assessed the performance in patients aged < 16 years and in diagnostic subgroups of cardiac, hemato-oncologic, and respiratory diagnosis, as well as the patients under the other diagnosis. The Hosmer-Lemeshow goodness-of-fit (GOF) test was used to evaluate the calibration of the scoring system. Calibration refers to the level of agreement between individual probabilities and actual outcomes (12). The GOF was assessed by dividing the patients into 10 groups according to their predicted mortality risk (C statistic), with a similar number of patients in each group. The expected number of deaths as predicted by PIM3 was compared with the observed number of deaths in each group. A value of P > 0.05 was accepted as good calibration. The discriminatory power (i.e., the ability to distinguish between survival and death) was assessed by calculating the area under the receiver-operating characteristic (ROC) curve (c-index). A c-index of > 0.70 was regarded as acceptable, and a value of > 0.8 was regarded as good discrimination (13).
RESULTS
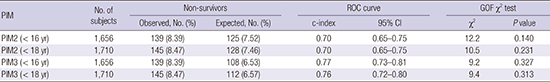
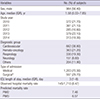
There were 1,804 patients admitted to the pediatric ICU during the study period. Of those, 93 patients were excluded because they were 18 years or older at the time of ICU admission, and one patient was excluded because of an incomplete medical record. The final study consisted of 1,710 patients, with approximately 340 patients included annually in the study. In this study group, 208 cases (12.1%) were readmitted to the PICU during the hospital stay (median interval of readmission: 9 days). As for the age, 1,656 patients were younger than 16 years of age, and the median age was 1.58 years (interquartile range [IQR]: 0.33–7.85 years). The most common diagnostic category was cardiovascular disease, followed by hemato-oncological disease and respiratory disease. The other diagnostic category included hepatic dysfunction or gastrointestinal disease (57 case, 3.3%), immunodeficiency disease (52 case, 3.0%), renal disease (44 case, 2.6%), metabolic disease (39 case, 2.3%), and unclassified disease (12 case, 0.7%). The observed hospital mortality rate was 8.47%, which was higher than the predicted mortalities calculated by both the PIM2 and PIM3 formulas (Table 1).
Table 1
Characteristics of study population (n = 1,710)
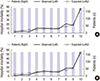
The unadjusted mortality rates and predicted mortality rates of both age groups (< 18 years and < 16 years) were similar (Table 2). The discriminatory power of the PIM3 model was acceptable (c-index > 0.70) and better than that of the PIM2 model (c-index = 0.70). As shown in Fig. 1, the calibration of both the PIM2 and PIM3 models was good for both age groups (P > 0.05), but the χ2 value for the PIM2 model was higher than the value for the PIM3 model. In addition, the expected mortality rates were closer to the observed mortality rates in PIM2 model (Table 2). When we divided the patients into 10 similar sized groups according to their predictive mortality risk, both the average predicted mortality and observed mortality of approximately 90% of the patients was lower than 20% (Fig. 1). There were some differences in the predicted and observed mortality in the subgroups, but these were acceptable according to the Hosmer-Lemeshow GOF test.
Table 2
Hosmer-Lemshow GOF χ2 test and area under ROC curve

Fig. 1
Calibration curves of the pediatric index of mortality 3 (PIM3). (A) PIM3, age group < 18 years. (B) PIM3, age group < 16 years. “Expected” hospital mortality (%) calculated by the PIM3 model and “observed” hospital mortality (%), together with the corresponding patient number, are presented. The patients were divided into 10 similar sized groups based on predicted mortality.
In the diagnostic subgroups, the mortality rate of the hemato-oncological patients was 2 to 5 times higher (18.73%) compared to that of the other subgroups (Table 3). The calibration was acceptable for all the subgroups, including the cardiac, respiratory, and hemato-oncological groups. However, as shown in Table 3, the discriminatory power of the c-index for the hemato-oncological patients was lower than acceptable (0.666).
Table 3
Hosmer–Lemshow GOF χ2 test and area under ROC curve of PIM3 for subgroups of patients aged < 18 years

DISCUSSION
This is the first study to validate the PIM3 scoring system in a pediatric ICU in Korea. We validated the PIM3 score in a Korean pediatric ICU population using the formulas and coefficients presented in the developmental study of PIM3 score (4). The present study showed that the PIM3 had acceptable discrimination ability (c-index = 0.76) and good calibration, with a χ2 value of 9.4 in those aged < 18 years (P = 0.313).
Several studies have performed regional validations of the PIM2 score in many countries (14151617181920). In Japan, a single-center validation study reported that the PIM2 had an excellent discrimination power (c-index = 0.92) and good calibration with a Hosmer-Lemeshow GOF test χ2 value of 4.8 (P = 0.440) (19). Only 1 recent study has performed a regional validation of the PIM3 score, which is the newest version of the PIM score, in Italy (21). The physiological parameters of the PIM3 are similar to those of previous versions. However, it includes a more complicated risk-weighting diagnosis, with the diagnosis classified into 3 risk groups (low, high, and very high) rather than two (low and high), as in the previous score. In this study, the discriminatory power of the PIM3 score was acceptable (c-index of > 0.7). It was similar to the value in an Italian validation study, which reported that PIM3 more accurately predicted the mortality risk than PIM2 (21). Therefore, the PIM3 score may be a reasonable choice for pediatric ICUs in Korea, despite its additional complexity.
In previous validation studies, the area under the ROC curve (c-index) was acceptable, but the values varied between 0.79 and 0.92. The c-indices in those studies were higher than the value reported in this study, which means the indices had better discriminatory power. The variation may be explained regional differences in study populations. In the development study of PIM2 and PIM3, cardiac, respiratory, and non-cardiac postoperative groups were most common diagnostic groups (411). In contrast, in the present study, cardiac, hemato-oncological, and respiratory groups were the most prevalent diagnostic groups. The hemato-oncological subgroup was the second most common subgroup in the present study, and it had the lowest c-index (0.66) compared to the other subgroups (0.74–0.83). The poor performance of PIM and PRISM score in predicting mortality of oncological patients was reported in several studies (22232425). One study reported that both PRISM and PIM score underestimated the mortality of oncological patients (24). Another study suggested poor performance of PRISM3 in predicting mortality of pediatric stem cell transplantation patients (25). In a study of adults, the APACHE II scoring system also underestimated the mortality of bone marrow transplant recipients when the APACHE II score was low (26). The underestimation of mortality rate might be caused by the innate limitation of the general mortality prediction score, which has one-size-fits-all property. For example, the predicted mortality of a respiratory failure patient, which is measured by PaO2, FiO2 and the usage of mechanical ventilation (in PIM3 score), PaO2, and PCO2 (in PRISM3 score), can be calculated in the same way for a previously healthy child with viral pneumonia and an oncological patient with cytomegalovirus/fungal pneumonia, pulmonary veno-occlusive disease, or pulmonary graft-versus-host disease at the time of admission. Since the latter patient usually has very poor prognosis (24), the observed mortality rate might be very different between the 2 patients. A general mortality prediction model might be inappropriate for use with patients in specialized oncological ICUs. Instead, a disease-specific scoring system, reflecting specific prognosis, might be more useful (27).
The unadjusted mortalities in previous validation studies were 2.6%–5.5%. In the present study, the observed mortality was 8.47%, and it was higher than the reported observed mortality. High unadjusted mortality may be explained by the severity of illness of patients in the ICU or the poor performance of the ICU team. To clarify the actual cause, the standard mortality ratio (SMR), which is the observed mortality rate divided by the average predicted mortality, can be calculated (1). The SMR is the most commonly used parameter of ICU quality in Western Europe and is mandated by some countries (28). It can also be used to compare mortality data, follow changes over time, and evaluate the effect of interventions or events (2930731). To calculate the SMR, the predicted mortality must first be determined. One advantage of the PIM3 is that the formula and coefficients of predicted mortality is presented in the article and freely available (4), compared to the mortality prediction formula of PRISM3 is commercially patented and only incomplete PRISM score is documented in the study report. In this study, the observed mortality was higher than the predicted mortality. The illness severity was high, as indicated by the high predicted mortality. However, the SMR was higher than 1, suggesting that the performance of the ICU was low. The SMR has several limitations as a quality measurement of ICUs. The time patterns of admission (i.e., early admission before full disease progression or late admission when the disease is severe) can affect the physiological parameters recorded at the time of ICU admission and eventually the SMR. Variation in the predicted mortality according to the scoring system can also influence the SMR (32). In Latin America, the PIM2 was reported to be inadequate because of poor calibration (33). Some countries have tried to develop a calibrated mortality prediction model because of regional differences among ICUs (734). Despite its defects, the SMR based on predicted mortality rates can provide valuable information. For example, serial measurements of ICU SMRs can be used to monitor internal quality improvements in hospitals. At the national level, the SMR of pediatric ICUs can be measured every 5–10 years to evaluate the improvement of the quality of Korean pediatric ICUs.
Our study has several limitations. First, this was a single center study conducted at a tertiary hospital. Thus the findings may not be generalizable to the entire Korean pediatric population. However, there are only a few pediatric ICUs in Korea, all of which are located in tertiary hospitals, so our study population might be similar to other pediatric ICU populations in Korea. Another problem is that many pediatric patients in Korea are admitted to adult ICUs, but patients aged < 18 years are usually excluded in research of adult patients.
To evaluate all the pediatric patients in ICUs, including pediatric patients in adult ICUs, multicenter studies, including primary and secondary hospitals, are needed. Second, the scoring system was subject to limitations. Due to the diversity of the patients, a one-size-fits-all scoring system was used in the evaluation of the ICU. In reality, this type of system is not suited to all patients, especially small specific subgroups. The third limitation is the retrospective data collection, although every effort was made to validate the data thoroughly.
In conclusion, the performance of the PIM3 scoring system in Korean patients aged < 18 years was good. However, the PIM3 may not be an appropriate quality measure for subgroups with hemato-oncological disease or oncology-specific ICUs because of its low discriminatory power. A multicenter study that includes pediatric patients in both adult and pediatric ICUs is needed.
 XML Download