

 PDF
PDF ePub
ePub Citation
 Print
Print


INTRODUCTION
Anemia is a well-known complication in chronic kidney disease (CKD) and associated with progression of CKD, poor quality of life, and increase in morbidity and mortality (12345). The mechanism of anemia in CKD is multifactorial: erythropoietin deficiency from reduced renal mass, iron and nutritional deficiencies, various pro-inflammatory mediators commonly elevated in CKD may affect the erythropoiesis in CKD (6).
A population based study using National Health and Nutrition Examination Survey (NHANES) in the United States exhibited that the prevalence of anemia increases progressively as the estimated glomerular filtration rate (eGFR) declines to lower than 60 mL/min/1.73 m2 (7). Recently, large population-based studies about the prevalence of anemia in non-dialysis CKD were reported. The recent NHANES report showed that the prevalence of anemia was 15.4% in CKD stage 1–5 patients compared with 7.5% in non-CKD population (8). A Chinese report showed that 51.5% of patients with CKD stage 1–5 had anemia (9). There were limited data about prevalence of anemia in CKD patients in Korea. Kwen et al. (10) reported that 37.4% among 190 non-dialysis CKD stage 1–5 patients had the hemoglobin level lower than 10 g/dL.
The KoreaN Cohort Study for Outcome in Patients With Chronic Kidney Disease (KNOW-CKD) is a prospective nationwide cohort study to investigate natural courses and risk factors for progression of Korean CKD. CKD stage 1–5 non-dialysis patients were enrolled from 9 hospitals throughout Korea between June 2011 and February 2016 (NCT01630486 at http://www.clinicaltrials.gov). We aimed to examine the prevalence and factors associated with anemia and the current status of management for anemia in non-dialysis CKD patients using the baseline dataset from KNOW-CKD.
MATERIALS AND METHODS
Study subjects
The detailed design and methods of KNOW-CKD were previously published, and baseline overall characteristics are reported in the current issue (11). Among 2,238 patients of KNOW-CKD cohort, 2,198 patients who had the baseline hemoglobin level were included in this study.
Data collection
The demographics and laboratory data were extracted from the electronic data management system (PhactaX; Seoul National University Hospital, Seoul, Korea) with the assistance from the Division of Data Management in Seoul National University Medical Research Collaborating Center.
Demographic data including age, gender, body mass index (BMI), work and economic status, marriage, education, smoking history, the cause of CKD, and comorbidities apart form the cause of CKD were collected. The medication including iron agents and erythropoietin stimulating agents (ESAs) were also recorded. The comorbidities were expressed by modified Charlson comorbidity index (12).
We collected patient's blood pressure levels and the following laboratory data: white blood and platelet counts, serum hemoglobin, albumin, C-reactive protein (CRP), total cholesterol, triglyceride, creatinine, iron, total iron binding capacity (TIBC), ferritin, calcium, phosphorus, total cholesterol, and triglyceride. Transferrin saturation (TSAT) was calculated by the ratio of serum iron and TIBC. Serum creatinine was measured by an isotope dilution mass spectrometry (IDMS)-traceable method and eGFR was calculated by the 4-variable Modification of Diet in Renal Disease (MDRD) equation (13). All patients were categorized as CKD stage 1, 2, 3a, 3b, 4, and 5 using the Kidney Disease Improving Global Outcomes (KDIGO) guidelines (14). We defined anemia as a hemoglobin concentration is less than 13 g/dL in males and less than 12 g/dL in females according to the KDIGO guidelines or a state receiving erythropoiesis stimulating agents (15).
We examined the prescription rate of ESAs in patients with hemoglobin less than 10 g/dL and that of the intravenous iron supplements to subjects who had anemia, TSAT lower than 30.0% and ferritin lower than 500 ng/mL according to the KDIGO guidelines (15). Considering the current coverage by Korean National Health Insurance Service (KNHIS), we also evaluated the use of ESAs in CKD stage 3–5 patients having hemoglobin less than 10 g/dL, and the use of intravenous iron agents in patients with TSAT < 20.0% or ferritin < 100 ng/mL having hemoglobin less than 10 g/dL.
Statistical analysis
All analyses were performed in IBM SPSS® Statistics version 21 (IBM Corp., Armonk, NY, USA) Continuous variables were presented as means ± standard deviations and compared by t test. Categorical variables were expressed as the number and the proportions and compared using χ2 test. A multivariate logistic regression analysis was used to determine contributing factors for anemia, where all independent variables with univariate associations were allowed to enter the model. The 2-sided P < 0.05 was considered statistically significant for all analyses.
Ethics statement
The study was carried out in accordance with the Declaration of Helsinki. The study protocol was reviewed and approved by the Institutional Review Board of Eulji Medical Center (IRB No. 201105-01) and other participating hospital's Clinical Trial Centers. All patients provided their written informed consent before entering the study.
RESULTS
Prevalence of anemia
Among 2,198 non-dialysis CKD stage 1–5 patients, 987 patients (44.9%) had anemia (Table 1). Among 987 patients with anemia, 16 subjects were diagnosed because of receiving ESA. More than half (51.8%) of female CKD patients had anemia. The prevalence of anemia increased with worsening renal function; 10.0% in stage 1, 15.9% in stage 2, 32.8% in stage 3a, 46.6% in stage 3b, 78.9% in CKD 4, and 96.5% in stage 5 (χ2
trend
= 650.2, P < 0.001). With respect to the etiologic disease subgroups, subgroups with diabetic nephropathy (DN) had the highest overall prevalence of anemia (75.9%) than other etiologic subgroups.
Table 1
Prevalence of anemia in various conditions
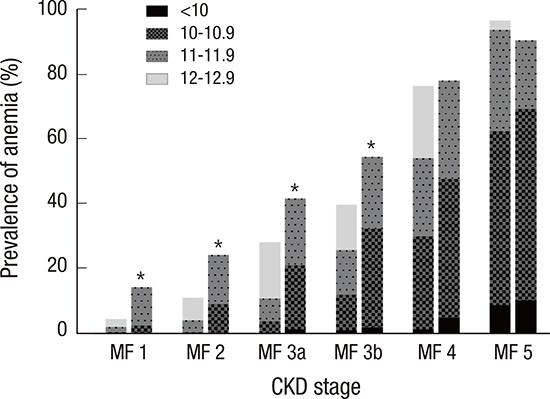
When stratified by CKD stages, the female patients showed higher prevalence of anemia than males in CKD stage 1–3b (Fig. 1). In addition, the severity of anemia also increased as the kidney function declined. From CKD stage 1 to 4, DN subgroup exhibited higher prevalence of anemia than the other etiologic subgroups (Fig. 2). The hemoglobin level was 12.1 ± 2.0 g/dL and 13.2 ± 1.9 g/dL in diabetic and non-diabetic CKD patients, respectively (P < 0.001).
Fig. 1
The prevalence of anemia among males and females with CKD according to the CKD stages.
The prevalence and the severity of anemia increased with the progression of CKD stages. When compared to the males, females showed higher prevalence of anemia in CKD stage 1–3b.
CKD = chronic kidney disease, M = males, F = females.
*P < 0.05 for male vs. female.
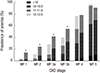
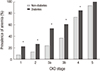
Fig. 2
The prevalence of anemia in CKD patients with and without diabetes mellitus according to the CKD stages.
DN subgroup exhibited higher prevalence of anemia than the other etiologic subgroups in CKD stage 1–4.
CKD = chronic kidney disease, DN = diabetic nephropathy.
*P < 0.05 for diabetes vs. non diabetes.
Relating factors with anemia
The clinical differences between patients with and without anemia were shown in Table 2. The association of various clinical factors and laboratory parameters with anemia was examined using a univariate logistic regression analysis (Table 3). Among them, all the significant variables were included in the multivariate logistic regression model. The risk for anemia increased with the stages of CKD in the stepwise manner (odds ratio [OR]: 1.97 for stage 2, 4.27 for stage 3a, 6.33 for stage 3b, 22.7 for stage 4, 97.0 for stage 5, stage 1 as the reference). DN showed 4.7-fold higher risk of anemia. The lower BMI of 18.5–22.9 was associated with elevated risk of anemia compared with BMI between 23.0 and 24.9 as the reference, whereas higher BMI lowered the ORs for anemia in a dose-dependent manner. Current smoker showed 42.0% reduction of risk for anemia compared with non-smoker.
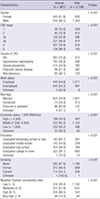
Table 2
Comparisons of clinical and laboratory data between patients with and without anemia
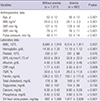
Table 3
Risk factors associated with anemia in patients with CKD, using multivariate logistic regression
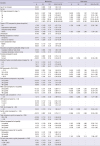
In regard to iron markers, 4.2-fold increased risk was observed in the group with TSAT < 20.0%, while 31.0% reduction of OR was shown in the group with ferritin > 100 ng/mL.
When the white blood cell (WBC) count was divided into quartiles, the higher quartiles were associated with lower risk of having anemia. Lower albumin level (less than 4.0 g/dL), lower quartiles of serum calcium concentration (compared to the highest quartile), and the highest quartile of serum phosphate level (compared to the lowest quartile) was associated with elevated ORs for anemia.
Iron status and management of anemia
Among 2,127 subjects with CKD stage 1–5 with TSAT and ferritin levels available at enrollment, 297 patients (14.0%) had TSAT less than 20.0% and 1,070 (50.3%) had ferritin less than 100 ng/mL (Table 4). The proportion of patients having TSAT less than 20.0% was higher in patients with anemia than without anemia (20.0% vs. 9.2%; respectively, P < 0.001). Of 938 patients with anemia, 44.3% showed TSAT more than 20.0% and ferritin more than 100 ng/mL.
Table 4
Comparison of iron status between patients with and without anemia

Among patients with anemia, the prescription rate of iron agents was 28.7% when TSAT was less than 20.0%, and 27.5% when TSAT was higher than 20.0% (Table 5).
Table 5
Treatment with iron agents in patients with anemia
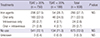
Considering the current coverage of KNHIS, 7 (7.9%) among 88 applicable subjects were replaced by intravenous iron. Only 6 (1.2%) out of 520 patients applicable intravenous iron supplement according to KDIGO guidelines were managed by intravenous iron.
The number of patients having hemoglobin level less than 10 g/dL was 177 (8.1%) out of 2,198 subjects. Among them, 59 (33.3%) received ESAs. According to the current coverage by KNHIS, we found 101 patients who were applicable for ESAs, in other words, who had hemoglobin less than 10 g/dL in CKD stage 4, 5. Among them, 56 patients (42.7%) received ESAs.
DISCUSSION
In this study, the overall prevalence of anemia in non-dialysis patients with CKD stage 1–5 was 44.9%. The similar Chinese cohort including 2,420 CKD stage 1–5 patients aged 18–75 reported that 51.5% of patients had anemia (9). A Japanese cohort study showed that 32.3% of 2,930 patients with CKD stage 3–5 were diagnosed as anemia (16). In the United States, the prevalence of anemia in CKD patients was 15.4% in a NHANES study including 410 CKD stage 1–5 subjects older than 18, and 46% in Chronic Renal Insufficiency Cohort (CRIC) study, which examined 762 CKD stage 1–5 patients older than 55 years (58). Considering the discrepancy of prevalence of anemia, our result might be higher than in real Korean population, and large population based studies are needed to confirm that.
We examined the contributing factors to anemia using a univariate and multivariate logistic regression analyses. As for CKD stages, the OR became significant from the stage 2 to 5 compared with stage 1. In contrast, gender or age was not significant factors associated with anemia. DN showed 4.7-fold higher risk of anemia than glomerulonephritis, which is consistent with a previous study (17). As well as the increase in inflammatory cytokines, hyperglycemia induced renal interstitial fibrosis and decrease in hypoxia-inducible transcription factor-1α can lead the anemia in diabetes patients by erythropoietin deficiency (1819). Compared with non-smoker, current smoker but not former smoker showed lower risk of anemia. Current smoking may cause relative hypoxia and stimulate the erythropoiesis via hypoxia inducible factor pathway. In terms of blood pressure, higher systolic blood pressure (SBP), lower diastolic blood pressure (DBP), and wide pulse pressure was associated with anemia in a univariate model. The widening of pulse pressure frequently occurs in CKD patients with vascular calcification, which is another well-known complication in CKD. However, when we included pulse pressure into the multivariate model, its statistical significance disappeared.
Interestingly, higher BMI was associated with lower risk of anemia. A J-shaped association of mortality with the BMI is well known and the risk of all-cause mortality was lowest with a BMI of 23.0–24.9 in a population based Korean study (20). Underweight may represent the malnourished state, which is closely related with chronic inflammation in CKD. In parallel, low serum albumin level showed OR of 1.9. It would be needed to investigate the interplay between the nutritional markers and inflammatory cytokines or adipokines on the development of anemia in CKD.
The association of lower WBC count with anemia may represent the bone marrow suppression due to uremia. Lower calcium level and high phosphorus concentration was independently associated with anemia. A population-based study from Southern California region demonstrated that higher phosphorous levels were associated with anemia in a group of early CKD and even with normal kidney function (21). Investigation of the underlying mechanism between the bone-mineral metabolism and anemia in the early CKD would be needed in the future (22).
In this study, the ESA treatment of anemia was not enough based on the current guidelines. The recent KDIGO guidelines suggested physicians to make a decision whether to initiate ESAs considering the risk and benefit in adult non-dialysis CKD patients with hemoglobin less than 10.0 g/dL (15). In Korea, ESA is reimbursed by KNHIS when hemoglobin levels are lower than 10.0 g/dL in CKD stage 4–5 patients and can be maintained up to 11.0 g/dL. In our study, ESAs were used in 33.7% and 42.7% among CKD patients who were applicable for ESAs according to the KDIGO and KNHIS recommendations, respectively. Our subjects are from KNOW-CKD cohort which excluded the patients with past or current history of malignancy, thus possible limitation of usage of ESAs due to malignancy was negligible.
Iron deficiency is 1 of common and treatable causes of anemia in CKD patients. In the advanced stages of CKD, the threshold of ferritin level for iron replacement should be higher than subjects with normal renal function because its level increased in the inflammatory reaction of uremia. Since Kidney Disease Outcomes Quality Initiative (KDOQI) 2006 workgroup recommended to target serum ferritin level more than 100 ng/mL in non-dialysis end stage renal disease patients without any definite evidences, a randomized control study showed beneficial erythropoietic effect of iron treatment in CKD 3–5 patients having ferritin even more than 100 ng/mL (2324). According to that result, KDIGO 2012 guidelines recommended to try intravenous iron when TSAT is less than 30.0% and ferritin is less than 500 ng/mL in adult CKD patients with anemia considering the benefit and risk (15). Until now, there have been no studies suggesting the target ferritin level in patients with CKD stage 1–2. We used the cutoff value of ferritin at 100 ng/mL and TSAT at 20.0% in accordance with similar studies including patients with CKD stage 1–5 (925). Among patients with anemia, 44.3% had TSAT more than 20.0% and ferritin more than 100 ng/mL in this study. The other causes than iron deficiency, such as erythropoietin deficiency, uremia related inhibition of erythropoiesis, and short life span of the red blood cell may be responsible for anemia in those subjects. More than half (50.3%) of CKD patients in stage 1–5 had ferritin lower than 100 ng/mL, and the proportion was not different with subjects having ferritin more than 100 ng/mL. The prevalence of TSAT < 20.0% in patients with anemia was as twice as patients without anemia. In a multivariate analysis, TSAT lower than 20.0% was associated with 4.2-fold higher risk of anemia, but ferritin < 100 ng/mL showed even the negative association with anemia. The poor correlation of ferritin level and anemia in CKD patients could be explained by hepcidin as well as uremic inflammation. Hepcidin inhibits the iron usage by degradation of iron transporter ferroportin, and its serum level is increased in CKD patients (26). In that condition, ferritin could be elevated in spite of poor usage of intracellular iron. We planned a further study to examine the relation with hepcidin and anemia in KNOW-CKD cohort.
The rate of prescription with iron agents was lower than expected in this study. In patients with anemia and TSAT lower than 20.0%, iron agents were supplemented in only 28.7%. The prescription rates of iron supplement were not different between the group with TSAT more than 20.0% and the other 1 with TSAT less than 20.0%. Currently, KNHIS covered the use of intravenous iron in CKD patients with TSAT < 20.0% or ferritin < 100 ng/mL with hemoglobin lower than 10 g/dL in Korea. The intravenous iron supplement was given in only 1.9% and 7.9% among the applicable patients according to KDIGO guidelines and KNHIS coverage, respectively. However, the utilization pattern of iron agents and ESAs in the clinical setting can be influenced by more complex factors, such as the concern about the safety of iron and ESA treatment, socio-economic status of the patients, and physician's preferences (272829).
In summary, the overall prevalence of anemia, defined by World Health Organization (WHO) criteria or using ESAs, was about 45.0% and the proportion of having anemia started to increase exponentially from as early as stage 2. This cross-sectional analysis using data captured at enrollment showed an independent association of anemia with CKD stages, cause of CKD, BMI, smoking, WBC count, serum albumin, iron markers, and bone mineral metabolism. The true causal relationship of these variables with anemia should be investigated with longitudinal follow-up of the KNOW-CKD cohort. The low prescription rate of iron agents and ESAs was found in this study, emphasizing the need for further analysis of its cause and possible solution.
 XML Download