

 PDF
PDF ePub
ePub Citation
 Print
Print


INTRODUCTION
The number of patients with end-stage renal disease (ESRD) requiring renal replacement therapy has been consistently increasing during the last decades and has become a socio-economic burden worldwide, including in Korea. A recent survey from the ESRD registry database of the Korean Society of Nephrology showed that the annual growth rate of dialysis-dependent ESRD patients was 9% during 2000–2013 (1). The prevalence of predialysis chronic kidney disease (CKD) has been reported to be 10%–14% in North America and Japan (2345) and 8.2%–13.8% in Korea (67).
Cardiovascular disease (CVD) is the most common cause of death in ESRD patients, and even in predialysis patients with CKD, the risk of CVD increases as the estimated glomerular filtration rate (eGFR) decreases, particularly at a level < 60 mL/min−1/1.73 m−2 (8). Of note, many CKD patients die of CVD before they progress to ESRD (9). It is well known that CVD is highly prevalent in patients with CKD. The Chronic Renal Insufficiency Cohort study reported that 34.0% of CKD patients in the United States had ischemic heart disease or heart failure (10). Interestingly, cardiovascular prevalence and mortality can vary among different ethnic groups, and racial differences and socioeconomic disparities can determine the clinical outcomes of CKD patients (11121314). However, studies examining cardiovascular characteristics in Asian patients with CKD are scarce. In a Japanese cohort study, the prevalence of CVD was 25.6% (15); however, only patients with an eGFR of 10–59 mL/min−1/1.73 m−2 were included, and thus patients with early stages of CKD were excluded. Recently, the Kidney Disease: Improving Global Outcomes (KDIGO) guidelines adopted the importance of albuminuria and proposed a new CKD staging based on cause, glomerular filtration rate category, and albuminuria category (the CGA staging system) (16). In fact, albuminuria is an important risk factor of CVD in the general population (17), and the risk of cardiovascular mortality significantly increases in patients with a urine albumin-creatinine ratio of > 30 mg/g with a preserved eGFR of ≥ 60 mL/min/1.73 m2 (18).
With this background, the KoreaN Cohort Study for Outcome in Patients With Chronic Kidney Disease (KNOW-CKD) was initiated in 2011. The cohort comprises 5 subcohorts and encompasses early stages of CKD. The main purposes of the KNOW-CKD study are to define the clinical characteristics of Korean CKD patients, and to identify factors associated with kidney disease progression and mortality. This study particularly details the baseline cardiovascular characteristics of those patients.
MATERIALS AND METHODS
Study protocol and population
The KNOW-CKD study is a nationwide prospective cohort study involving 9 tertiary-care general hospitals: Seoul National University Hospital, Seoul National University Bundang Hospital, Yonsei University Severance Hospital, Kangbuk Samsung Medical Center, Seoul St. Mary's Hospital, Gil Hospital, Eulji General Hospital, Chonnam National University Hospital, and Pusan Paik Hospital. The rationale, design, inclusion criteria, and method of the study were described in detail elsewhere (19) (NCT01630486 at http://www.clinicaltrials.gov). Between 2011 and 2015, information of the study had been provided for the patients who were treated in each center. Informed consent encompassed study's purpose, duration, procedures, alternatives, risks, benefits, and subject's rights to withdraw of the study at any time. As a result, 2,341 participants who voluntarily provided informed consent were enrolled. We additionally excluded 103 participants who violated the inclusion criteria, or had no data of isotope dilution mass spectrometry (IDMS)-calibrated creatinine. Therefore, a total of 2,238 participants were finally included in the study. The CKD stages were classified according to eGFR calculated by using the Modification of Diet in Renal Disease equation (20).
All subjects were categorized into 5 subcohorts according to the etiology of CKD: glomerulonephritis (GN), diabetic nephropathy (DN), hypertensive nephropathy (HTN), and polycystic kidney disease (PKD). The patients with CKD of unknown origin was classified into ‘Unclassified’ group. The definition and diagnosis were defined on the basis of pathologic results in subjects who underwent kidney biopsy. Otherwise, clinical diagnosis was made with caution by nephrologists based on demographic, clinical, and laboratory data. The details of the definition of each disease category were described elsewhere (19).
Data collection
Baseline socio-demographic characteristics; clinical information such as comorbid diseases, family history, smoking status, and medication history; and anthropometric data such as height, weight, and waist-to-hip ratio were collected at enrollment. In addition, blood pressure was measured by using an electronic sphygmomanometer after 5 minutes of seated rest. The presence of CVD was defined as a history of myocardial infarction (MI), coronary revascularization, coronary artery bypass graft, peripheral arterial disease, ischemic or hemorrhagic cerebrovascular disease, or arrhythmia. To assess cardiovascular risk, the coronary arterial calcification (CAC) score, left ventricular mass index (LVMI), and pulse wave velocity (PWV) were measured at each center. CAC and LVMI were determined by using multidetector computed tomography (CT) and 2-dimensional echocardiography, respectively. LVMI was calculated from the left ventricular mass divided by the body surface area. Left ventricular geometry was categorized into 4 groups according to relative wall thickness and LVMI: normal, concentric remodeling, eccentric left ventricular hypertrophy (LVH), and concentric LVH (21). PWV was defined as the calculated distance between the arm and leg from the height divided by the time delay between proximal and distal foot waveforms obtained from plethysmographic and oscillometric sensors (brachial-ankle PWV [baPWV]). Blood samples were obtained at each center, and 10 mL of whole blood in a serum separation tube was centrifuged within 1 hour for serum separation and sent to a central laboratory. First-voided urine samples (15 mL) were collected to measure urine albumin, protein, and creatinine. Patients were classified into 3 groups according to urine albumin to creatinine ratio (ACR): ACR < 30 mg/g for A1, 30 ≤ ACR < 300 mg/g for A2, ACR ≥ 300 mg/g for A3.
Statistical analysis
Continuous variables are expressed as mean ± standard deviation, and compared with 1-way analysis of variance. To compare variables between 2 groups, post-hoc analysis was performed with Bonferroni analysis. The normality of the distribution of parameters was analyzed by using the Kolmogorov-Smirnov test. Nonparametric variables are expressed as median and ranges (mininum to maximum), and compared by using the Kruskal-Wallis test. Categorical variables are expressed as numbers and percentages, and compared by using χ2 test. Univariate correlation analysis was performed with Spearman correlation analysis to assess the relationship between eGFR and other parameters. Statistical significance was defined as P < 0.05, and all analyses were conducted with SPSS version 20.0 (IBM Corporation, Armonk, NY, USA).
Ethics statement
The study was carried out in accordance with the principles of the Declaration of Helsinki. The present study protocol was reviewed and approved by the Institutional Review Boards at each participating center (IRB approval number of Yonsei University Severance Hospital: 4-2011-0163). Written informed consent was obtained from all participants before enrollment. The protocol summary was also registered at ClinicalTrials.gov (NCT01630486).
RESULTS
Baseline characteristics
The baseline characteristics of the patients according to subcohorts are presented in Table 1. We compared 4 subcohorts whose etiology of CKD had been confirmed, and present baseline characteristics of unclassified subcohort in Supplementary Table 1. The mean age was 53.7 ± 12.2 years, and patients in the DN and HTN subcohorts were older than those in the other 2 subcohorts (P < 0.001). Almost all patients (96.1%) had hypertension, and the mean systolic blood pressure (SBP) and diastolic blood pressure (DBP) were 127.8 ± 16.2 and 77.0 ± 11.1 mmHg, respectively. The mean level of random urine albumin-to-creatinine ratio was 901.4 mg/g. The mean creatinine level and eGFR of the entire cohort were 1.8 ± 1.1 mg/dL and 50.5 ± 30.3 mL/min−1/1.73 m−2, respectively. The HTN subcohort had more male patients and current smokers than the other subcohorts. The DN subcohort had higher body mass index (BMI) and lower levels of eGFR, cholesterol, hemoglobin, and albumin than the other subcohorts (P < 0.001 for all). Of the entire cohort, 85.2% had been treated with an angiotensin receptor blocker (79.8%) or an angiotensin-converting enzyme inhibitor (11.1%) and 127 (5.7%) patients had taken dual blockades.
Table 1
Baseline characteristics and prevalence of CVD according to the etiology of CKD
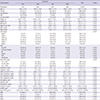
Values are presented as number (%) or mean ± standard deviation.
CVD = cardiovascular disease, CKD = chronic kidney disease, DN = diabetic nephropathy, HTN = hypertensive nephropathy, GN = glomerulonephritis, PKD = polycystic kidney disease, BMI = body mass index, DM = diabetes mellitus, SBP = systolic blood pressure, DBP = diastolic blood pressure, MI = myocardial infarction, PAD = peripheral arterial disease, ACR = albumin-to-creatinine ratio, eGFR = estimated glomerular filtration rate, LDL = low-density lipoprotein, HDL = high-density lipoprotein hsCRP = high-sensitive C-reactive protein, PTH = parathyroid hormone, ARB = angiotensin receptor blocker, ACEi = angiotensin converting enzyme inhibitor, CCB = calcium channel blocker.
*Data are expressed as median and ranges (minimum to maximum).
The baseline characteristics according to CKD stages are presented in Table 2. The prevalences of hypertension, diabetes, and macroalbuminuria were significantly higher in patients with advanced stages of CKD (P < 0.001 for all). These groups were older and included more female patients (P < 0.001, respectively). In addition, the serum levels of cholesterol, hemoglobin, and albumin were lower, whereas those of phosphorus, high-sensitive C-reactive protein (hsCRP), and intact parathyroid hormone were higher across the CKD stages (P = 0.001 for hsCRP, P < 0.001 for the others).
Table 2
Baseline characteristics and prevalence of CVD according to CKD stages
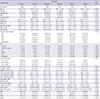
Data are expressed as number (%) or mean ± standard deviation.
CVD = cardiovascular disease, CKD = chronic kidney disease, BMI = body mass index, DM = diabetes mellitus, SBP = systolic blood pressure, DBP = diastolic blood pressure, GN = glomerulonephritis, DN = diabetic nephropathy, HTN = hypertensive nephropathy, PKD = polycystic kidney disease, MI = myocardial infarction, PAD = peripheral arterial disease, ACR = albumin-to-creatinine ratio, eGFR = estimated glomerular filtration rate, LDL = low-density lipoprotein, HDL = high-density lipoprotein, hsCRP = high-sensitive C-reactive protein, PTH = parathyroid hormone, ARB = angiotensin receptor blocker, ACEi = angiotensin converting enzyme inhibitor, CCB = calcium channel blocker.
*Data are expressed as median and ranges (minimum to maximum).
Cardiovascular risk profiles by 4 subcohorts
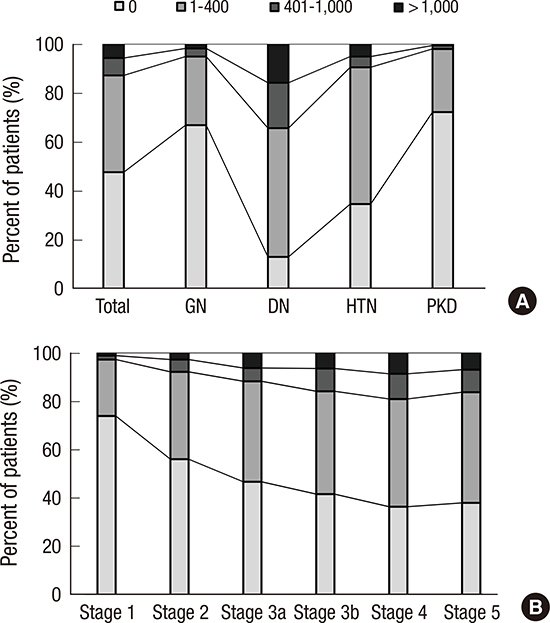
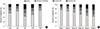
The prevalence of any CVD in the entire cohort was 14.4% (Table 1). A total of 1.6% and 6.0% patients had prior history of MI and stroke, respectively. The overall prevalence of CVD was higher in the DN and HTN subcohorts than in the GN and PKD subcohorts. Approximately 5% of patients had coronary disease, and the prevalence was significantly higher in the DN subcohort (11.6%). The DN subcohort also had higher levels of SBP (P < 0.001 for each subcohort), and cardiac troponin T (P < 0.001 for each subcohort) than the other subcohorts. To further delineate cardiovascular risk, arterial stiffness, CAC score, and left ventricular geometry were evaluated. Compared with the other subcohorts, the DN subcohort had significantly higher baPWV (Fig. 1A) (1,803.8 ± 375.2 cm/s, P < 0.001 for each subcohort). When the CAC score was grouped into 4 categories based on the cutoff values of 0, 1–400, 401–1,000, and > 1,000, the prevalence of each group was as follows: 47.7% for the 0 group, 39.5% for the 1–400 group, 7.1% for the 401–1,000 group, and 5.7% for the > 1,000 group (Fig. 2A). The DN subcohort had significantly higher CAC scores (495.5 ± 826.9, P < 0.001 for each subcohort) and more patients with a CAC score of > 1,000 than the other subcohorts (15.8%). The mean LVMI was 88.5 ± 23.4 g/m2 in female patients and 97.3 ± 25.9 g/m2 in male patients (Fig. 3). The level of LVMI was significantly higher in the DN subcohort than in the GN and PKD subcohorts (103.0 ± 25.0 g/m2, P < 0.001 for each subcohort). In addition, both eccentric LVH and concentric LVH were more predominant in the DN subcohort (eccentric LVH, 16.4%; concentric LVH, 21.3%) than in the GN and PKD subcohorts (Fig. 4, P
< 0.001 for each subcohort). All these adverse features were also observed in the HTN subcohort. The degree of cardiovascular risk profiles was less severe than that in the DN subcohort, but worse than those in the other 2 subcohorts.
Fig. 1
baPWV of the participants. (A) baPWV according to the etiology of CKD. (B) baPWV according to the CKD stages.
baPWV = brachial-ankle pulse wave velocity, CKD = chronic kidney disease, GN = glomerulonephritis, DN = diabetic nephropathy, HTN = hypertensive nephropathy, PKD = polycystic kidney disease.

Fig. 2
Categories of CAC score in the participants. (A) CAC according to the etiology of CKD. (B) CAC according to CKD stages.
CAC = coronary arterial calcium, CKD = chronic kidney disease, GN = glomerulonephritis, DN = diabetic nephropathy, HTN = hypertensive nephropathy, PKD = polycystic kidney disease.
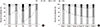
Fig. 3
LVMI of the participants. (A) LVMI according to the etiology of CKD. (B) LVMI according to CKD stages.
LVMI = left ventricular mass index, CKD = chronic kidney disease, GN = glomerulonephritis, DN = diabetic nephropathy, HTN = hypertensive nephropathy, PKD = polycystic kidney disease.
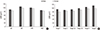
Fig. 4
LV geometry of the participants. (A) LV geometry according to the etiology of CKD. (B) LV geometry according to CKD stages.
LV = Left ventricular, CKD = chronic kidney disease, GN = glomerulonephritis, DN = diabetic nephropathy, HTN = hypertensive nephropathy, PKD = polycystic kidney disease.
Cardiovascular risk profiles according to CKD stages
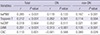
We also compared the cardiovascular risk profiles according to CKD stages. The prevalence of CVD increased as the CKD stage became more advanced (Table 2). In addition, SBP and the levels of hsCRP and cardiac troponin T were significantly higher in patients with advanced stages of CKD. Furthermore, the baPWV, CAC score, and LVMI were also higher across the CKD stages. When the relation between eGFR and these parameters was assessed by using the Spearman correlation coefficient, eGFR was found to be inversely correlated with hsCRP (r = −0.129, P < 0.001), cardiac troponin T (r = −0.637, P < 0.001), baPWV (r = −0.340, P < 0.001), CAC score (r = −0.245, P < 0.001), and LVMI (r =−0.272, P < 0.001) (Table 3). In subgroup analyses, baPWV (r = −0.111, P = 0.02), troponin T (r = −0.273, P < 0.001), hsCRP (r = −0.098, P = 0.030), and LVMI (r = −0.267, P < 0.001) was correlated with eGFR in DN subgroup, whereas LVMI (r = −0.187, P < 0.001) was only correlated with eGFR in HTN subgroup. We also examined the relationship between these parameters and urinary ACR (Table 4). In all subjects, cardiovascular parameters except hsCRP were significantly correlated with albuminuria, and this association also found in non-DN subcohort. However, only troponin T (r = 0.262, P = 0.001) and LVMI (r = 0.313, P < 0.001) were significantly associated with ACR in DN subcohort.
Table 3
Correlations of cardiovascular parameters with eGFR
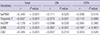
Table 4
Correlation of cardiovascular parameters with urine ACR
DISCUSSION
In this study, we evaluated the baseline cardiovascular characteristics in Korean adult patients with CKD. We found that the prevalence of CVD was 14.4%, and higher in the DN and HTN subcohorts. The DN subcohort exhibited worst cardiovascular risk profiles, followed by the HTN subcohort. In addition, the cardiovascular risk profiles became worse in advanced stages of CKD and all parameters representing cardiovascular risk were inversely correlated with eGFR. These findings suggest that CKD patients have a high cardiovascular risk, particularly in the presence of DN and severe kidney disease.
It should be noted that the prevalence of CVD in our study was relatively lower than that reported in previous CKD cohorts from the United States and Japan (1015). A direct comparison of CVD prevalence is not feasible because there are many differences between the study cohorts. In particular, the KNOW-CKD study had more patients with earlier stages of CKD than the other cohorts. Nevertheless, when we compared only patients with advanced stages of CKD (eGFR < 30 mL/min/1.73 m2), the prevalence of CVD in our study (20.0%) was still lower than that in the United States (39.6%) and Japan (27.9%). Some demographic and clinical factors may explain these differences. The subjects in our cohort (53.7 years) were younger than those in the U.S. and Japanese cohorts (58.2 and 60.8 years, respectively), and the prevalence of diabetes (33.7%) was lower than those in the 2 cohorts (48.0% and 37.6%, respectively). The blood pressure, BMI, lipid profiles, and hsCRP levels also differed among the cohorts—they were more favorably controlled in our cohort. Ethnicity may also have an influence on the different prevalences of CVD. Generally, it has been suggested that Asians have a lower cardiovascular burden than the other ethnic groups. In the United States, Asian Americans had lower ESRD mortality than white Americans (22). In line with this finding, the Dialysis Outcomes and Practice Patterns Study showed that the mortality rates in ESRD patients in the United States and Europe were significantly higher than those in Japan (23). This observational study also found that the prevalences of coronary disease and cerebrovascular disease were lower in Japanese patients. The practical patterns of dialysis vary across countries, which can also contribute to differences in cardiovascular burden. CVD is a consequence of complex interactions between genetic and environmental risk factors. Differences in regional socio-economic status, dietary habits, and genetic factors may result in different cardiovascular risks. In this regard, it would be interesting to see whether this relatively low cardiovascular burden in our cohort will lead to superior outcomes in the future, after these patients start dialysis therapy, compared with those seen in Western countries.
Not surprisingly, the KNOW-CKD study showed that diabetic patients were at a high risk for CVD, as previously reported in other cohort studies (101524). With the rapid transition to a Westernized lifestyle, the prevalence of diabetes has increased during the last decades in Korea, and about 10% of persons without CKD aged ≥ 30 years had diabetes (25). A recent study using the Korean National Health and Nutrition Examination Survey V reported that the prevalence of CKD was 5 times higher in patients with diabetes than in those without, and that diabetic patients were more likely to have advanced stages of CKD (26). Accordingly, it is not surprising that diabetes has been a leading cause of ESRD, and that half of the ESRD patients started receiving dialysis because of DN in Korea. In this study, all parameters representing adverse cardiovascular risk were significantly higher in the DN subcohort. Because the cardiovascular risk profiles deteriorated in patients with advanced stages of CKD and were inversely correlated with eGFR, the lower eGFR in the DN subcohort may further aggravate the cardiovascular burden. Therefore, it is very likely that these patients will develop adverse cardiovascular events in the future, although most of the patients did not have overt CVD at baseline.
The baseline cardiovascular characteristics in the KNOW-CKD cohort are similar to those of other cohorts in that cardiovascular risks were high in the advanced stages of CKD. In this study, we showed that the baPWV, LVMI, and CAC score were higher in the advanced stages of CKD and were inversely correlated with eGFR. These findings are not novel, but are in agreement with many other studies (272829). All 3 parameters have been considered important determinants of adverse cardiovascular outcomes in CKD patients (303132). However, most studies have not conducted follow-up examinations, and their findings were based on cross-sectional analyses. Arterial stiffness, LVH, and vascular calcification are dynamic processes that inevitably progress as the kidney function declines. The KNOW-CKD study will observe the changes of these parameters by performing follow-up tests such as PWV, echocardiography, and CT scan, and will be able to provide novel insights with respect to structural and functional alterations of vasculature in CKD patients. In addition, our cohort study will perform follow-up on a variety of cardiovascular biomarkers such as hsCRP, cardiac troponin T, adiponectin, klotho, and fibroblast growth factor 23. More in-depth investigations will be performed to clarify the associations between these biomarkers and the future adverse cardiovascular outcomes, and to explore whether the biomarkers can play a role in the dynamic alterations of vasculature in CKD patients.
Our study has several limitations. First, although the KNOW-CKD is the first and largest CKD cohort study in Korea, its findings may not represent the entire population of CKD in Korea. The prevalence of CVD can significantly vary among etiologies of CKD, and different proportions of causative diseases can result in differences in cardiovascular risk. In fact, our cohort included more patients with PKD than the other cohort studies. As seen in our study, the cardiovascular risk profiles in these patients were lower than those in the DN and HTN cohorts. However, a high prevalence of CVD in PKD patients was also reported previously because hypertension, LVH, cardiac valvular abnormalities, and intracranial aneurysm can occur during the disease course (33). Therefore, it is reasonable to include a variety of kidney diseases in a CKD cohort study. Second, our observations were based on cross-sectional analyses and could not confirm causality. This is a common limitation of all cohort studies. However, cohort studies have many strengths, including their ability to clarify the temporal sequence between exposure and outcome, estimate the precise incidence of outcome and relative risk, and allow the examination of multiple complicated effects of a specific causative factor. From the viewpoint of cardiovascular risk in CKD, we hope that this cohort study will be able to find some novel biomarkers and therapeutic targets, and also to provide guidelines for preventing adverse cardiovascular events and mortality in patients with CKD.
In conclusion, this study shows that the KNOW-CKD cohort exhibits a high cardiovascular burden, as other CKD cohorts in previous studies. Among the subcohorts, the DN subcohort posed the greatest risk for CVD. The ongoing long-term follow-up study up to 10 years will further delineate the cardiovascular characteristics and outcomes of each subcohort with different risk profiles.
 XML Download