Journal List > J Korean Med Sci > v.32(11) > 1108360

Lee, Min, Bae, Lee, Min, Lee, Rhee, and Kim: Lactate Parameters Predict Clinical Outcomes in Patients with Nonvariceal Upper Gastrointestinal Bleeding

Abstract

The predictive role of lactate in patients with nonvariceal upper gastrointestinal bleeding (NVUGIB) has been suggested. This study evaluated several lactate parameters in terms of predicting outcomes of bleeding patients and sought to establish a new scoring model by combining lactate parameters and the AIMS65 score. A total of 114 patients with NVUGIB who underwent serum lactate level testing at least twice and endoscopic hemostasis within 24 hours after admission were retrospectively analyzed. The associations between five lactate parameters and clinical outcomes were evaluated and the predictive power of lactate parameter combined AIMS65s (L-AIMS65s) and AIMS56 scoring was compared. The most common cause of bleeding was gastric ulcer (48.2%). Lactate clearance rate (LCR) was associated with 30-day rebleeding (odds ratio [OR], 0.931; 95% confidence interval [CI], 0.872–0.994; P = 0.033). Initial lactate (OR, 1.313; 95% CI, 1.050–1.643; P = 0.017), maximal lactate (OR, 1.277; 95% CI, 1.037–1.573; P = 0.021), and average lactate (OR, 1.535; 95% CI, 1.137–2.072; P = 0.005) levels were associated with 30-day mortality. Initial lactate (OR, 1.213; 95% CI, 1.027–1.432; P = 0.023), maximal lactate (OR, 1.271; 95% CI, 1.074–1.504; P = 0.005), and average lactate (OR, 1.501; 95% CI, 1.150–1.959; P = 0.003) levels were associated with admission over 7 days. Although L-AIMS65s showed the highest area under the curve for prediction of each outcome, differences between L-AIMS65s and AIMS65 did not reach statistical significance. In conclusion, lactate parameters have a prognostic role in patients with NVUGIB. However, they do not increase the predictive power of AIMS65 when combined.

Graphical Abstract

jkms-32-1820-abf001

INTRODUCTION

Nonvariceal upper gastrointestinal bleeding (NVUGIB) is one of the most common emergencies, especially in patients with co-morbidities (123). To assist in decisions like the timing of endoscopy or need for admission, early risk stratification is necessary in these patients (4). The Glasgow-Blatchford score (GBS) (5) and the Rockall score (6) have been developed to predict prognosis of patients with NVUGIB and are widely used for risk stratification of such patients. However, these scoring systems are limited due to their onerous calculations. The recently developed AIMS65 score is easy to calculate and has superior power in predicting mortality than previous scoring systems (789).
Lactate has been used to predict the severity of illness and risk of mortality in many diseases like sepsis, trauma, cancer, and pediatric cardiac diseases (10). Recent studies have demonstrated that lactate is associated with prognosis in patients with upper gastrointestinal bleeding (UGIB) (111213). Although serum lactate level and lactate clearance rate (LCR) have been evaluated as means to evaluate risk evaluation in patients with UGIB, optimal parameter of lactate for risk evaluation remains unclear.
The present study aimed to evaluate several types of lactate parameter for predicting outcomes of patients with NVUGIB and to establish the new scoring system by combining the AIMS65 score and lactate parameters (L-AIMS65s).

MATERIALS AND METHODS

Subjects

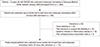
The medical records of the 1,884 adult patients (> 18 years old) with NVUGIB who underwent endoscopic hemostasis at the Samsung Medical Center between January 2006 and August 2016 were retrospectively reviewed. Of them, 199 patients underwent serum lactate level test at least twice and endoscopic hemostasis within 24 hours after admission to the emergency room or general ward. Patients were excluded because of when 1) tumor bleeding (n = 33) or post-procedure or surgical site bleeding (n = 32), 2) active systemic infection or inflammatory disease at the time of admission (n = 16), or 3) post-cardiopulmonary resuscitation state (n = 4). Finally, 114 patients were included into the analysis (Fig. 1).
Fig. 1
Flow of subject inclusion.
NVUGIB = nonvariceal upper gastrointestinal bleeding.
jkms-32-1820-g001

Measurements and outcomes

The demographic and clinical characteristics of all patients were retrieved from medical records. The information included age, sex, medical history, existence of comorbid disease, time of admission, time of endoscopic hemostasis, symptoms or signs of bleeding, occurrence of syncope or change of consciousness, vital signs including blood pressure and heart rate on admission and within 24 hours from admission, laboratory results on admission, etiology of bleeding, Forrest classification after endoscopic hemostasis, 30-day rebleeding, 30-day mortality, duration of admission, and admission to intensive care unit (ICU).
The primary outcomes were rates of rebleeding and mortality up to 30 days following admission. Secondary outcomes were development of new hypotension within 24 hours (defined as systolic blood pressure [SBP] < 90 mmHg or diastolic blood pressure < 60 mmHg without evidence of other causes of hypotension except UGIB), active bleeding (Forrest classification IA and IB) under endoscopic examination, admission to ICU, and admission over 7 days.

Lactate parameters

Venous lactate level was measured by enzymatic colorimetry using a Modular DP analyzer (Roche Diagnostics, Indianapolis, IN, USA). Five lactate parameters within 24 hours after admission were defined and calculated: 1) LCR-1 was defined as the percent decrease per hour (%/hr) in lactate from the initial level to subsequent level, 2) LCR-2 was defined as the decrease of value of serum lactate per hour (mmol/L/hr) from the initial level to subsequent level, 3) initial lactate level (mmol/L), 4) maximal lactate level (mmol/L), and 5) average lactate (mmol/L; average value of serum lactate levels).

Statistical analysis

Continuous variables are expressed as the median, and categorical variables as the number (percentage). The Mann-Whitney U and Fisher's exact tests were used to analyze continuous and categorical variables, respectively. Binary logistic regression and simple linear logistic regression analysis were used to calculate odds ratio (OR) of each lactate related parameter for primary and secondary outcomes, with 95% confidence intervals (CIs). P value < 0.05 was considered to be statistically significant. The data analysis was performed by SAS version 9.4 (SAS Institute, Cary, NC, USA).
To establish a new predictive model, we defined the new score systems as follows; 1) L-AIMS65(1) is the combination of LCR-1 with AIMS65, 2) L-AIMS65(2) is the combination of LCR-2 with AIMS65, 3) L-AIMS65(3) is the combination of initial lactate with AIMS65, 4) L-AIMS65(4) is the combination of maximal lactate level with AIMS65 score, and 5) L-AIMS65(5) is the combination of average lactate with AIMS65. We assessed the predictive powers of five lactate parameters, AIMS65 score, and L-AIMS65 scores with the area under the receiver-operating characteristic curve and compared the results using the Hanley & McNeil test. The best cut-off of the receiver operating characteristic (ROC) curve was determined as that which maximized the Youden index. ROC curves were obtained by averaging 1,000 populations bootstrapped (sampling with replacement) from the present study population.

Ethics statement

The Institutional Review Board of Samsung Medical Center approved the study protocol and waived the requirement for informed consent, since de-identified data were used (No. 2016-015).

RESULTS

Population characteristics

The patients' mean age was 65.1 ± 11.8 years. Eighty-six (75.4%) patients were male. Twenty-three (20.2%) patients were taking anticoagulant medications, and all stop taking anticoagulants after bleeding. Eleven patients restarted taking anticoagulants and 2 rebled while 12 patients did not restart and 2 rebled. Seventy-six (66.7%) patients had comorbidity. Six (5.3%) patients died within 30 days of the admission, and they could not discharge after admission. These characteristics did not differ according to the presence of 30-day rebleeding and 30-day mortality (Table 1).
Table 1

Characteristics of subjects according to the 30-day rebleeding and 30-day mortality

jkms-32-1820-i001
Parameters Overall (n = 114) Rebleeding (+) (n = 11) Rebleeding (−) (n = 103) P value Mortality (+) (n = 6) Mortality (−) (n = 108) P value
Age, yr 65.1 ± 11.8 70.9 ± 10.8 64.5 ± 11.8 0.087 65.0 ± 15.1 65.1 ± 11.6 0.982
Male 86 (75.4) 7 (63.6) 79 (76.7) 0.456 4 (66.7) 82 (75.9) 0.634
Use of anticoagulant
 None 91 (79.8) 7 (63.6) 84 (81.6) 0.228 6 (100.0) 85 (78.7) 0.345
 Aspirin 13 (11.4) 3 (27.3) 10 (9.7) 0.112 0 13 (12.0) 1.000
 Clopidogrel 8 (7.0) 1 (9.1) 7 (6.8) 0.568 0 8 (7.4) 1.000
 Warfarin 6 (5.3) 2 (18.2) 4 (3.9) 0.103 0 6 (5.6) 1.000
 NOAC 3 (2.6) 0 3 (2.9) 1.000 0 3 (2.8) 1.000
Comorbidity
 None 38 (33.3) 2 (18.2) 36 (35.0) 0.331 1 (16.7) 37 (34.3) 0.662
 Hepatic disease 29 (25.4) 1 (9.1) 28 (27.2) 0.285 4 (66.7) 25 (23.1) 0.036
 Heart failure 4 (3.5) 1 (9.1) 3 (2.9) 0.337 0 7 (3.7) 1.000
 CKD 9 (7.9) 2 (18.2) 7 (6.8) 0.209 0 9 (8.3) 1.000
 Metastatic cancer 25 (21.9) 3 (27.3) 22 (21.4) 0.704 3 (50.0) 22 (20.4) 0.118
 COPD 1 (0.9) 0 1 (1.0) 1.000 0 1 (0.9) 1.000
 DM 24 (21.1) 4 (36.4) 20 (19.4) 0.240 0 24 (22.2) 0.340
 Ischemic heart disease 12 (10.5) 3 (37.3) 9 (8.7) 0.091 0 12 (11.1) 1.000
 Cerebrovascular disease 6 (5.3) 0 6 (5.8) 1.000 0 6 (5.6) 1.000
Data are shown as mean ± standard deviation and number of subjects (percentage).
NOAC = novel oral anticoagulant, CKD = chronic kidney disease, COPD = chronic obstructive pulmonary disease, DM = diabetic mellitus.
Most common cause of bleeding was gastric ulcer (48.2%) followed by duodenal ulcer (28.1%), Dieulafoy lesion (6.3%), Mallory-Weiss tear (3.5%), and angiodysplasia (3.5%). Over half the patients had active bleeding and a third had adherent clot. These endoscopic findings did not differ according to the presence of 30-day rebleeding and 30-day mortality (Table 2).
Table 2

Endoscopic findings of subjects according to the 30-day rebleeding and 30-day mortality

jkms-32-1820-i002
Findings Overall (n = 114) Rebleeding (+) (n = 11) Rebleeding (−) (n = 103) P value Mortality (+) (n = 6) Mortality (−) (n = 108) P value
Bleeding etiology
 Gastric ulcer 55 (48.2) 6 (54.5) 49 (47.6) 0.573 3 (50.0) 52 (48.1) 1.000
 Duodenal ulcer 32 (28.1) 2 (18.2) 30 (29.1) 0.725 2 (33.3) 30 (27.8) 0.673
 Dieulafoy lesion 6 (5.3) 1 (9.1) 5 (4.9) 0.464 0 6 (5.6) 1.000
 Mallory-Weiss tear 4 (3.5) 0 4 (3.9) 1.000 1 (16.7) 3 (2.8) 0.197
 Angiodysplasia 4 (3.5) 1 (9.1) 3 (2.9) 0.337 0 4 (3.7) 1.000
 Gastritis 4 (3.5) 0 4 (3.9) 1.000 0 4 (3.7) 1.000
 Esophagitis 3 (2.6) 0 3 (2.9) 1.000 0 3 (2.8) 1.000
 Others 6 (5.3) 1 (9.1) 5 (4.9) 0.518 0 6 (5.6) 1.000
Forrest classification 0.981 0.940
 IA 15 (13.2) 2 (18.2) 13 (12.6) 1 (16.7) 14 (13.0)
 IB 46 (40.4) 5 (45.5) 41 (39.8) 2 (33.3) 44 (40.7)
 IIA 38 (33.3) 4 (36.4) 34 (33.0) 3 (50.0) 35 (32.4)
 IIB 8 (7.0) 0 8 (7.8) 0 8 (7.4)
 IIC 2 (1.8) 0 2 (1.9) 0 2 (1.9)
 III 5 (4.4) 0 5 (4.9) 0 5 (4.6)
Data are shown as number of subjects (percentage).
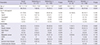
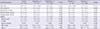
In Table 3, lactate parameters and AIMS65 components of subjects according to the 30-day rebleeding and 30-day mortality are shown. Patients who had 30-rebleeding showed a lower LCR-2 than those who did not (−0.1 ± 0.5 vs. 0.1 ± 0.4 mmol/L/hr, P = 0.027). Other lactate parameters did not differ according to the presence of 30-day rebleeding and no lactate parameters differed according to the presence of 30-day mortality. Among the AIMS65 components, albumin and prothrombin time (PT) were lower in patients who had 30-mortality than in those who did not.
Table 3

Lactate parameters and AIMS65 score of subjects according to the 30-day rebleeding and 30-day mortality

jkms-32-1820-i003
Lactate parameters Overall (n = 114) Rebleeding (+) (n = 11) Rebleeding (−) (n = 103) P value Mortality (+) (n = 6) Mortality (−) (n = 108) P value
LCR, %/hr 2.8 ± 7.7 −2.5 ± 13.4 3.4 ± 6.7 0.177 −2.0 ± 10.9 3.1 ± 7.4 0.112
LCR, mmol/L/hr 0.1 ± 0.4 −0.1 ± 0.5 0.1 ± 0.4 0.027 0.1 ± 0.2 0.1 ± 0.4 0.689
Initial lactate, mmol/L 2.7 ± 1.8 2.5 ± 1.2 3.5 ± 2.5 0.242 6.1 ± 5.3 3.2 ± 2.1 0.246
Maximal lactate, mmol/L 3.6 ± 2.6 3.6 ± 3.7 3.6 ± 2.5 0.957 6.4 ± 5.0 3.5 ± 2.4 0.222
Average lactate, mmol/L 2.7 ± 1.8 2.9 ± 2.3 2.7 ± 1.8 0.800 5.3 ± 4.5 2.6 ± 1.5 0.201
AIMS65 1.42 ± 0.9 2.0 ± 1.1 1.3 ± 0.9 0.109 2.3 ± 0.8 1.3 ± 0.9 0.015
 Albumin, g/dL 3.1 ± 0.5 2.8 ± 0.5 3.2 ± 0.5 0.064 2.5 ± 0.5 3.2 ± 0.5 0.003
 PT, INR 1.4 ± 1.0 1.3 ± 0.2 1.4 ± 1.1 0.769 2.8 ± 1.5 1.3 ± 0.9 0.001
 Altered mentality 8 (7.0) 1 (9.1) 7 (6.8) 0.568 1 (16.7) 7 (6.5) 0.360
 SBP, mmHg 110.9 ± 23.5 110.3 ± 23.1 111.0 ± 23.7 0.927 100.6 ± 24.0 111.5 ± 24.4 0.273
 Age, yr 65.1 ± 11.8 70.9 ± 10.8 64.5 ± 11.8 0.087 65.0 ± 15.1 65.1 ± 11.6 0.982
Data are shown as mean ± standard deviation and number of subjects (percentage).
LCR = lactate clearance rate, PT = prothrombin time, INR = international normalized ratio, SBP = systolic blood pressure.

Lactate parameters with prediction for outcomes

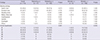
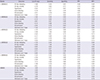
LCR-1 was associated with 30-day rebleeding (OR, 0.931; 95% CI, 0.872–0.994; P = 0.033). Initial lactate (OR, 1.313; 95% CI, 1.050–1.643; P = 0.017), maximal lactate (OR, 1.277; 95% CI, 1.037–1.573; P = 0.021), and average lactate (OR, 1.535; 95% CI, 1.137–2.072; P = 0.005) levels were associated with 30-day mortality (Table 4). Initial lactate (OR, 1.213; 95% CI, 1.027–1.432; P = 0.023), maximal lactate (OR, 1.271, 95% CI, 1.074–1.504; P = 0.005), and average lactate (OR, 1.501; 95% CI, 1.150–1.959; P = 0.003) levels were associated with admission over 7 days. However, no lactate parameters were associated with hypotension, active bleeding during endoscopy, and ICU admission.
Table 4

Outcomes according to the lactate parameters

jkms-32-1820-i004
Lactate parameters 30-day rebleeding 30-day mortality Hypotension Active bleeding ICU admission Admission over 7 days
LCR-1, %/hr OR (95% CI) 0.931 (0.872–0.994) 0.945 (0.879–1.017) 0.994 (0.936–1.057) 0.951 (0.897–1.009) 0.967 (0.911–1.025) 0.987 (0.939–1.037)
P 0.033 0.132 0.855 0.094 0.257 0.596
LCR-2, mmol/L/hr OR (95% CI) 0.089 (0.007–1.051) 0.642 (0.080–5.148) 1.046 (0.262–4.187) 0.533 (0.201–1.417) 0.443 (0.106–1.858) 1.001 (0.417–2.404)
P 0.055 0.677 0.949 0.207 0.266 0.997
Initial lactate, mmol/L OR (95% CI) 0.788 (0.529–1.176) 1.313 (1.050–1.643) 0.948 (0.768–1.170) 1.087 (0.929–1.272) 1.051 (0.868–1.273) 1.213 (1.027–1.432)
P 0.244 0.017 0.619 0.299 0.611 0.023
Maximal lactate, mmol/L OR (95% CI) 1.006 (0.799–1.268) 1.277 (1.037–1.573) 0.914 (0.753–1.110) 1.121 (0.961–1.307) 1.129 (0.950–1.331) 1.271 (1.074–1.504)
P 0.956 0.021 0.365 0.147 0.148 0.005
Average lactate, mmol/L OR (95% CI) 1.042 (0.712–1.378) 1.535 (1.137–2.072) 0.877 (0.671–1.146) 1.262 (0.989–1.609) 1.171 (0.924–1.483) 1.501 (1.150–1.959)
P 0.798 0.005 0.337 0.061 0.192 0.003
ICU = intensive care unit, LCR = lactate clearance rate, OR = odds ratio, CI = confidence interval.

Lactate parameter combined AIMS65 scores and AIMS65 score with prediction for outcomes

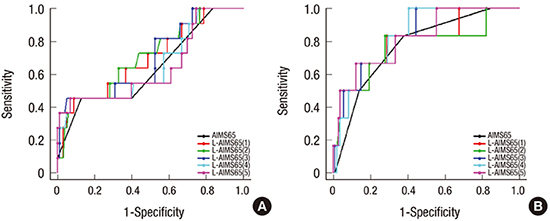
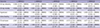
ORs of the five lactate parameters with the combined AIMS65s and AIMS65 scores for each outcome are presented in Table 5. All models were associated with 30-day rebleeding, 30-day mortality, hypotension, active bleeding, admission to ICU, and admission over 7 days (all P < 0.05). L-AIMS65(2) showed the highest area under the curve (AUC) for prediction of 30-day rebleeding, L-AIMS65(4) for 30-day mortality, L-AIMS65(5) for hypotension, L-AIMS65(1) for active bleeding, L-AIMS65(4) for admission to ICU, and L-AIMS65(5) for admission over 7 days (Table 6, Fig. 2). However, differences of AUC between L-AIMS65s and AIMS65 did not reach statistical significance in each outcome (all P > 0.05 by Hanley & McNeil test). Scoring each L-AIMS65 is shown in Table 7. Cut-off values of models that maximized the sum of the sensitivity and specificity for each outcome are presented in Table 8.
Table 5

Outcomes of L-AIMS65s and AIMS65 score

jkms-32-1820-i005
Combined parameters 30-day rebleeding 30-day mortality Hypotension Active bleeding ICU admission Admission over 7 days
L-AIMS65(1) OR (95% CI) 1.768 (1.126–2.775) 2.637 (1.184–5.875) 2.454 (1.326–4.542) 1.751 (1.193–2.570) 2.074 (1.211–3.552) 2.141 (1.363–3.364)
P 0.013 0.018 0.004 0.004 0.008 0.001
L-AIMS65(2) OR (95% CI) 1.807 (1.092–2.989) 2.858 (1.151–7.097) 2.425 (1.321–4.453) 1.839 (1.215–2.784) 2.137 (1.237–3.691) 2.154 (1.366–3.397)
P 0.021 0.024 0.004 0.004 0.007 0.001
L-AIMS65(3) OR (95% CI) 2.275 (1.217–4.251) 2.330 (1.295–4.190) 2.231 (1.271–3.916) 1.712 (1.144–2.563) 2.148 (1.212–3.804) 2.026 (1.368–3.001)
P 0.01 0.005 0.005 0.009 0.009 < 0.001
L-AIMS65(4) OR (95% CI) 2.186 (1.066–4.481) 2.190 (1.229–3.901) 2.597 (1.416–4.764) 1.677 (1.142–2.462) 2.022 (1.207–3.386) 1.953 (1.351–2.823)
P 0.033 0.008 0.002 0.008 0.008 < 0.001
L-AIMS65(5) OR (95% CI) 2.122 (1.048–4.299) 1.936 (1.256–2.985) 2.652 (1.448–4.858) 1.642 (1.156–2.332) 2.047 (1.207–3.474) 1.946 (1.363–2.779)
P 0.037 0.003 0.002 0.006 0.008 < 0.001
AIMS65 OR (95% CI) 2.003 (1.035–3.877) 2.885 (1.139–7.308) 2.160 (1.236–3.774) 1.748 (1.143–2.674) 2.127 (1.210–3.740) 2.146 (1.365–3.373)
P 0.039 0.025 0.007 0.01 0.009 < 0.001
L-AIMS65s = lactate parameters combined AIMS65 scores, ICU = intensive care unit, LCR = lactate clearance rate, L-AIMS65(1) = combination of LCR (%/hr) with AIMS65, L-AIMS65(2) = combination of LCR (mmol/L/hr) with AIMS65, L-AIMS65(3) = combination of initial lactate level (mmol/L) with AIMS65, L-AIMS65(4) = combination of maximal lactate level (mmol/L) with AIMS65, L-AIMS65(5) = combination of average lactate level (mmol/L) with AIMS65, OR = odds ratio, CI = confidence interval.
Table 6

Comparison between L-AIMS65s and AIMS65 score in the each outcome

jkms-32-1820-i006
Combined parameters 30-day rebleeding 30-day mortality Hypotension Active bleeding ICU admission Admission over 7 days
L-AIMS65(1) 0.717 (0.560–0.874) 0.789 (0.586–0.967) 0.726 (0.589–0.844) 0.682 (0.574–0.776) 0.700 (0.572–0.824) 0.698 (0.598–0.790)
L-AIMS65(2) 0.728 (0.569–0.886) 0.796 (0.607–0.963) 0.723 (0.592–0.844) 0.671 (0.566–0.768) 0.697 (0.565–0.825) 0.695 (0.592–0.792)
L-AIMS65(3) 0.705 (0.531–0.874) 0.836 (0.662–0.991) 0.718 (0.591–0.829) 0.643 (0.553–0.738) 0.720 (0.602–0.844) 0.701 (0.600–0.799)
L-AIMS65(4) 0.682 (0.513–0.860) 0.837 (0.635–0.982) 0.734 (0.609–0.844) 0.647 (0.555–0.744) 0.722 (0.604–0.844) 0.717 (0.618–0.814)
L-AIMS65(5) 0.669 (0.505–0.850) 0.832 (0.605–0.991) 0.742 (0.618–0.853) 0.657 (0.560–0.749) 0.720 (0.600–0.841) 0.726 (0.625–0.824)
AIMS65 0.649 (0.507–0.810) 0.773 (0.577–0.929) 0.699 (0.582–0.810) 0.632 (0.545–0.722) 0.693 (0.577–0.802) 0.684 (0.589–0.776)
Data are shown as AUC (2.5th percentile–97.5th percentile). All P values comparing AIMS65 with L-AIMS65s > 0.05 by Hanley & McNeil test.
L-AIMS65s = lactate parameters combined AIMS65 scores, ICU = intensive care unit, LCR = lactate clearance rate, L-AIMS65(1) = combination of LCR (%/hr) with AIMS65, L-AIMS65(2) = combination of LCR (mmol/L/hr) with AIMS65, L-AIMS65(3) = combination of initial lactate level (mmol/L) with AIMS65, L-AIMS65(4) = combination of maximal lactate level (mmol/L) with AIMS65, L-AIMS65(5) = combination of average lactate level (mmol/L) with AIMS65.
Fig. 2
ROC curves of L-AIMS65s and AIMS65 score for clinical outcomes of patients with NVUGIB. (A) Thirty-day rebleeding. (B) Thirty-day mortality. (C) Hypotension. (D) Active bleeding. (E) Admission to ICU. (F) Admission over 7 days.
ROC = receiver operating characteristic, L-AIMS65s = lactate parameters combined AIMS65 scores, NVUGIB = nonvariceal upper gastrointestinal bleeding, ICU = intensive care unit.
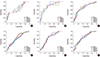
jkms-32-1820-g002
Table 7

Scoring of L-AIMS65s for each clinical outcome

jkms-32-1820-i007
Outcomes L-AIMS65(1) L-AIMS65(2) L-AIMS65(3) L-AIMS65(4) L-AIMS65(5)
30-day rebleeding −3.095 + (0.570 × AIMS65) − (0.055 × A) −3.044 + (0.592 × AIMS65) − (2.036 × B) −2.751 + (0.822 × AIMS65) − (0.286 × C) −3.269 + (0.782 × AIMS65) − (0.076 × D) −3.287 + (0.752 × AIMS65) − (0.075 × E)
30-day mortality −4.630 + (0.970 × AIMS65) − (0.025 × A) −4.807 + (1.050 × AIMS65) − (0.155 × B) −5.299 + (0.846 × AIMS65) + (0.197 × C) −4.978 + (0.784 × AIMS65) + (0.145 × D) −5.232 + (0.661 × AIMS65) + (0.320 × E)
Hypotension −1.583 + (0.898 × AIMS65) + (0.039 × A) −1.580 + (0.886 × AIMS65) + (0.908 × B) −1.065 + (0.802 × AIMS65) − (0.098 × C) −0.879 + (0.955 × AIMS65) − (0.201 × D) −0.822 + (0.975 × AIMS65) − (0.290 × E)
Active bleeding −0.468 + (0.560 × AIMS65) − (0.053 × A) −0.574 + (0.609 × AIMS65) − (0.783 × B) −0.776 + (0.538 × AIMS65) + (0.049 × C) −0.842 + (0.517 × AIMS65) + (0.074 × D) −1.037 + (0.496 × AIMS65) + (0.182 × E)
ICU admission −2.901 + (0.730 × AIMS65) − (0.018 × A) −2.911 + (0.759 × AIMS65) − (0.576 × B) −2.957 + (0.764 × AIMS65) − (0.013 × C) −3.073 + (0.704 × AIMS65) +(0.044  × D) −3.071 + (0.717 × AIMS65) + (0.050 × E)
Admission over 7 days −1.797 + (0.761 × AIMS65) − (0.003 × A) −1.800 + (0.767 × AIMS65) − (0.085 × B) −2.275 + (0.706 × AIMS65) + (0.161 × C) −2.411 + (0.669 × AIMS65) + (0.205 × D) −2.662 + (0.666 × AIMS65) + (0.362 × E)
L-AIMS65s = lactate parameters combined AIMS65 scores, ICU = intensive care unit, LCR = lactate clearance rate, L-AIMS65(1) = combination of LCR (%/hr) with AIMS65, L-AIMS65(2) = combination of LCR (mmol/L/hr) with AIMS65, L-AIMS65(3) = combination of initial lactate level (mmol/L) with AIMS65, L-AIMS65(4) = combination of maximal lactate level (mmol/L) with AIMS65, L-AIMS65(5) = combination of average lactate level (mmol/L) with AIMS65, A = LCR (%/hr), B = LCR (mmol/L/hr), C = initial lactate level (mmol/L), D = maximal lactate level (mmol/L), E = average lactate level (mmol/L).
Table 8

Cut-off value, sensitivity, specificity, PPV, and NPV of models for predicting each outcome

jkms-32-1820-i008
Models Outcomes Cut-off value Sensitivity Specificity PPV NPV
L-AIMS65(1) 30-day rebleeding −1.68 0.45 0.91 0.36 0.94
30-day mortality −2.79 0.83 0.71 0.14 0.99
Hypotension −0.54 0.77 0.67 0.62 0.81
Active bleeding −0.19 0.87 0.45 0.65 0.75
ICU admission −2.01 0.76 0.64 0.27 0.94
Admission over 7 days −1.04 0.77 0.63 0.52 0.84
L-AIMS65(2) 30-day rebleeding −1.64 0.45 0.93 0.42 0.94
30-day mortality −2.72 0.83 0.72 0.14 0.99
Hypotension −0.61 0.81 0.58 0.57 0.81
Active bleeding −0.14 0.89 0.43 0.64 0.77
ICU admission −2.04 0.76 0.64 0.27 0.94
Admission over 7 days −1.03 0.77 0.61 0.51 0.84
L-AIMS65(3) 30-day rebleeding −1.25 0.45 0.95 0.50 0.94
30-day mortality −3.46 1.00 0.56 0.11 1.00
Hypotension −0.42 0.61 0.73 0.61 0.73
Active bleeding −0.17 0.93 0.30 0.61 0.80
ICU admission −2.21 0.76 0.62 0.26 0.94
Admission over 7 days −0.35 0.46 0.84 0.60 0.75
L-AIMS65(4) 30-day rebleeding −1.23 0.45 0.93 0.42 0.94
30-day mortality −3.30 1.00 0.59 0.12 1.00
Hypotension −0.63 0.84 0.53 0.55 0.83
Active bleeding −0.04 0.67 0.57 0.64 0.60
ICU admission −2.21 0.94 0.48 0.24 0.98
Admission over 7 days −0.84 0.69 0.61 0.48 0.79
L-AIMS65(5) 30-day rebleeding −1.24 0.45 0.93 0.42 0.94
30-day mortality −2.58 0.67 0.88 0.24 0.98
Hypotension −3.58 1.00 0.48 0.10 1.00
Active bleeding 0.13 0.59 0.66 0.67 0.58
ICU admission −1.89 0.76 0.65 0.28 0.94
Admission over 7 days −0.67 0.62 0.71 0.52 0.78
AIMS65 30-day rebleeding 3.00 0.45 0.87 0.28 0.94
30-day mortality 2.00 0.83 0.62 0.11 0.99
Hypotension 2.00 0.52 0.82 0.67 0.71
Active bleeding 1.00 0.93 0.25 0.59 0.76
ICU admission 2.00 0.71 0.65 0.26 0.93
Admission over 7 days 2.00 0.59 0.69 0.50 0.76
PPV = positive predictive value, NPV = negative predictive value, ICU = intensive care unit, LCR = lactate clearance rate, L-AIMS65(1) = combination of LCR (%/hr) with AIMS65, L-AIMS65(2) = combination of LCR (mmol/L/hr) with AIMS65, L-AIMS65(3) = combination of initial lactate level (mmol/L) with AIMS65, L-AIMS65(4) = combination of maximal lactate level (mmol/L) with AIMS65, L-AIMS65(5) = combination of average lactate level (mmol/L) with AIMS65.

DISCUSSION

Although lactate has a prognostic role in patients with NVUGIB, the optimal lactate level or clearance remains to be determined (11121314). Presently, higher LCR (%/hr) within 24 hours after admission was associated with lower 30-day rebleeding rate. Higher initial, maximal, and average lactate levels within 24 hours after admission were associated with higher 30-day mortality rate and a more frequent admission over 7 days. When the lactate parameters were combined with the AIMS65 score, the discriminating power of the models increased but did not reach statistical significance.
In critically ill patients with hypoperfusion and hypoxia, lactate production is increased (1516). Hyperlactatemia may develop due to volume depletion, which results in tissue hypoxemia in patients with gastrointestinal bleeding. Elevated serum lactate level can predict recurrent hypotension in stabilized patients with NVUGIB (13). Elevated initial serum lactate level is associated with mortality in patients with NVUGIB similar to severe sepsis (1417). Presently, initial, maximal, and average lactate levels were associated with 30-day mortality. As there were no significant differences of predicting power between the three lactate levels, a single initial lactate level test could be practical.
Even if the initial lactate level is not elevated, decreased lactate utilization is associated with mortality (18). Thus, lactate clearance could be also used as prognostic biomarker in patients with NVUGIB. In the present study, LCR-1 (%/hr) was associated bleeding. Lactate is known to be associated with active bleeding and mortality in patients with UGIB. A recent study reported an association of higher lactate clearance with a reduction in the risk of active bleeding during endoscopy in patients with UGIB (11). Without endoscopic treatment, active bleeding is well known to have a high rebleeding risk (19). However, endoscopic modality and timing is not associated with rebleeding (2021). Thus, rebleeding may depend on the characteristics of the patient or lesion. Lactate clearance may also predict rebleeding by reflecting the severity of bleeding patients or lesions. In the present study, LCR-1 (%/hr) was only marginally associated active bleeding (P = 0.094). In the former study, ill patients (SBP ≤ 109 mmHg or heart rate ≥ 100 beats per min) were recruited, variceal bleeding was not excluded, and endoscopy was performed within 6 hours after admission. The different inclusion criteria may be the cause of the discrepancy in the results.
The AIMS65 score is easy to calculate with laboratory values routinely tested on admission (22). The AIMS65 score assigns points for albumin level, PT, mental status, SBP, and age. Thus, L-AIMS65 could reflect risk factors other than lactate by assigning point according to AIMS65 score. Although it has a good performance in predicting outcomes in bleeding patients (789), we assumed that the prognostic power could be improved by combining lactate parameter, which reflects tissue metabolism and which is easily obtainable together with other laboratory values. L-AIMS65s had higher AUC than AIMS65 for prediction of all clinical outcomes in the present study. However, it did not reach statistical significance. Considering the possibility of type I error, the additional role of lactate parameters to AIMS65 needs to be assessed in a large population.
This study has some limitations due to its retrospective design. First, a small subset of admission patients with NVUGIB could be analyzed due to lack of serum lactate levels required. As the lactate test might be performed in rather severely ill patients, there could be some selection bias. Thus, our results need to be interpreted in this background. However, we assume that the included subjects, who could be severely ill, are suitable for analysis to develop a predictive mode for clinical outcomes including mortality. Second, the time interval between initial and subsequent lactate tests was not consistent. To minimize possible bias, we defined the time frame as being within 24 hours after admission and measured change per hour. Third, the sample size is rather small to draw a concrete conclusion.
While the results need to be validated in prospective studies including large samples, we can conclude that serum lactate parameters of LCR and lactate levels predict clinical outcomes in patients receiving endoscopic hemostasis for NVUGIB.

Notes

DISCLOSURE The authors have no potential conflicts of interest to disclose.

Author Contributions

  • Conceptualization: Lee H.

  • Formal analysis: Lee SH, Min YW, Bae J, Lee H, Min BH, Lee JH, Rhee PL, Kim JJ.

  • Writing - original draft: Lee SH, Min YW.

  • Writing - review & editing: Bae J, Lee H, Min BH, Lee JH, Rhee PL, Kim JJ.

References

1. Button LA, Roberts SE, Evans PA, Goldacre MJ, Akbari A, Dsilva R, Macey S, Williams JG. Hospitalized incidence and case fatality for upper gastrointestinal bleeding from 1999 to 2007: a record linkage study. Aliment Pharmacol Ther. 2011; 33:64–76.
2. Wu CY, Wu MS, Kuo KN, Wang CB, Chen YJ, Lin JT. Long-term peptic ulcer rebleeding risk estimation in patients undergoing haemodialysis: a 10-year nationwide cohort study. Gut. 2011; 60:1038–1042.
3. Hsu YC, Lin JT, Chen TT, Wu MS, Wu CY. Long-term risk of recurrent peptic ulcer bleeding in patients with liver cirrhosis: a 10-year nationwide cohort study. Hepatology. 2012; 56:698–705.
4. Gralnek IM, Dumonceau JM, Kuipers EJ, Lanas A, Sanders DS, Kurien M, Rotondano G, Hucl T, Dinis-Ribeiro M, Marmo R, et al. Diagnosis and management of nonvariceal upper gastrointestinal hemorrhage: European Society of Gastrointestinal Endoscopy (ESGE) Guideline. Endoscopy. 2015; 47:a1–a46.
5. Blatchford O, Murray WR, Blatchford M. A risk score to predict need for treatment for upper-gastrointestinal haemorrhage. Lancet. 2000; 356:1318–1321.
6. Rockall TA, Logan RF, Devlin HB, Northfield TC. Risk assessment after acute upper gastrointestinal haemorrhage. Gut. 1996; 38:316–321.
7. Robertson M, Majumdar A, Boyapati R, Chung W, Worland T, Terbah R, Wei J, Lontos S, Angus P, Vaughan R. Risk stratification in acute upper GI bleeding: comparison of the AIMS65 score with the Glasgow-Blatchford and Rockall scoring systems. Gastrointest Endosc. 2016; 83:1151–1160.
8. Martínez-Cara JG, Jiménez-Rosales R, Úbeda-Muñoz M, de Hierro ML, de Teresa J, Redondo-Cerezo E. Comparison of AIMS65, Glasgow-Blatchford score, and Rockall score in a European series of patients with upper gastrointestinal bleeding: performance when predicting in-hospital and delayed mortality. United European Gastroenterol J. 2016; 4:371–379.
9. Chandra S. AIMS65 score predicts short-term mortality but not the need for intervention in acute upper GI bleeding. Gastrointest Endosc. 2013; 78:381–382.
10. Andersen LW, Mackenhauer J, Roberts JC, Berg KM, Cocchi MN, Donnino MW. Etiology and therapeutic approach to elevated lactate levels. Mayo Clin Proc. 2013; 88:1127–1140.
11. Wada T, Hagiwara A, Uemura T, Yahagi N, Kimura A. Early lactate clearance for predicting active bleeding in critically ill patients with acute upper gastrointestinal bleeding: a retrospective study. Intern Emerg Med. 2016; 11:737–743.
12. El-Kersh K, Chaddha U, Sinha RS, Saad M, Guardiola J, Cavallazzi R. Predictive role of admission lactate level in critically Ill patients with acute upper gastrointestinal bleeding. J Emerg Med. 2015; 49:318–325.
13. Ko BS, Kim WY, Ryoo SM, Ahn S, Sohn CH, Seo DW, Lee YS, Lim KS, Jung HY. Predicting the occurrence of hypotension in stable patients with nonvariceal upper gastrointestinal bleeding: point-of-care lactate testing. Crit Care Med. 2015; 43:2409–2415.
14. Shah A, Chisolm-Straker M, Alexander A, Rattu M, Dikdan S, Manini AF. Prognostic use of lactate to predict inpatient mortality in acute gastrointestinal hemorrhage. Am J Emerg Med. 2014; 32:752–755.
15. Levy B, Sadoune LO, Gelot AM, Bollaert PE, Nabet P, Larcan A. Evolution of lactate/pyruvate and arterial ketone body ratios in the early course of catecholamine-treated septic shock. Crit Care Med. 2000; 28:114–119.
16. Revelly JP, Tappy L, Martinez A, Bollmann M, Cayeux MC, Berger MM, Chioléro RL. Lactate and glucose metabolism in severe sepsis and cardiogenic shock. Crit Care Med. 2005; 33:2235–2240.
17. Mikkelsen ME, Miltiades AN, Gaieski DF, Goyal M, Fuchs BD, Shah CV, Bellamy SL, Christie JD. Serum lactate is associated with mortality in severe sepsis independent of organ failure and shock. Crit Care Med. 2009; 37:1670–1677.
18. Levraut J, Ciebiera JP, Chave S, Rabary O, Jambou P, Carles M, Grimaud D. Mild hyperlactatemia in stable septic patients is due to impaired lactate clearance rather than overproduction. Am J Respir Crit Care Med. 1998; 157:1021–1026.
19. Laine L, Peterson WL. Bleeding peptic ulcer. N Engl J Med. 1994; 331:717–727.
20. Chung IK, Ham JS, Kim HS, Park SH, Lee MH, Kim SJ. Comparison of the hemostatic efficacy of the endoscopic hemoclip method with hypertonic saline-epinephrine injection and a combination of the two for the management of bleeding peptic ulcers. Gastrointest Endosc. 1999; 49:13–18.
21. Cho SH, Lee YS, Kim YJ, Sohn CH, Ahn S, Seo DW, Kim WY, Lee JH, Lim KS. Outcomes and role of urgent endoscopy in high-risk patients with acute nonvariceal gastrointestinal bleeding. Clin Gastroenterol Hepatol. Forthcoming. 2017.
22. Saltzman JR, Tabak YP, Hyett BH, Sun X, Travis AC, Johannes RS. A simple risk score accurately predicts in-hospital mortality, length of stay, and cost in acute upper GI bleeding. Gastrointest Endosc. 2011; 74:1215–1224.
TOOLS
ORCID iDs

Seung Hoon Lee
https://orcid.org/0000-0002-1582-2117

Yang Won Min
https://orcid.org/0000-0001-7471-1305

Joohwan Bae
https://orcid.org/0000-0001-6570-471X

Hyuk Lee
https://orcid.org/0000-0003-4271-7205

Byung-Hoon Min
https://orcid.org/0000-0001-8048-361X

Jun Haeng Lee
https://orcid.org/0000-0002-5272-1841

Poong-Lyul Rhee
https://orcid.org/0000-0003-0495-5296

Jae J. Kim
https://orcid.org/0000-0002-0226-1330

Similar articles