

 PDF
PDF ePub
ePub Citation
 Print
Print


INTRODUCTION
One’s usual source of care (USC) is “the particular medical professional, doctor’s office, clinic, health center, or other place where a person would usually go if sick or in need of advice about his or her health (1).” A growing body of research indicates that having a USC improves timely access to medical care, improves quality of care received, and results in improved health status (23456). Primary care can be identified as the specific set of health care functions served by a USC. Under this definition, patients are said to receive primary care when they have a USC and when this source serves four essential functions (7): first-contact care for new health problems, comprehensive care for the majority of health problems, long-term person-focused care, and care coordination across providers (8). Primary care researchers have focused on the importance of the regular doctor in primary care, finding it associated with improved access (9101112).
Although many studies have investigated the effect of having a USC on an individual’s care-seeking behavior, most do not distinguish between having a regular doctor and having a regular site. Distinctions between the two, we inferred, would contain a valuable implication especially in Korea where there was no patient enrolment in primary care. But we did not find the Korean studies in the scientific literature about it. In the United States, one study that used data from the 1987 Medical Expenditure Panel Survey (MEPS) found that persons with a regular doctor had better access to primary care than did those with a regular site but not doctor (13). Those authors also found that the comparative advantage of having a regular doctor over having a regular site was diminished when non-mainstream sites (emergency rooms [ERs], outpatient departments, and family health centers) were excluded from the analysis. Another study found that the contribution of a regular doctor to consumers’ perceptions of access was marginal when optimal primary care was provided at a site (14). Another study that used the 1996 MEPS revealed that promoting a stable physician-patient relationship can improve patients’ timely receipt of clinical prevention but that the comparative advantage of having a regular doctor over having a regular site appeared only in blood pressure and cholesterol level checkups (5).
Korea has a very weak primary care infrastructure because of the health care system characterized by private-sector dominance in health care facilities (> 90%); nearly all payments are based on fee-for-service; and there has been no consensus on the concept of primary care; this is the case even though universal health insurance has been in place since 1989 and family medicine as a specialty was officially incepted for providing primary care services in 1986 (1516). The National Health Insurance (NHI) has not promoted having a USC. In the context of these characteristics, among the 34 Organisation for Economic Co-operation and Development (OECD) member countries, in 2013, Korea showed the highest frequency of doctors’ consultations per capita per year (14.6 vs. OECD average 6.7) and the highest number of hospital beds per capita, tied with Japan (11 beds or more per 1,000 people) (17). The rate of having a USC among Korean adults was another extreme index. A study that used data from the 2001 Korean National Health and Nutrition Examination Survey reported that the percentage of adults who responded that they had a place as a USC was very low (29.9%) (18), compared with data from other industrialized countries in an international survey conducted by the Commonwealth Fund in 2007, e.g., 96% in Australia, 91% in Canada, 95% in Germany, 100% in The Netherlands, 95% in New Zealand, 97% in the United Kingdom, and 90% in the United States (19).
The percentage of those who had a physician as a USC in Korea had been unknown until 2012, when the Korea Health Panel (KHP) survey included questions regarding a usual physician. The rate was only 13.9% for a physician with a place (vs. 21.5% for a physician or a place), which was reported at a 2015 academic conference on the KHP survey (20). In this study, we attempted to focus on having a physician with a place over only a place and to identify associated sociodemographic and health status factors in health care use (hospital admissions, emergency department visits) and out-of-pocket medical costs using data from the 2012 KHP survey.
MATERIALS AND METHODS
The KHP data are collected in a national database established by a consortium of the Korea Institute for Health and Social Affairs and the National Health Insurance Services. The KHP uses a stratified multistage probability sampling design according to region and residence in order to select nationwide subjects from the 2005 Korea Census. The data were initially collected from 7,009 households and 21,283 individuals in 2008, with 5,434 households and 15,872 individuals remaining in 2012. It contains detailed information on families and individuals from a nationally representative sample of households on the following: demographic characteristics, income, savings and expenses, employment, housing, chronic conditions, use of medical services, medications, charges and sources of payments, private health insurance, pregnancy and delivery, elder care, and health behaviors and awareness.
Sample selection process
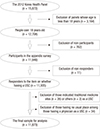
There were 15,872 participants in the 2012 KHP survey. Among these, 12,708 were 18 years or older and thus eligible to participate in the appendix survey that contained the items regarding USCs. There were 11,946 actual participants in the appendix survey (762 non-participants, 6.0%). Among the participants, 11,935 responded to the USC items (11 non-respondents, 0.09%). We excluded those who indicated sites for traditional medicine (n = 26) or other sources (n = 2) as a USC among the respondents and those who had no usual place among those having a physician as a USC (n = 34) for the homogeneity of the data. The final sample used for analysis in this study comprised 11,873 survey respondents (Fig. 1).
Sociodemographic variables
Age was categorized into four groups: 18–34, 35–49, 50–64, and 65 years or more. Education level was divided into three groups: elementary school or less, middle or high school, and college or more. Household income was divided into quintiles, with the first quintile referring to the poorest respondents. Marital status was categorized into three groups: married, divorced or separated or widowed, and unmarried. Types of health insurance were divided into three groups: employee (or workplace), self-employed (or community), and medical aid. The reason to divide those insured into the two groups was because employees were forced to get a periodic health check-up by the Occupational Safety and Health Act of Korea so that their patterns seeking medical care services could be different from those of self-employed people.
Health status variables
Chronic disease was a binary variable (having vs. not), defined as a disease or condition lasting three months or more. Subjective health was divided into three groups: good, fair, and poor. Outpatient visit was divided into quartiles by frequency during the previous one year: < 5, 5–10, 11–22, and ≥ 23.
USC questionnaire items
The KHP USC survey questions were asked for adults aged 18 years and over. Items on a place (a medical institution) as a USC were included first in 2009, and items on a physician as a USC were added in 2012. The question regarding place as a USC was “Do you have a medical institution that you usually visit when you are ill or when you are trying to get a medical check-up or consultation?” The question about having a physician as a USC was “Do you have a medical doctor who you usually see when you are ill or when you are trying to get a medical check-up or consultation?” The questions required a “yes” or “no” response.
Hospital admissions, ER visits, and medical care costs
Admissions and ER visits were binary (yes/no) questions that referred to the previous one year. Medical care costs consisted of out-of-pocket charges for ambulatory (outpatient) care, in-patient care during hospital admissions, and emergency care.
Statistical analysis
Chi-square tests were used to compare the distributions of sociodemographic and health status factors, hospital admissions, and ER visits by types of USC (i.e., no USC, only a place, and a physician with a place). Analysis of variance with the Tukey’s method for individual difference was applied to compare the means of medical care costs.
To determine the sociodemographic and health status factors associated with having a USC, we performed a multinomial logistic regression with the 3 types of USC as response levels and 9 explanatory variables: age, sex, marital status, education, household income, type of health insurance, chronic disease, subjective health, and frequency of outpatient visit. To assess the adjusted odds ratios (ORs) of hospital admissions and ER visits during the previous one year for those having a physician with a place (vs. only a place) as a USC, multiple logistic regressions were conducted that controlled for sociodemographic and health status variables. The Hosmer-Lemeshow test was applied to test the goodness of fit of the logistic regression models. It is one of the calibration measures how accurately the model’s predictions match overall observed event rates. Each model’s discriminative ability was assessed using the concordance (C) statistic, a unit-less index that denotes the probability that a randomly selected subject who experienced the event will have a higher predicted probability of having an outcome occur compared with a randomly selected subject who did not experience the event. C statistics generally range from 0.5 (random concordance) to 1 (perfect concordance) (2122). To assess the association of having a physician (vs. having only a place) with medical care costs, multiple linear regression analysis was performed, controlling for sociodemographic, and health status variables. A logarithmic transformation was applied to medical care costs in the model because a nonlinear relationship existed between the explanatory variables and a response variable.
SAS version 9.4 (SAS Institute, Cary, NC, USA) was used for statistical analysis, with P = 0.05 or less regarded as a significant difference. Sample weights were applied for all statistics except frequencies.
Ethics statement
This study was approved by the Institutional Review Board of the Catholic University of Korea with a waiver for informed consent because the data were obtained from a public database (https://www.khp.re.kr:444/, IRB approval No. KC15QISI0089).
RESULTS
Distributions of sociodemographic and health status factors and differences of medical care costs by types of USC
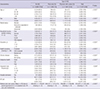
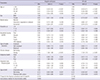
Bivariate analysis found differences in the distributions of sociodemographic and health status factors, except outpatient visit, by the 3 types of USC. The older the age group was, the lower the quintile level of household income become, the shorter the duration of education was, and the poorer the subjective health was, the higher the proportion of having a physician with a place became. Regarding having a physician with a place as a USC, people younger than 35 years old showed the lowest (3.7%) and those aged 65 years or more showed the highest (29.7%) percentages, contrasted with percentages of the same age groups (92.3% and 55.5%) in those having no USC. Proportions of having a physician with a place as a USC were higher in female (15.9%) vs. male (11.2%); married (15.6%) and divorced or separated or widowed (23.5%) vs. unmarried (3.8%); medical aid (28.4%) vs. employee and self-employed (12.5% and 14.4%) in types of health insurance; having a chronic disease (21.7%) vs. not having (3.8%); and having experienced a hospital admission or an ER visit (18.7% or 16.7%) vs. not having (13.0% or 13.4%). Medical care costs, defined as out-of-pocket payments for in- or outpatient care, ER care, or medications during the last year, differ significantly between having no USC (459,290 ± 1,139,201 won/year) vs. having any types of USC (P < 0.001), but not between having only a place as USC (844,121 ± 1,414,713 won/year) vs. having a physician with a place (799,969 ± 1,168,298 won/year) (P > 0.05) (Table 1).
Table 1
Distributions of sociodemographic and health status variables by types of USC — 2012 KHP data
Sample cross-sectional weights were applied for percentages and P values.
USC = usual source of care, KHP = Korea Health Panel, ER = emergency room, SD = standard deviation.
*Mantel-Haenszel χ2 test for trend; †Chi-square test; and ‡Analysis of variance with the Tukey’s method for individual differences: the individual difference in medical care costs between those having a place only and those having a physician with a place was statistically insignificant (P > 0.05).
Adjusted ORs of having each type of USC for sociodemographic and health status factors
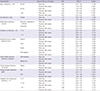
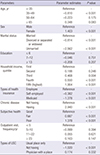
Multinomial logistic regression analysis with 3 levels of response and 9 explanatory variables resulted in that adjusted ORs of having a physician with a place (comparing to having no USC) were 1.74 (95% confidence interval [CI], 1.33–2.28; P < 0.001) for the 35–49 age group, 2.59 for the 50–64 age group (95% CI, 1.94–3.45; P < 0.001), and 4.05 for the ≥ 65 age group (95% CI, 2.97–5.52; P < 0.001) (vs. the < 35 age group); 1.33 (95% CI, 1.18–1.49; P < 0.001) for females (vs. males); 0.80 (95% CI, 0.67–0.95; P = 0.013) for divorced or separated or widowed, and 0.66 (95% CI, 0.50–0.87; P = 0.003) for unmarried (vs. married); 0.74 (95% CI, 0.61–0.90; P = 0.003) for the second, 0.81 (95% CI, 0.66–0.99; P = 0.039) for the third, 0.76 (95% CI, 0.62–0.93; P = 0.009) for the fourth, and 0.63 (95% CI, 0.51–0.78; P < 0.001) for the fifth (highest) (vs. the first) household income quintiles; 1.62 (95% CI, 1.24–2.11; P < 0.001) for medical aid (vs. employee) in the type of health insurance; 4.46 (95% CI, 3.78–5.26; P < 0.001) for having (vs. not having) a chronic disease; and 1.23 (95% CI, 1.05–1.46; P = 0.013) for poor (vs. good) subjective health. Adjusted ORs of having only a place (relative to having no USC) were not statistically significant for the third and the fourth and the fifth (vs. the first) quintiles of household income. Education duration, frequency of outpatient visit, and self-employed (vs. employee) health insurance were not significantly associated with having each type of USC (Table 2). Compared to having a place only, an adjusted OR of having a physician with a place was 1.24 (1.08/0.87) (95% CI, 1.03–1.50; P = 0.025, not shown in the table) for self-employed (vs. employee) in types of health insurance.
Table 2
Adjusted ORs of having each type of (vs. not having) USC for sociodemographic factors — 2012 KHP data
Adjusted ORs of hospital admissions and ER visits for those having a physician with a place (compared with those having a place only) as a USC
To know the associations of having each type of USC with having experienced hospital admissions and ER visits during the previous one year, multiple logistic regression analyses were conducted that controlled for 9 sociodemographic and health status factors as confounding variables (i.e., age, sex, marital status, education, household income, types of health insurance, chronic disease, subjective health, and frequency of outpatient visit). In these models, Hosmer-Lemeshow tests of goodness of fit resulted in P = 0.791 for having had hospital admissions and P = 0.136 for having had ER visits. Discriminative abilities of these models assessed using the concordance statistic were C = 0.690 for hospital admissions and C = 0.641 for ER visits.
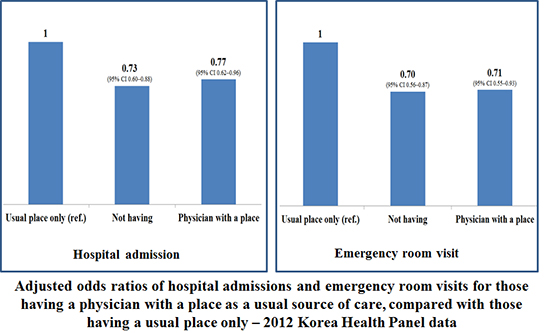
Adjusted ORs of hospital admissions and ER visits were 0.77 (95% CI, 0.62–0.96; P = 0.021) and 0.71 (95% CI, 0.55–0.93; P = 0.013) for having a physician with a place (vs. having only a place) as a USC, and 0.73 (95% CI, 0.60–0.88; P = 0.001) and 0.70 (95% CI, 0.56–0.87; P = 0.002) for not having a USC (vs. having only a place) (Table 3).
Table 3
Adjusted ORs of hospital admissions and ER visits for those having a physician with a place as a USC, compared with those having a usual place only — 2012 KHP data
Association of having a physician with a place as a USC with medical care costs
In the multiple linear regression model that used a logarithmic transformation of out-of-pocket medical costs as a dependent variable and controlled for the 9 sociodemographic and health status factors already described, comparing to having a place only as a USC, having a physician with a place as a USC had a positive relationship with medical care costs but no statistical significance, and not having a USC had a negative relationship and a statistical significance. The coefficient of determination (R-square) in this regression model was 0.277. In this model, explanatory variables showed positive relationships with medical care costs were being female (vs. male) (P < 0.001), the third (P = 0.004) and the fourth (P < 0.001) and the fifth (P < 0.001) (vs. the first) quintiles, having a chronic disease (vs. not having) (P < 0.001), being fair (P < 0.001) and poor (P < 0.001) (vs. good) in subjective health; whereas explanatory variables had negative associations with these costs were age 35–49 (vs. under 35) (P < 0.001), being unmarried (P < 0.001) and being divorced or separated or widowed (P < 0.001) (vs. married), and self-employed (P < 0.001) and medical aid (P < 0.001) (vs. employee) in types of health insurance (Table 4).
Table 4
Association of having a physician as a USC, comparing to having a usual place only, with out-of-pocket costs of medical care — 2012 KHP data
Multiple linear regression (R2 = 0.277); sample cross-sectional weights were applied to percentages. A logarithmic transformation was applied to medical care costs in the regression model because a nonlinear relationship existed between explanatory variables and a response variable. Medical care costs are out-of-pocket payments for in- and outpatient care, emergency care, and medications.
USC = usual source of care, KHP = Korea Health Panel.
DISCUSSION
As far as the authors know, this study was the first in Korea to analyze the association of having a physician with a place (vs. having only a place) as a USC with health care utilization in Korea using one of nationally representative data from the 2012 KHP survey. This study added evidence that having a physician with a place rather than having only a place would be more beneficial in hospital admissions and ER visits.
In Korea, there has been an official referral system for over two decades. In reality, however, referral letters are frequently issued at a patient’s demand rather than based on the physician’s medical decisions (23). In addition, there are a number of bypass routes to access to tertiary care hospitals; one is health screening centers, which distribute patients directly to disease specialists based on the screened health problem (24). There has been a tremendous increase in the number of these centers since 2000, when the government health screening policy expanded the target population and many people began to get periodic medical screenings at no out-of-pocket cost. Employers are obliged to have their employees screened annually (25). As a result, among those who receive health screens, there are more people who are insured through the workplace than self-employed individuals and more men than women. Doctor-patient relationships in primary care have been disrupted by these health screenings because they are driven by market mechanisms and are not coordinated by primary care physicians. This inadvertent result of the health screening policy may at least in part explain this study’s result that females (vs. males) and those who have self-employed (vs. employees) health insurance have high odds for having a usual physician.
The frequency of outpatient visit was included to adjust health status in this study, which had no statistical significance in association with having any types of USC. This result disclosed the fact that usual providers in Korea might be poor in coordination function for their patients to visit hospital outpatient departments timely and adequately. The 2015 academic conference on the KHP survey, mentioned above, reported only 34.5% answered positively regarding the coordination of care they experienced from their usual physicians in the 2012 KHP (20). It was contrasted explicitly with data from other industrialized countries. According to the Commonwealth Fund 2007 International Health Policy Survey, the proportions of those reported receiving coordinated care always or often were 70% in Australia, 69% in the United States, 67% in Canada and Germany, 60% in New Zealand, 58% in the United Kingdom, and 55% in the Netherlands (19).
This study revealed that having a physician with a place (vs. only a place) as a USC was associated with fewer hospital admissions and ER visits after controlling for sociodemographic and health status factors. That is, having a physician is more beneficial in using health care in Korea than is having a place as a USC. Lack of a physician as a USC not only interrupts continuity of care but also imposes a significant barrier to receiving medical treatment, which can result in negative health outcomes. In the United States, an analysis of paid claims to the Delaware Medicaid program during a 2-year period showed that after controlling for demographics, number of ambulatory visits, and case mix, higher provider continuity was associated with a lower likelihood of hospitalization for any condition (OR = 0.56; 95% CI, 0.46–0.69) (26). In the United Kingdom, greater continuity of care with a GP was associated with lower risk of admission (27). Primary care in the United States and most countries in Asia is provided by a variety of doctors. In one population-based, cross-sectional telephone survey (2007–2008) in Hong Kong, 60.2% (n = 1,896) of respondents had a regular primary care doctor out of 3,148 subjects. Controlling for socio-demographics and health status, those who reported a family doctor as a USC had lower ORs of using ER services and being admitted to hospital than those who used other regular doctors (0.62 or 0.51) or who did not have a regular doctor (0.48 and 0.46, respectively) (28). In the United Kingdom, quality improvement in primary care with the introduction of a major national pay-for-performance scheme was associated with a decrease of 8.0% in emergency admissions for incentivized conditions compared with conditions that were not incentivized over 13 years (1998–2011) (29).
Generally, having a USC is associated with lower costs of care. Longer relationships between patients and their usual physicians are associated with lower rates of hospital admission and lower total costs of care among Medicare beneficiaries in the United States (30). In the Korean health care system, in which the proportion of those who have a USC is very low and the proportion of out-of-pocket costs in total health expenditures is very high (36.9%, the second highest in the 34 OECD member countries based on 2013 OECD Health Statistics) (17), those who have a regular physician have more health problems but also more timely (sometimes frequently under fee-for-service) access to their physicians’ ambulatory care facilities than do those who don’t have a USC, which could incur higher medical care costs, as was seen in this study.
A number of limitations should be noted. The KHP data do not differentiate primary care physicians from medical specialists, and the authors could not analyze the discrete nature of the primary care. Another limitation might relate to adjusting for health status or severity of chronic disease in the regression models, though the authors added subjective health status and frequency of outpatient visits as well as the presence of chronic disease. The third limitation was that the discriminative ability (C statistics) was relatively low (< 0.7) in the logistic regression models to analyze the associations of having a USC with hospital admissions and ER visits in this study. This might be due to limitations of the model; e.g., if there were an insufficient number of predictors or the predictors had been dichotomized for simplicity (22). The fourth limitation was the fact that this study used the cross-sectional data of the 2012 KHP, which allowed only for showing associations, not the causal relationships, of having a physician plus place (rather than only a place) as a USC with health care use and its costs. If the items related to a place and a physician as a USC are included repeatedly in the future KHP surveys, panel data analysis can be used to prove causal relationships with health care use and its associated costs.
In conclusion, among those who had a USC in the Korean health care system, having a physician with a place (compared with having only a place) as a USC was associated with fewer hospital admissions and ER visits though was not different in medical care costs. Policies that promote having a physician as a USC may reduce avoidable hospital admissions and ER visits and would be better for the Korean health care system.
 XML Download