

 PDF
PDF Citation
 Print
Print


INTRODUCTION
Measuring the burden of disease allows for the rational allocation of limited health care resources (1). An indicator of the burden of disease, disability-adjusted life years (DALY), is a combination of years of life lost (YLL) and years lived with disability (YLD) (2). According to the Global burden of disease (GBD) group, the proportion of DALYs for communicable diseases decreased in Korea from 1990 (9.29%) to 2010 (6.48%). Globally, the proportion of DALYs for communicable disease also decreased from 1990 (46.9%) to 2010 (33.5%) (3). Experts have predicted that the DALYs of communicable disease will decrease globally to 20% in 2030. But the volume of DALYs due to communicable diseases will decrease in developing countries, the volume in high-income countries will remain similar to the present level (4). A 2010 GBD study reported that the proportion of DALYs from communicable diseases in developing countries decreased from 53.7% in 1990 to 38.7% in 2010; however, in high-income regions the reduction was much less, from 7.4% in 1990 to 5.7% in 2010 (3). The communicable disease would be still substantial burden in the future.
In fact, in New Zealand, researchers found that communicable disease was the major cause of hospital admission, and socioeconomic inequalities affected the incidence of communicable disease. This indicates that people with lower socioeconomic status had a higher incidence of communicable diseases than people with higher socioeconomic status. Therefore, they suggested that communicable diseases were a major public health problem in high-income countries like New Zealand (5). Lim et al. (6) also proposed that socioeconomic inequality could affect the increasing incidence of communicable diseases in other developed countries. Thus, these results show that the control of communicable disease poses a new challenge in developed countries, including Korea.
The substantial burden of communicable diseases requires a reconsideration of policy that acknowledges socioeconomic differences in Korea. Communicable diseases still represent a substantial proportion of the burden of disease in Korea. In 2012, among roughly 45,765,000 people, an estimated 10,672,000 people visited the hospital due to communicable diseases (ICD code; A00–B99) (7). Besides, 7,106 deaths were attributed to communicable diseases (8). In addition, some communicable diseases influence the incidence of non-communicable diseases, and the prevalence of some types of these communicable diseases is higher in Korea. For example, in individuals over 10 years old, the prevalence of hepatitis B, a risk factor for liver cancer, was 3.2%, and in individuals over 30 years old the prevalence was 4.0%, significantly higher than that of other countries such as the USA (0.4%) (9). Furthermore, some chronic communicable diseases such as tuberculosis and HIV/AIDS remain a threat to Koreans. The incidence of tuberculosis was 96 per 100,000 in 2012, the highest among the Organization for Economic Co-operation and Development (OECD) countries (10). Finally, emerging infectious diseases, such as severe acute respiratory syndrome (SARS) in 2002-2003, H1N1 influenza in 2009, and Middle East respiratory syndrome (MERS) in 2015, have also threatened public health in Korea. In this respect, despite a decrease in the communicable disease DALYs, communicable diseases continue to affect public health.
Nevertheless, with the increase in chronic diseases, most current health policies and financial resources have focused on the management of non-communicable diseases. Therefore, a consideration of communicable diseases and the development of an intervention strategy are required to address communicable diseases in Korea at the present time. An accurate measurement of the burden of communicable diseases is of primary importance for the development of an effective intervention strategy. However, a measure of the burden of communicable disease in Korea is lacking. Yoon et al. (11) estimated DALYs of some diseases in 2000, but that study did not consider all of the communicable diseases. Also, Yoon et al. (12) estimated DALYs in 2007, but they excluded communicable diseases from their study. Therefore, to address these deficiencies, we used representative health statistics and health insurance data from 2012 to estimate DALYs and to evaluate the burden of communicable diseases in Korea.
MATERIALS AND METHODS
We calculated the DALYs of communicable diseases using an incidence-based approach. The detailed method of DALY estimation is described elsewhere (13). Each communicable disease was defined using the Korea burden of disease (KBoD) classification based on the 2010 GBD study, which was based on the Korean Standard Classification of Diseases-6 (KCD-6). The DALY was the sum of YLL and YLD; the method used for this calculation is defined elsewhere (1314). The parameters used for measuring YLL were cause of death and mortality, and we primarily used cause-of-death statistical data from the Statistic Korea (8). Furthermore, the KBoD research team developed the Korean garbage code algorithm, which we applied to cause-of-death data (14).
The major parameters for measuring YLD were incidence, age at onset, duration, and disability weight (DW) of each disease. First, to calculate the incidence rate, we used national claims data from the National Health Insurance Service (NHIS). We defined cases by the number of medical utilizations. Second, to estimate duration and age at onset of disease, we used the Dismod-II program, which computed the duration and age at onset automatically when inputting the epidemiology index, such as incidence rate, prevalence rate, mortality rate, or fatality rate into the program. However, for some communicable diseases considered of short duration (< 60 days), we instead applied a duration calculated by a national health insurance statistical yearbook as per the expert opinions (7). For example, in the case of influenza, we applied 7.3 days as the duration period based on the national health insurance statistical yearbook. Finally, we applied the DW developed by Ock et al. (15).
RESULTS
The total DALYs of communicable diseases were 445 per 100,000 in 2012. Overall, 29.0% of DALYs were from YLLs (129 per 100,000) and 71.0% of DALYs were from YLDs (316 per 100,000). The total DALYs in men were 468 per 100,000 and in women were 422 per 100,000. The proportion of YLLs in men was 34.2%, which was higher than that seen in women (23.5%) (Table 1).
Table 1
Sex- and age-specific YLLs, YLDs, and DALYs
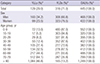
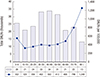
The 40-49 years old age group had the highest number of DALYs and the ≥ 80 years old age group had the lowest number of DALYs. On the other hand, the ≥ 80 years old age group had the highest proportion of DALYs per 100,000 at 1,249 DALYs per 100,000, followed by the 70-79 years old age group at 799 DALYs per 100,000, the 0-9 years old age group at 552 DALYs per 100,000, and the 60-69 years old age group at 488 DALYs per 100,000. The proportion of YLLs and YLDs in DALYs varied by age group. With increasing age, the proportion of YLLs increased for all groups except for the 0-9 years old age group (Table 1, Fig. 1).
Fig. 1
Total DALYs and DALYs per 100,000 individuals for communicable diseases according to age groups.
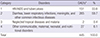
We classified communicable diseases into 4 categories according to GBD 2010 study (2): (i) HIV/AIDS and tuberculosis, (ii) diarrhea, lower respiratory infections, meningitis, and other common infectious diseases, (iii) neglected tropical diseases and malaria, and (iv) other communicable disorders. The largest proportion of DALYs was for diarrhea, lower respiratory infections, meningitis, and other common infectious diseases, comprising 59.7% of the total DALYs, followed by HIV/AIDS and tuberculosis at 33.8%, other communicable disorders at 6.1%, and neglected tropical diseases and malaria at 0.4% (Table 2).
Table 2
DALYs of communicable diseases by four disease categories
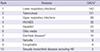
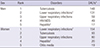
In 2012, lower respiratory infections were responsible for the highest proportion of DALYs at 143 DALYs per 100,000, followed by tuberculosis at 121 DALYs per 100,000, upper respiratory infections at 69 DALYs per 100,000, HIV/AIDS at 30 DALYs per 100,000, and hepatitis at 22 DALYs per 100,000. The top five communicable diseases accounted for approximately 86% of the total DALYs (Table 3).
Table 3
Leading causes of DALYs for communicable diseases
Tuberculosis was responsible for the highest proportion of DALYs in men (148 DALYs per 100,000), followed by lower respiratory infections, upper respiratory infections, HIV/AIDS, and hepatitis. In women, lower respiratory infections were responsible for the highest proportion of DALYs (154 DALYs per 100,000) followed by tuberculosis, upper respiratory infections, hepatitis, and otitis media (Table 4).
Table 4
Leading causes of DALYs for communicable disease by sex
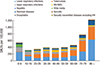
Lower respiratory infections were responsible for the highest proportion of DALYs in the 0-19 years old age group, the 30-39 years old age group, and the over 80 years old age group. On the other hand, tuberculosis was responsible for the highest proportion of DALYs in the other age groups. HIV/AIDS ranked fourth in all age groups between the ages of 20-69 years old. Otitis media was the third leading cause of DALYs in the 0-9 years old age group and the fourth leading cause of DALYs in the 10-19 years old age group (Fig. 2). In addition, as age increased, DALYs per 100,000 for otitis media decreased. The DALYs per 100,000 for upper respiratory infections also decreased as age increased. In the case of diarrheal disease, the DALYs per 100,000 increased rapidly in the over 70 years old age group (Fig. 3).
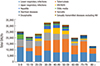
Fig. 3
Causes of total DALYs per 100,000 individuals for communicable diseases according to age groups.
The disease with the highest YLLs was tuberculosis at 43 per 100,000, followed by lower respiratory infections, HIV/AIDS, diarrheal disease and meningitis. On the other hand, the disease with the highest YLDs was lower respiratory infections at 104 per 100,000 followed by tuberculosis, upper respiratory infections, hepatitis, and otitis media (Table 5).
Table 5
Rankings of YLLs and YLDs for communicable diseases

DISCUSSION
This study was the first national DALY study of all communicable diseases in Korea. The total DALYs from communicable diseases were 445 per 100,000 in 2012, which consisted of 29.0% YLLs and 71.0% YLDs. The total DALYs in men were greater than that seen in women. The largest volume of total DALYs was in the 40-49 years old age group and the lowest was in the ≥ 80 years old age group. However, the ≥ 80 years old age group had the highest DALYs per 100,000, followed by the 70-79 and 0-9 years old age groups. These results indicate that children and elderly people are particularly sensitive to, and at high risk for, communicable diseases. This is consistent with the findings of previous studies in other countries, such as New Zealand, where the communicable disease-related hospitalization rate for patients under 5 years of age was five times greater than that for patients in the 15-29 years old age group; in addition, the communicable disease-related hospitalization rate per 100,000 was highest in the ≥ 70 years old age group (5). In other words, children and elderly people known as vulnerable group were concentrated for communicable disease in high income region. Therefore, we need to additional study for DALY in socioeconomic perspective.
In the four categories of communicable diseases, the largest proportion of DALYs occurred for diarrhea, comprising approximately half of the total DALYs. Fewer DALYs were due to lower respiratory infections, meningitis, and other common infectious diseases, followed by HIV/AIDS and tuberculosis, other communicable disorders, and neglected tropical diseases and malaria. The ranking of the four categories was similar to that seen in the 2010 GBD study in Korea (3).
In case of YLLs and YLDs, 29% of DALYs were from YLLs and 71% were from YLDs. The proportion of YLLs and YLDs due to communicable disease differed from that seen with non-communicable disease and injury. In the case of injury, 38.2% of DALYs were from YLLs and 61.8% were from YLDs. The proportion of YLLs in DALYs was higher with injuries than that seen with communicable diseases. On the other hand, 9.2% of DALYs were from YLLs and 90.8% were from YLDs in non-communicable diseases, with the proportion of YLDs being larger than that seen in communicable diseases (13). These results demonstrate that most of the burden of communicable diseases is due to disability rather than premature death. When compared with non-communicable disease, however, the importance of premature death is higher in communicable disease. Therefore, a strategy focusing on minimizing YLL warrants attention.
In addition, we sub-classified several diseases because of their importance in Korea including herpes genitalia, intestinal infection, and Korean nationally notifiable infectious diseases such as leptospirosis and Tsutsugamushi fever (16). The total DALYs for these diseases was 1,592 (3.13 DALYs per 100,000). Herpes genitalia ranked seventeenth, intestinal infection ranked twenty-second, and Tsutsugamushi fever ranked twenty-third among all the communicable disease DALYs.
In 2012, lower respiratory infections were responsible for the highest communicable disease DALY at 143 DALYs per 100,000 followed by tuberculosis in our study. While lower respiratory infections had the highest DALYs in the 0-19 years old age groups, the 30-39 year old age group, and the ≥ 80 years old age group, in the other age groups tuberculosis had the highest DALYs. Our findings were consistent with the findings of the 2010 and 2013 GBD studies (3).
Because we used data based on claims data, the DALYs of respiratory infections, such as lower respiratory infections including influenza, pneumonia, acute bronchitis, and upper respiratory infections, was high. In addition, upper respiratory infections had the highest total prevalence for all-cause disease in 2012, followed by lower respiratory infections, low back pain, and diabetes mellitus according to claims data (17).
Among diseases, tuberculosis had the second highest DALYs in 2012. In this study, DALYs for tuberculosis in men were 1.6 times higher than that seen in women. While the volume of total DALYs was largest in the 50-59 years old age group, the DALYs per 100,000 were highest in the ≥ 80 years old age group. The mortality and incidence rates of tuberculosis in Korea per 100,000 were the highest among the OECD countries in 2012 and significantly higher than that of the next closest country, Portugal (10). In particular, the YLLs for tuberculosis were the highest and accounted for 33.7% of communicable disease YLLs in Korea. Because mortality due to tuberculosis is considered an avoidable death, appropriate health policy intervention and high quality health care, such as primary diagnostic test for HIV patients and management of drug supplies and timely treatment, could prevent many tuberculosis related deaths (1819). Therefore, a strategy to minimize deaths due to tuberculosis should be undertaken to minimize the burden of tuberculosis. For example, adoption of the WHO Directly Observed Treatment Short-course (DOTS) therapy, a 6 month antituberculosis drug treatment program, would be a cost-effective intervention. For example, the DOTS program had a tuberculosis treatment rate of 86% globally in 2013 (20).
HIV/AIDS was the fourth most common disease responsible for DALYs in Korea in 2012. The DALYs for HIV/AIDS in men were 4.3 times higher than that seen in women. In the DALYs for HIV/AIDS, the 40-49 years old age group represented the largest population in both men and women. While 69.1% of the total DALYs were in the 20-49 years old age groups in men, for women, 69.2% of the total DALYs were in the 40-69 years old age groups. The highest DALYs per 100,000 in men were seen in the 40-49 years old age group at 85 DALYs per 100,000. In women, the 70-79 years old age group was the highest at 25 DALYs per 100,000. In comparison, in the GBD 2010 study HIV/AIDS DALYs per 100,000 were highest in the 35-39 years old age group, and in men the 40-44 years old age group was highest, while the 30-34 years old age group was highest in women (3). Though age distribution presented small differences, HIV/AIDS remains a significant disease and it is important to reduce the burden of HIV/AIDS in Korea as well as in the World.
This study has some limitations. Because we did not consider diseases caused by HPV, HBV, or Helicobacter species, the total DALYs of communicable disease may have been underestimated. Another category not considered was non-communicable diseases caused by infections such as HPV-related disease or HBV-related disease. Considering these diseases, the burden of communicable disease might be greater than in the present estimate. In other words, appropriate interventions for infection such as HPV or HBV, could reduce non-communicable diseases as well as communicable diseases. Additionally, although many previous studies have used national claims data, the accuracy of these data are questionable because they are obtained from insurance claims. Also, we didn’t consider the socioeconomic variables due to limitation of data. Considering the result of this study, the DALYs per 100,000 were concentrated on vulnerable group such as children and elderly people, it is necessary to measure DALYs for communicable disease considering socioeconomic inequalities.
Despite these limitations, this study estimated the DALYs of communicable disease for the first time in Korea. These findings should be used to set priorities for evidence-informed policy making to control communicable diseases. This is particularly important since emerging infectious diseases are recognized as a growing threat for public health in Korea.
 XML Download