

 PDF
PDF ePub
ePub Citation
 Print
Print


INTRODUCTION
Social engagement is regarded as a source of social integration that may be beneficial to health (1). Social engagement occurs via behavioral and/or physiological pathways (2), such as by providing a sense of purpose, and increasing motivation and social pressure to engage in behaviors that benefit, rather than harm (3).
Previous research has provided preliminary evidence that social engagement and the resulting relationships may play critical roles in the determination of health status (456). Social engagement, that is, participation in a broad range of social relationships (7), is a robust predictor of morbidity and mortality (89) in both the community (10) and higher-risk samples, such as patients with coronary heart disease (10) and those involved in accidents, compared with well-integrated people. Low levels of social support appear to influence negative health behaviors, such as smoking, heavy alcohol consumption, poor dietary habits, sedentary lifestyle, and suboptimal health service utilization (1112). Social support is quantified based on indicators of marital status, number of social relationships (network size), frequency of contact, and membership in community groups.
Although social engagement may affect mortality through biological, behavioral, and psychological pathways (13), the mechanisms that explain the link between low social engagement and increased risk of all-cause mortality are not well understood. Whether changes in social engagement affect subsequent mortality has not been established. The relationship between changes in social engagement and health has been examined primarily in terms of marital transition, particularly recent widowhood, and all-cause mortality (14). Yet, the effects of social isolation cannot be easily isolated. A previous study showed that changes in social engagement were not predictive of mortality (15).
Therefore, based on this evidence, our study investigated the impact of social engagement and networks in relation to all-cause mortality in a large general population. Further, examining intra-individual patterns of change in social engagement over time, we sought to determine whether individuals who maintain high levels of social engagement or increase social engagement over time have a lower risk for mortality compared with those with low and decreasing social engagement using nationally representative panel data.
MATERIALS AND METHODS
Study sample & design
Data were collected from the Korean Longitudinal Study of Aging (KLoSA) in 2006, 2008, 2010, and 2012. This biennial survey involves a multistage, stratified sampling based on geographical area and housing type across the nation. The KLoSA was conducted to create nationally representative longitudinal data on Koreans, aged 45 years or older, by the Korea Labor Institute for this rapidly growing population.
In the first baseline survey in 2006, 10,254 individuals from 6,171 households (1.7 per household) were interviewed using the Computer-Assisted Personal Interviewing method. There were 292 individuals with cancer. In 2008, the second survey followed up with 8,688 subjects, who represented 86.6% of the original panel. In 2010, the third survey followed up with 7,920 subjects, who represented 80.3% of the original panel, and the fourth survey, in 2012, followed up with 7,486 subjects, who represented 76.2% of the original panel.
To investigate the association between social engagement and all-cause mortality among these individuals, we excluded 2,020 subjects with missing information and finally included 8,234 study subjects at baseline.
Independent variables
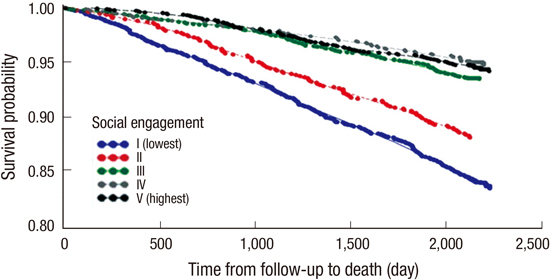
Social engagement, our independent variable of interest, was measured using five variables. Briefly, 1) frequency of contacts of friends (4: every day, 3: once a month–two or three per week, 2: once a year–five or six a year or almost nothing); 2) frequency of contacts within a mutual benevolence group meeting (4: every day, 3: once a month–two or three per week, 2: once a year–five or six a year or almost nothing); 3) frequency of attendance at leisure, culture, and sports activities (4: every day, 3: once a month–two or three per week, 2: once a year–five or six a year or almost nothing); 4) frequency of religious attendance (4: every day, 3: once a month–two or three per week, 2: once a year–five or six a year or almost nothing); and 5) frequency of contacts at an alumni meeting or hometown alumni and clan gathering (4: every day, 3: once a month–two or three per week, 2: once a year–five or six a year or almost nothing). The variables are summed, with totals ranging from 4 to 20. Social engagement was ranked from lowest (I) to highest (V), and five groups were analyzed using the SAS rank function.
Socioeconomic and demographic factors as control variables
Age group was divided into three categories: ≤ 49, 50–59, 60–69, and ≥ 70 years. Education level was categorized into four groups: elementary school or lower, middle school, high school, and college or higher. Marital status was divided into two groups: single and married. Single included separation and separation by death or divorce. Income and employment status were divided into two categories: yes or no.
Health status and behavior factors as control variables
Smoking status was categorized into three groups: current smoker, former smoker, and never smoker. Alcohol use was also divided into three groups: current drinker, former drinker, and never drinker. Self-rated health status was categorized into three groups: good, moderate, and bad. Depression was categorized into two groups: yes or no. In addition, the number of chronic diseases was also included as a covariate in our analyses.
Dependent variables
Death (all-cause mortality) over a maximum follow-up period of 6 years was determined by death certificate and a coroner’s report.
Analytical approach and statistics
We used χ2 test and Cox proportional hazards models to investigate the association between social engagement and all-cause mortality. Further, this study used growth mixture modeling to estimate trajectory classes of social engagement over time. Growth mixture model provides a method by which we can develop a probable representation of unobserved group classification and group differences – based on observed information and user specified constraints. Once the social engagement trajectory classes were derived from the growth mixture models for identifying homogeneous subpopulations within the larger heterogeneous population and for describing longitudinal change within each unobserved sub-population and examining differences in change among unobserved sub-populations, the classes were then coded into a series of dummy variables to examine the relationship between the patterns of social engagement over time and mortality using Cox proportional hazards models, which are semiparametric models that do not assume a specific hazard function. For all analyses, the two-tailed criterion for statistical significance was P ≤ 0.05. All analyses were conducted using the SAS statistical software package, version 9.2 (SAS Institute Inc., Cary, NC, USA).
Ethics statement
Korean Longitudinal Study of Aging (KLoSA) data are available in a national public database (website: http://www.kli.re.kr/klosa/en/about/introduce.jsp) and thus, ethical approval to conduct the study is not needed.
RESULTS
Prevalence of all-cause morality
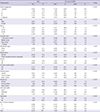
Table 1 displays the descriptive statistics of all variables at baseline. Of the 8,234 research subjects included in our study, the prevalence of all-cause mortality was 9.2% (754 participants). In terms of social engagement, 16.2% of all-cause mortality had the lowest and 5.6% of all-cause mortality had the highest level.
Table 1
General characteristics of subjects included for analysis at baseline
Association between social engagement and all-cause mortality
After adjusting for age, sex, residential region, education level, marital status, income, economic activity status, smoking status, alcohol use, self-rated health, depression, and number of chronic diseases the hazard ratio of all-cause mortality for the lowest level of social engagement was 1.841-times higher (P < 0.001) compared with those with the highest level of social engagement (Table 2).
Table 2
Adjusted effects between social engagement and all-cause mortality
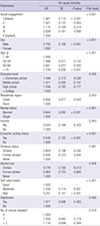
Table 3 represents the adjusted effect between social engagement and all-cause mortality according to gender. After adjusting for all confounders, the hazard ratio of all-cause mortality of males and females with the lowest level of social engagement was 1.872-higher (P < 0.001) and 1.771-higher (P = 0.001), respectively, compared with those with the highest level of social engagement.
Table 3
Adjusted effects between social engagement and all-cause mortality by gender
Trajectory class of social engagement over time
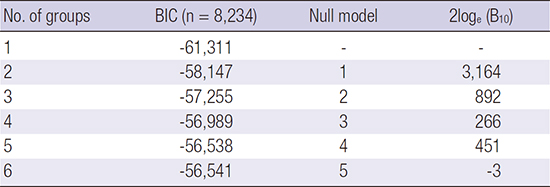
Fig. 1 displays the social engagement trajectory classes. A six-class linear solution for trajectories of social engagement fit the data best in the growth mixture models (Appendix 1). This model had smaller information criteria values (Akaike information criterion [AIC], Bayesian information criterion [BIC], and sample-size adjusted BIC) relative to other class solutions. Trajectory Class 1 (7.6% of the sample) was characterized by the lowest levels of social engagement that were constant over time. Trajectory Class 2 (7.2% of the sample) was characterized by slightly increasing levels of social engagement over time. Approximately 10.2% of the sample belonged to the Class 3 trajectory, which was characterized by significantly decreasing levels of social engagement over time. Trajectory Class 4 was characterized by gradually increasing levels of social engagement over time, with 13.5% belonging to this class. It is likely that those who are at the moment of death have deliberately an active social activity. Trajectory Class 5 was characterized by constant high-levels of social engagement over time, with 24.1% belonging to this class. Trajectory Class 6 was characterized by slightly decreasing levels of social engagement over time, with 37.4% belonging to this class (Fig. 2).
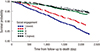

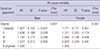
The social engagement trajectory classes were used as dummy variables in Cox proportional hazards models to examine the relationship between patterns of social engagement and mortality. In the adjusted model with the social engagement trajectory class, those belonging to Class 2 had the lowest hazard ratio (HR, 0.517, P = 0.013) of mortality out of all the social engagement trajectory classes compared to Class 5. However, those belonging to consistently Class 1 had the highest hazard ratio (HR, 4.780, P < 0.001) of mortality out of all the social engagement trajectory classes compared to Class 5 (Table 4).
Table 4
Adjusted effects between trajectory class and all-cause mortality
DISCUSSION
In this study, our primary purpose was to investigate whether social engagement was related to subsequent all-cause mortality rates and whether changes in social engagement affect subsequent all-cause mortality via growth mixture modeling using longitudinal models for nationally representative data from 2006 to 2012 in Korea.
Results of our study provide scientific insight into the specificity of social engagement and all-cause mortality in current practice. The major findings of our study are as follows: Social engagement has a substantial effect on all-cause mortality among individuals, aged 45 years or older, independent of socioeconomic variables, health status, and behavior variables. Although these effects appear stronger in males, subgroup analysis results according to gender are similar.
Further, to investigate the relationship between patterns of change in social engagement over four time points and mortality, trajectory classes reflecting intra-individual patterns of change in social engagement over time were derived via growth mixture modeling using nationally representative data. Six trajectory classes suggested that changes in social engagement may be important predictors of all-cause mortality. Membership in the constant low-level of social engagement trajectory class (Class 1) was associated with a higher risk of all-cause mortality compared with membership in the constant high-level of social engagement trajectory class (Class 5).
Although steep changes in membership in a social engagement trajectory class (Class 3 or 4) increased the risk of all-cause mortality, compared with membership in the constant high-level of social engagement trajectory class, membership in a slightly increasing social engagement trajectory class (Class 2) was associated with a reduced risk of all-cause mortality, compared with Class 5. Our results suggest that changes in social engagement can be important for all-cause mortality risk. However, protection of mortality may depend upon avoidance of constant low-levels of social engagement over time.
Traditionally, the problem of reverse causality for social engagement and mortality is not an issue when the outcome is mortality; poor health status could have a causal effect on both patterns of social engagement over time and mortality. Consequently, a pattern of constant high-levels of social engagement was a robust significant predictor of low mortality risk. This finding is especially important after adjusting for health status and health behavior variables, and provides strong evidence for the benefits of social engagement on mortality risk.
Previous work has shown that higher social engagement is linked to lower risk of mortality (161718). Participation in social and productive activities, such as organizational attendance (19), religious participation (20), participation in group leisure activities (21), more contact with friends (22), and volunteering, had salutary effects on health outcome (2324). In addition, a previous study indicated that low social engagement may be directly related to adverse health outcomes through poor biological and physiological mechanisms, such as accelerated aging (25), increased cardiovascular reactivity (26), and impaired immune function (27), including perturbed endocrine and autonomic nervous system functions (282930). Low social engagement was also shown to be associated with health risk behaviors such as increased likelihood of smoking (31), physical inactivity (32), and medication nonadherence (33).
This study contributes to the literature on social engagement and health in several ways. The life course perspective’s emphasis on stability and change in an individual’s life is encapsulated in research using trajectories as a person ages and the interdependence of lives in shared relationships (34). Social engagement is important for health (35), but these social interactions are not fixed across time and can be masked by static conceptions of social engagement connections.
However, many studies on the relationship between social engagement and mortality do not take into account the dynamic nature over whether social engagement changes over time. Even if previous studies (3637) are important steps in studying changes in social engagement over time, they typically use patterns of change in social relationships and effects on mortality at just two time points (36), limiting the ability to assess the dynamic nature of social integration over a long time (38). Therefore, it is important to incorporate long time points of measurement to precisely assess patterns of change in social relations (38). Thus, in this study, our results of trajectory class modeling are uniquely able to take into account patterns of stability and changes of social relations at four time points.
On the basis of the findings in this study, future research might focus on more sophisticated network models that assess many more dimensions of social and community ties. Of particular interest is the number of possible relationships that place an individual in a particular risk category. Thus, it is necessary to take into account the quality of the social interactions, such as a comparison of positive and negative social engagement activities that affect health. In addition, although the social engagement trajectory classes were dummy variables, for the survival analysis, they were treated as a fixed variable. However, this approach may ignore the inter-individual heterogeneity around each trajectory class of social engagement. Although it is often used as a newer predictive approach in semiparametric models, future research should provide validation or improvements to this method.
There are a number of strengths and limitations of this study. One strength is that the study obtained a large sample size, so the results can be generalized to adults aged 45 years and older within the Korean population. The use of trajectories and the life course perspective enrich this study by the incorporation of a more dynamic, longitudinal analysis. Nevertheless, this study has several limitations. One is that respondents’ reports are subjective and are potentially affected by false consciousness and adaptation of resources. Second, the social engagement indicators did not take into account the quality of the social interactions involved. Third, because the classification of each trajectory of social engagement cannot be statistically verified, it may fail to identify rare but real patterns, and thus cannot measure the precision with which individuals are classified (39). Fourth, important potential limitation is that follow-up was not complete for all participants to participate in the interviews. When we examined distribution of missing information, however, we found similar crude differences between missing information and information of participants included for analysis. This suggests minimal bias due to observed participant characteristics and outcomes, although it does not rule out biases due to unmeasured variables associated with both incomplete follow-up and participant outcomes. Finally, the primary exposure of interest was social engagement, measured with a 5-item index that included questions about frequency of contacts of friends, frequency of contacts within a mutual benevolence group meeting, frequency of attendance at leisure, culture, and sports activities, frequency of religious attendance and frequency of contacts at an alumni meeting or hometown alumni and clan gathering. Making arbitrary set of social engagement by simply summing up the relevant scores yields the lack of validity. Therefore, further study is necessary to precisely measure valid and reliable measures of social integration.
In conclusion, our results strongly suggest that low social engagement has a substantial effect on all-cause mortality rates among individuals aged 45 years or older. Six trajectory classes reflecting intra-individual patterns of change in social interactions over four time points suggest that changes in social engagement may be important predictors of all-cause mortality. Specifically, protection of mortality may depend upon avoidance of constant low-levels of social engagement over time. Future research is necessary to validate these results using a latent variable approach that reduces measurement error.
 XML Download