

 PDF
PDF ePub
ePub Citation
 Print
Print


INTRODUCTION
Temperatures are rising as greenhouse gas concentrations increase. It has been suggested that the distribution of summer temperatures in the northern hemisphere shifted to the right (i.e., increased) in 2001-2011, as compared with the normal distribution found in 1951-1980 (1). Temperature impacts human health, food supply, water resources, and ecosystems, and it is crucial that we understand the effect of temperature on mortality when estimating environmental burden on human health. Therefore, many researchers have evaluated the associations between temperature and mortality and found that a positive relation between daily mean temperature and mortality (2). Some authors have suggested that sex, age, and socioeconomic position might modify the impact of temperature on mortality (34). Vulnerable subgroups include the elderly, women, and those with a low socioeconomic status, although some reports disagree (2).
A limited number of studies have investigated changes in the relationship between temperature and mortality over time (567). Some evidence indicates a decline in heat-related mortality over time. However, few studies have considered the presence of a heat wave (defined as a daily maximum temperature exceeding the average daily maximum temperature by 5℃ for more than five consecutive days), which could have an additional effect on mortality beyond the influence of temperature alone (89). As a result, evaluations of year-to-year variations in heat-related mortality may be confused by a failure to consider the presence of heat wave. The other limitation of previous studies is that most were conducted in 20th century, and adaptation to heat has now become more at issue (10). Warming trends have accelerated in recent decades and heat extremes, as manifested by heat waves, have been increasing (1112). Therefore, it is necessary to evaluate the effect of heat waves on the relationship between temperature and mortality using more recent data.
The aim of this study was to explore temporal trends of heat-related mortality and evaluate the effect of heat waves on the relationship between temperature and mortality in urban circumstances. In addition, we compared the effects of heat waves on heat-related mortality in inland and coastal cities.
MATERIALS AND METHODS
Data
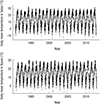
Seoul and Busan are the largest metropolitan areas in Korea, and had registered populations of 10,195,318 and 3,538,484 in 2012. Seoul is an inland city located at 37° 34’ N and 126° 58’ E, whereas Busan is a coastal city located at 35° 06’ N and 129° 02’ E (Fig. 1). These two cities are homogeneous in terms of ethnicity and age distribution and both have four district seasons.
The variables used in this analysis were temperature (ºC), humidity (%), and the day of the week from January 1991 to December 2012. The Korea Meteorological Administration established a weather database in 1991, and records hourly temperature and humidity data, which in the present study were summarized as daily mean temperature and humidity (13). Daily death counts were obtained the mortality records of the Korea National Statistical Office (14). Non-accidental deaths are defined as A00-U99 in the International Classification of Diseases revision 10 (ICD-10), and accidental deaths as V00-Y99. Non-accidental deaths, which were the subject of this study, included cardiovascular diseases and respiratory diseases, which are defined as I00-I99 and J30-J98, respectively.
Analysis
The effect of temperature on non-accidental deaths was evaluated using a generalized additive model (GAM) and a Poisson distribution. Four steps were taken to arrive at the final model. First, we compared the models which were made of four kinds of temperatures to choose the best fitting model among them. The model of daily mean temperature with humidity had the lowest Akaike’s Information Criterion (AIC) compared to those of maximum temperature with humidity, minimum temperature with humidity, and apparent temperature. Second, the lagged effect of temperature was evaluated. The models from lag 0 to 14 were compared to achieve minimal AICs for non-accidental deaths. The final model included daily mean temperature and humidity without lag. The model used was;
Where E(Y) is the expected number of non-accidental deaths; S(temperature) and S(humidity) are smoothing splines of daily mean temperature and humidity with 10 degrees of freedom (df); DOW is the day of the week as a categorical variable; S(date) is a smoothing spline of date with 6 df each year to adjust for long-term trends and seasonality. If appropriate, threshold (ξ) and risk estimates were calculated using piecewise linear regression of the following model:
In the model, (temperature - ξ)+ means the maximal value of {temperature - ξ, 0} and optimal threshold was selected to minimize AIC.
Third, we explored the temporal trend of heat-related mortality risk during the study periods. The study periods were divided into four 5-year groups (1991-1995, 1996-2000, 2001-2005) and a 7-year group (2006-2012). The effects of temperature on mortality in the two cities were compared qualitatively and quantitatively. Fourth, the study periods were divided into years with and without a heat wave. The definition of a heat wave in this research was a daily maximum temperature exceeding the average daily maximum temperature by 5℃ for more than five consecutive days, as recommended by the World Meteorological Organization (WMO) (15). The reference period for average temperature was 1961-1990 in the literature, while that of our study was the whole study period (1991-2012) as the reference period because the meteorological data in 1961-1990 was unavailable for Korea (16). Accordingly, we compared the effect of temperature on mortality between years with and without heat wave.
Statistical analysis was performed using SAS version 9.3 (SAS Inc., Cary, NC, USA) and R 2.15.0 (R Foundation for Statistical Computing, Vienna, Austria) with the ‘mgcv’ and ‘splines’ packages.
RESULTS
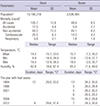
Fig. 1 shows daily mean temperature peaks and ranges in the two cities. Seoul had wider range and a higher peak daily mean temperature than Busan (Table 1). Seoul had a mean temperature from -15.7℃ to 33.0℃ during the study period, while temperatures in Busan ranged from -7.2℃ to 30.2℃. In summer, daily mean temperature range was 14.9 to 33.0 in Seoul and 16.1 to 30.2 in Busan. The mean summer temperature in Seoul was 0.77℃ higher than that in Busan. The numbers of days above the threshold temperature for heat wave were 93 and 127 during the study period in Seoul and Busan, respectively. Among them, there were 2 events of heat waves in Seoul and 6 events in Busan, which were defined as more than 5 consecutive days. For the total duration of heat waves, Busan had a longer duration (51 days) than Seoul (21 days). On contrast, the daily mean temperature during heat waves was higher in Seoul than in Busan.
Daily mean counts of all-cause death from 1991 to 2012 were 105.7 and 49.9 in Seoul and Busan, respectively. Age and sex standardized mortality in 2012 was 340 per 100,000PY in Seoul and 430 in Busan. Non-accidental deaths accounted for 88.2% and 88.3% of all deaths in the two cities during the study period and cardiovascular deaths accounted for 27.4% and 32.4% of non-accidental deaths in Seoul and Busan, respectively.
Fig. 2 showed the temporal relationship between temperature and mortality in the two cities from 1991 to 2012. Overall, the increased risk of mortality for a 1℃ increase of daily mean temperature was 9.52% above 28.2℃ and 0.35% below 28.2℃ in Seoul. Seoul had higher risk increase in mortality above the threshold than below the threshold during the study periods. The impact of temperature on mortality from 1991 to 1995 was greater than during any other period. Risk increases in mortality above the threshold were 11.0% (95%CI: 9.19-12.8), 3.82% (95%CI: 2.50-5.16), 2.06% (95%CI: 1.47-2.65), and 5.18% (95%CI: 3.81-6.54) during the periods 1991-1995, 1996-2000, 2001-2005, and 2006-2012, respectively.
Fig. 2
Temporal trends from 1991 to 2012 including or excluding years with a heat wave in Seoul and Busan.
Log RR means logarithm of relative risk of deaths attributable to 1℃ increase in daily mean temperature.
Heat wave: 1994, 2012 in Seoul, 1994, 1996, 2001, 2006, 2012 in Busan.
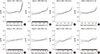
In contrast, Busan had no definite threshold. Overall, the risk increase in mortality for a 1℃ increase was 0.24% (95%CI: 0.11-0.37) in Busan, and Busan did not show a temporal trend across periods. The risk increases in mortality were 0.29% (95%CI: 0.01-0.60), 0.17% (95%CI: -0.11–0.45), 0.39% (95%CI: 0.14-0.65), and 0.15% (95%CI: -0.08–0.37) during the periods 1991-1995, 1996-2000, 2001-2005, and 2006-2012, respectively.
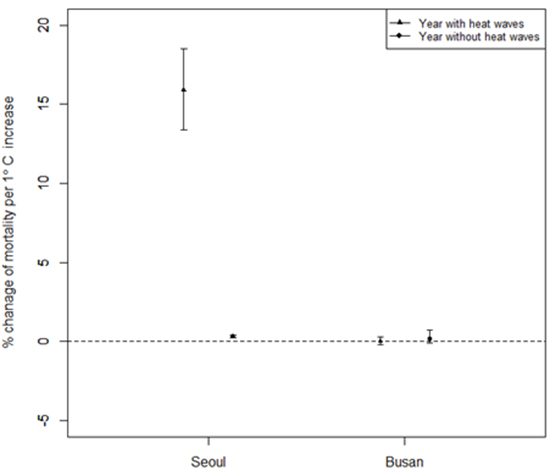
The years with a heat wave were 1994 and 2012 in Seoul and 1994, 1996, 2001, 2006, and 2012 in Busan during the study period. Fig. 3 showed relationships between temperature and mortality during years with or without a heat wave in the two cities. During years with a heat wave, the two cities showed quite different mortality responses to temperature. In Seoul, the increases risk of mortality for a 1℃ increase was 15.9% (95%CI: 13.4-18.5) above 29.2℃, and 0.27% below 29.2℃ during years with a heat wave. In contrast, in Busan, temperature had no impact on mortality during years when heat waves occurred (0.04%, 95%CI: -0.21%–0.29%). However, relationships between daily mean temperature and mortality in Seoul and Busan during years without a heat wave differed slightly. The frequency of non-accidental deaths increased by 0.18% (95%CI: -0.09%–0.71%) for a 1℃ increase in Busan, but to 0.34% (95%CI: 0.26%-0.42%) in Seoul.
Fig. 3
Comparison of temperature-mortality relationships in Seoul and Busan by heat wave status.
Heat waves in Seoul: 1994, 2012.
Heat waves in Busan: 1994, 1996, 2001, 2006, 2012.
As for cause-specific mortality, relationships between temperature and mortality from cardiovascular disease were also suggested according to the years with or without a heat wave in the two cities (Supplementary Fig. 1). The patterns of temperature-cardiovascular disease mortality relationship were similar to that of all-cause mortality. The mortality from cardiovascular disease increased rapidly during years with heat wave in Seoul, while it was not meaningful during years without heat wave. In terms of respiratory disease, the pattern was still similar and however it could show wide confidence interval because of small number of respiratory deaths (Supplementary Fig. 2).
DISCUSSION
Heat waves could modify relationships between temperature and mortality, which as the present study shows, exhibit heterogeneity between geographic locations. Temperature above the threshold had a greater effect on mortality during the years with a heat wave than that during years without in Seoul, whereas in Busan, the coastal city, a linear relationship between temperature and mortality was observed, which showed no change during the study periods regardless of the presence of a heat wave.
We were unable to find a temporal trend in the relationship between temperature and mortality in either city. The effect of temperature on mortality was greatest in 1991–1995 in Seoul, whereas no significant change was observed in Busan. In contrast, other studies have shown declines in heat-related mortality over time (56717). Recently, researchers showed that the effect of heat on mortality decreased in New York (18). They suggested that when the temperature rose from 22 to 29℃, the relative risks of mortality were 1.43 (95%CI: 1.37-1.49), 1.30 (95%CI: 1.25-1.36), 1.26 (95%CI: 1.22-1.29), and 1.09 (95%CI: 1.05-1.12) during the 1900s, 1910s, 1970s, and 2000s, respectively. Inconsistencies between our results and those of earlier studies may be due to because the temporal trends in heat-related mortality depend on the study population and area. Moreover, the study period could also explain result differences because we analyzed more recent data. Our study period was conducted on the period 1991 to 2012, while others focused on the 1900s and even the latest studies had study periods of up to 2006 (5671718). Therefore, factors like the increased use of air conditioning could have contribute to variation of temporal trend, for example, in Seoul and Busan 52% and 40% of households had air conditioning in 2004, which are much higher figures than the 0% and 14% in New York during 1949 and 1960, respectively (1819).
Heat waves could have a modifying effect on the relationship between temperature and mortality (20). In the present study, we found striking variations in the relationship between temperature and mortality during years with and without heat wave in Seoul, indicating that heat waves could contribute to the observed variations in relationships between temperature and mortality during the periods. A heat wave is characterized by a long period of abnormally hot weather, though it has been defined in different ways. Some studies have suggested that heat wave duration increases heat-related mortalities (3921). For instance, 2.0%–3.0% excess deaths per day were associated with heat wave duration in a Swedish study after adjusting for temperature (21). In addition, a 0.38% increase in the relative risk of mortality per day increase in heat wave duration was reported in the United States (US) (9). Therefore, temporal trend could be misunderstood when heat waves are not considered.
The heterogeneous impact of heat wave on the relationship between temperature and mortality in Seoul and Busan was striking. This could have been related to regional variations. Relationships between temperature and mortality showed variations between fifteen cities in Canada (22). Other studies presented indirect evidence that the effect of heat on myocardial infarction or cardiac arrest showed heterogeneity among fifty cities in the USA (23). The hypothesis proposed by some researchers is that latitude could explain observed variations in the effects of temperature on mortality (2425). However, variations in the relationship between temperature and mortality contribute little to understanding our results because no definite difference was available regarding relationships for cities during years without heat waves.
The heterogeneity of the effect of heat waves between cities could be partly due to the urban heat island effect, which essentially means that a metropolitan area is hotter than its surrounding area because of human activities and an urban environment. Higher summer temperatures in metropolitan areas are probably due to the thermal capacity and sealing surface of buildings and roadways in an urban. Moreover, waste heat generated by energy usage could also contribute to higher surface and night temperatures, and is a characteristic of the heat island effect. The US Environmental Protection Agency suggested that Heat islands could exacerbate the impact of heat waves (26). There is a few evidence heat island effects can modify the effect of temperature on mortality (272829). For example, a 1℃ increase in Hong Kong, increased the risks of mortality in areas with high or low urban heat island indices by 4.1% and 0.7%, respectively. Another study performed in Montreal reported that mortality on summer days is higher in areas with high surface temperatures (30).
Some evidence suggests that other meteorological conditions could contribute to our understanding of the heterogeneity of the modifying effect of heat waves on heat-related mortality shown by cities. Busan is located on the southeastern-most tip of the Korean Peninsula and has a typical oceanic climate with warm winters and cool summers. Therefore, different climate conditions associated with geographic characteristics might affect the impact of heat waves on mortality. In summer, Seoul has low wind speeds and high night-time temperatures which contribute to heat islands effect. Busan had 3.01 m/s of wind speed, while Seoul had 2.27 m/s in 2011. Busan had night-time temperatures 2.34℃ higher during all seasons than Seoul because of its lower latitude. However, the night-time temperature difference between Seoul and Busan is only 0.1℃ during summer. This data is in line with a previous heat island study on six Korean cities from 1973 to 2001, in which it was reported that maximum heat island intensity was greatest in Seoul and least in Busan (31). Therefore, an inland city or metropolis with a heat island effect could be vulnerable to the impact of a heat wave on mortality.
In addition to urban heat island effect, the difference in the relationship between heat wave and mortality may stem from the characteristics of heat waves in Seoul and Busan. Seoul had less frequent but higher temperature of heat waves compared to Busan. Its difference could depend on the region-specific threshold temperature of heat wave as well as regional location. Seoul is metropolis located inland and likely to have heat extremes of higher temperature, while Busan is coastal city with milder summer temperature. Therefore, Seoul seems to be vulnerable to the risk increase in mortality during heat waves. As for temporal trend, the relationship between heat wave and mortality could be changed depending on the time. The increase in mortality during heat wave in Seoul was moderated in 2006-2012 compared to 1991-1995. It might be from adaptation, the improved response to heat wave and the prevention of heat-related mortality. In practice, alarming service and emergency service with cooling devices has been used during summer season in recent years. However, more research is needed to have a conclusion because there was limited number of heat waves in Seoul to compare in this study.
In the present study, we analyzed the data from 1991 to 2012, that is, from when data was first archived in Korea to latest available data. We evaluated the modifying effect of heat waves on the relationship between temperature and mortality and explored the heterogeneities between periods and geographical areas. However, this study has some limitations. First, we could not include more cities for generalization purposes because other cities in Korea have substantially smaller populations. Second, air pollution was not adjusted for because air pollution data was not available during the study period. Nevertheless, previous studies showed that adjustment for air pollution leads to similar results (22232).
The implication of this study is that heat waves can modify the relationship between temperature and mortality, which was found to show heterogeneity between geographical areas. Hot temperature above threshold had greater effects on mortality during years with a heat wave than during years without a heat wave in Seoul (an inland city), whereas no difference was found for Busan (a coastal city). This information can allow us to evaluate the need to consider heat waves in estimate of temporal trends and suggest areas vulnerable to the live-threatening effects of heat waves.
 XML Download