

 PDF
PDF ePub
ePub Citation
 Print
Print


INTRODUCTION
Incretins are hormones that are secreted from the gastrointestinal tract in response to nutrient ingestion; the glucose-dependent insulinotropic polypeptide (GIP) and glucagon-like peptide-1 (GLP-1) are the two incretin hormones that have been identified (1, 2). The incretin hormones contribute to 50%-70% of insulin secretion in subjects with normal glucose tolerance after an oral glucose load (3), while they contribute only 10%-30% in patients with type 2 diabetes (1, 4). Incretin-based therapy to enhance the incretin effect is becoming more and more popular in the treatment of type 2 diabetes (5). To calculate the incretin effect in clinical studies, both an oral glucose tolerance test (OGTT) and a corresponding isoglycemic intravenous glucose infusion (IIGI) study are required. The latter reproduces the blood glucose profiles during an OGTT by intravenous glucose infusion (3). However, the IIGI study is quite complex and requires highly experienced researchers. Therefore, the development of a model that can calculate the incretin effect from the OGTT alone will certainly be of significant value.
Mathematical models of the glucose dynamics have been used to represent the relationship mainly between glucose and insulin (6-9). The glucose profiles during OGTTs are difficult to predict due to highly variable factors such as the rate of glucose absorption from the intestine (10) and the temporal delay of insulin action (11, 12). Furthermore, the incretin hormones have been recognized as a major insulin secretory stimulus after an oral glucose load (1, 3, 4); and several models that include the incretin concept have been developed to describe the glucose dynamics during the OGTT in a more physiologic manner (10, 13-15). Although those models have some limitations originated mainly from limited clinical data on incretin hormones, they encompass the relationships among incretin hormones, insulin, and the rate of the gastric emptying (10, 13, 15).
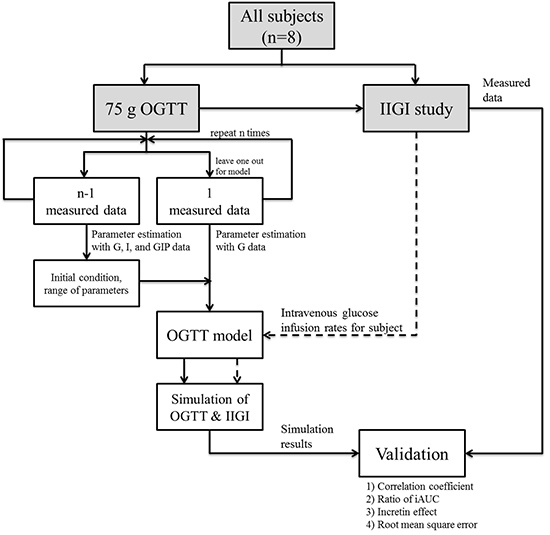
In this study, OGTT data from each subject are fitted to an individualized OGTT model and the parameters of the individualized model are estimated with the initial conditions determined by the leave-one-out cross-validation (LOOCV) method. The simulation results are validated by the correlation coefficients of glucose, insulin and incretin profiles. The ratio of the incremental area under the curves (iAUC) are also measured between the estimated data from simulation and the measured one from clinical studies. From the validation, the proposed model in this research is able to represent the physiologic changes during OGTTs and IIGI studies, which leads to the successful prediction of the incretin effect by simulated OGTTs and IIGI studies for the first time.
MATERIALS AND METHODS
Study subjects
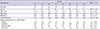
Eight healthy subjects with normal glucose tolerance participate in the study. None of them are taking medications and none are suffering from heart, liver, nor kidney disease or systemic diseases including diabetes mellitus. The characteristics of each subject are shown in Table 1.
Tests and measurement
All tests are performed in the morning after an overnight fast (>10 hr). An OGTT is performed by ingestion of 75 g glucose solution. With at least 1 week between the procedures, an IIGI study is performed in order to duplicate the plasma glucose profile during the corresponding OGTT. An intravenous catheter is placed in the antecubital vein for blood sampling. For IIGI studies, another intravenous catheter is placed in the basilar or antecubital vein in the contralateral arm for intravenous glucose infusion. To measure the plasma glucose concentration, approximately 0.5 mL of blood is drawn every 5 min during the first 2 hr and thereafter every 20 min for the last 1 hr. In addition, 9 mL of blood is taken at 0, 15, 30, 60, 90, 120, and 180 min for the measurement of plasma insulin and GIP. Plasma glucose concentrations are determined by the standard glucose oxidase method (YSI 2300 STAT plus analyzer, YSI Inc., Yellow Springs, OH, USA), and the plasma insulin concentrations are measured by a chemiluminescent immunoassay with a Siemens Centaur XP (Siemens Healthcare Diagnostics Inc., Tarrytown, NY, USA). The total GIP concentrations are measured by an enzyme-linked immunosorbent assay (Millipore, Billerica, MA, USA) based on the manufacturer's instruction.
Mathematical model and assumptions
A mathematical model of glucose dynamics encompassing the incretin concept has been proposed by Brubaker et al. (13) which has been used to simulate the responses to 50 g or 100 g oral glucose load. The model consists of three ordinary differential equations representing the changes in plasma glucose, insulin, and the incretin hormones during the OGTT and other three equations representing the absorption of glucose from the gastrointestinal (GI) tract and the glucose balance in the liver. In this study, the equations of the GI tract have been modified proportionally to 75 g glucose load and those are shown in Eq. 1 and Eq. 4.
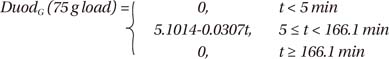

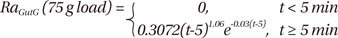

The equations describe the delivery of glucose to the duodenum (DuodG; mM/min), which in turn determines the rate of secretion of incretin hormones and the rate of the absorption of glucose into mesenteric circulation (RaGutG; mM/min), which determines the changes in blood glucose kinetics. In the IIGI study, Eq. 1, 2, 3, and 4 are set to zero.
The hepatic glucose balance (HepbalG; mM/min) reflects the sum of glucose production in the liver and glucose uptake from the mesenteric circulation described in Eq. 5.
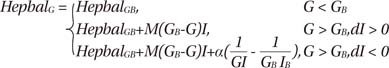
HepbalGB (mM/min) is the basal hepatic glucose balance in the fasting state (13). M (L2/mU/min) represents the effects of counter-regulatory factors on the hepatic glucose balance determined by parameter estimation in the current study, and α (mM2 mU/L2/min) represents the hepatic regulatory term for hypoinsulinemia. GB (mM/L) is the basal glucose level measured by the measured fasting plasma glucose level for each subject, and IB (mU/L) is the basal insulin level determined by the average fasting plasma insulin level of all subjects.
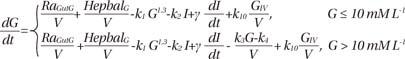
Where V (L) is twenty percent of the weight of each subject, k1 (L0.3/mM0.3/min) and k2 (mM/min/mU) represent non-insulin-mediated glucose uptake and insulin-mediated glucose uptake, respectively. Parameter γ is a shaping factor for the derivative control of insulin on glucose, k3 (L/min) and k4 (mM/min) are the slope and intercept of renal glucose clearance, respectively, and GIV (mL/min) represents the intravenous glucose infusion rate of the IIGI studies. The term GIV has been added to represent the intravenous infused glucose, a term that is used in the simulation for the IIGI study, but not for the OGTT. Parameter k10 (mM/mL) is the correction factor because the unit of the intravenous glucose infusion rate are mL/min (glucose: 180 g/M, 1.54 g/cm3), and the initial value is set to 10.
The incretin concentration (Inc; ng/L) is described in Eq. 7 on the basis of the GIP concentrations during the OGTT.
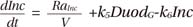
RaInc (ng/min) is the basal rate of appearance of the incretin, IncB (ng/L) is the basal incretin concentration determined by the average fasting total GIP of all study subjects and parameter k6 (min-1) is the degradation of Inc. Parameter k5 (ng/L/mM) is the rate of appearance of incretin due to DuodG, which is determined by parameter estimation in the current study. In the IIGI studies, the rate of appearance of Inc is nearly unchanged because the rate is most affected by DuodG.
The insulin concentration (I; mU/L) is described in Eq. 9 to reflect the effect of both glucose and incretin on the insulin secretion.
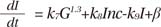
Parameters k7 (mU/min/mM1.3/L0.3) and k8 (mU/min/ng) are the rate of appearance due to glucose and incretin, respectively and those are determined by parameter estimation in this study. Parameter k9 (min-1) is the clearance rate of insulin, and β (mU/L/min) is the effect of additional regulators. In the IIGI study, the insulin secretion by incretin is simulated to be much lower than that of simulated OGTT.
The model is implemented by Matlab R2012a (Mathworks Inc., Natick, MA, USA) along with parameter estimation. The solutions to the differential equations in the model are obtained by the 'ode45' function, which is based on the 4-5th order Runge-Kutta method. The simulation for OGTT shows the responses depending on the oral route of glucose administration by Eq. 1 and Eq. 3. In contrast, the simulation for the IIGI studies shows the responses following the intravenous route of glucose administration by the term related to GIV in Eq. 6. The intravenous glucose infusion rate in the simulation is determined using the same interval as the IIGI study without any delay. The initial conditions for glucose (G), insulin (I), and incretin (Inc) for both simulations are obtained from the OGTT data.
Parameter estimation
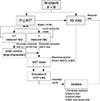
The objective of parameter estimation is to fit the profiles of measured data. Following the process described in Fig. 1, the values of the parameters of the OGTT model are estimated, and the probability distribution of each parameter based on the measured data is determined. To obtain the appropriate range of the parameters, an LOOCV method is utilized prior to estimating the parameters of the individualized model. The LOOCV method is suitable for the analysis of a small data set and it has been shown that LOOCV provides a fairly unbiased estimation of the true generalization ability of a classifier (16). In this study, the measured data from OGTT are divided into single versus remaining classes. A single observation means the OGTT data of one subject, which is used to estimate the values of the parameters of an individualized OGTT model to fit the actual OGTT data of a subject. The remaining observations mean the OGTT data of all the other subjects except one, which is used to set a probability distribution and the initial conditions of the parameter estimation for the individualized OGTT model. This process is repeated for each study subject.
The values of the parameters of the OGTT model are estimated to minimize the weighted sum of the squares of the residuals between the measured and simulated results of the OGTT (17). Depending on the objective, different types of residuals are selected. The plasma glucose (G), insulin (I), and GIP (Inc) data are used to set the probability distribution using the remaining observations, whereas only the plasma glucose (G) level is used to estimate the values of the parameter of the OGTT model.
The four parameters k5, k7, k8, and M among the fifteen parameters in the mathematical model are estimated with directly measured data. The estimation has a limit within a reasonable range with the nonzero glucose and the insulin levels and covers the parameter distribution. The initial conditions for glucose (G), insulin (I), and incretin (Inc) for parameter estimation are obtained from the OGTT data, and the initial values for the four parameters are obtained from the result of the LOOCV method.
At first, parameter k10 is set to a fixed value, but after estimating other parameters, the value of k10 is estimated to minimize the sum of squares of the differences between the measured and simulated results of glucose response during the IIGI study. The range of the value is between 6 mM/mL and 14 mM/mL.
The results of parameter estimation are obtained by the 'patternsearch' function (Matlab built-in function) which is based on the pattern search method for optimization techniques.
Validation
In this research the predicted result with simulation is validated in several ways. First, Pearson's correlation coefficient between measured and simulated data is used as a measure for the goodness of fit and the accuracy is evaluated with the ratio of the iAUC of each profile between simulated and measured results  .
.
.Second, the incretin effect is calculated from insulin secretion in the simulation result and then it is compared with the value from the measured data (1, 2). It is calculated by the difference of the iAUC between the insulin profile of an OGTT and its corresponding IIGI study by the trapezoidal rule -

Lastly, the intravenous infusion rates used during the IIGI study for each subject are applied to the corresponding OGTT model to validate the results of parameter estimation. A high correlation coefficient and a low root mean square error (RMSE) represent the most suitable results. For example, if the intravenous infusion rates used for subject #1 are applied to the eight individualized models, the IIGI simulation with parameters from the OGTT model for subject #1 should have the highest correlation coefficient and the lowest RMSE compared with the actual IIGI study data of subject #1.
RESULTS
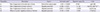
The initial conditions and the range of estimated parameters were determined to reflect the characteristics of measured data. The initial conditions and probability distribution determined by the remaining measured data described in Fig. 1 had an impact on the results of the parameter estimation. The most noticeable discrepancy in the measured data between the data in this study and the data reported by Brubaker et al. (13) was an attenuated secretion of insulin and GIP. This characteristic was reflected in the results of estimation as k5 and k7 in Table 2. Parameter k5, describing the rate of appearance of incretin hormones due to DuodG, and parameter k7, describing the rate of appearance of insulin due to G, were lower by 75% and 25%, respectively, compared with the value (13). Parameter M, which was affected by the hepatic glucose balance, and parameter k8, which described the rate of appearance of insulin due to incretin, were 30% and 16% higher compared with the value (13), respectively (Table 2).
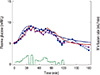
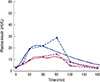
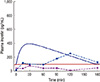
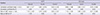
The correlation coefficient and the ratio of iAUC between the simulation result and the measured data of insulin were over 0.80 (Table 3). The correlation coefficient and the ratio of iAUC are also shown in Table 3. The mean value of correlation coefficient of incretin was smaller than those of insulin and glucose. The mean ratio of iAUC of glucose was greater than 1, while those of insulin and incretin results were less than 1. For a representative example, the profiles for the simulation results of subject #7 from the OGTT and IIGI study and the directly measured data (with symbols) are depicted in Fig. 2, 3, 4 and the correlation coefficient and the ratio of iAUC for subject #7 are shown in Table 3.
For the first simulation of the IIGI study, parameter k10 was fixed at a value of 10 for all subjects. However, the glucose excursion of each subject was varied during the IIGI study. Among the various conditions that influence the glucose homeostasis, delayed insulin response to the glucose administration was focused. The response of the intravenously infused glucose was increased by 15.44±9.64 mg/dL per 1 mL/min in average at the initial time of the IIGI study because of the time lag of insulin secretion. Despite these variations, the response to sequential intravenous glucose infusion could be predicted by using the mathematical model. For the second simulation, k10 was estimated to minimize the difference between the measured data and the simulation, reflecting the different responses to intravenous glucose administration for each subject. The estimated value of k10 (mean±S.D.) was 9.25 mM/mL±3.06 mM/mL. The range of the value was from 6 mM/mL to 13.3 mM/mL. The correlation coefficient of the glucose profiles using the estimated k10 value for the IIGI studies was higher at 0.87±0.08 than that using the fixed value. The RMSE of the glucose profiles using the estimated k10 value was reduced by 50% to 360.6 mM/L±440.3 mM/L compared with a value of 721.9 mM/L±815.0 mM/L with the fixed value.
DISCUSSION
In this study, measured data of the subjects have a difference with other reported data used OGTT model. The difference was the low secretions of insulin and GIP which might be caused by different experiment and different characteristics of study subjects (2, 4, 6, 12, 18-23). Due to the heterogeneity among human studies, the range of parameters can hardly be determined on the basis of earlier studies. So, LOOCV method described in method has been applied to estimate initial conditions of parameters in order to reflect the difference in the measured data between the current study and a report by Brubaker et al. (13). The estimated initial conditions and the range of parameters helped the OGTT model to closely fit the individual profiles.
The lower secreted insulin does not affect the 'incretin effect' in the subject. Despite the apparently lower insulin responses during OGTTs, the incretin effect calculated by both measured and simulated data was within the previously reported range, i.e., 50%-70% (1, 4, 24): the incretin effect from the simulated data was 56.5%±10.6% and that from the actual experiment was 52.5%±19.6%.
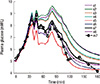
The glucose profiles generated during IIGI simulation based on the OGTT model should be examined by another validation for suitability. These validation results were shown in Fig. 5. The correlation coefficient between glucose profiles during actual IIGI and simulated IIGI for subject #7 had a highest value of 0.96 when the simulated IIGI was adapted from its own OGTT profiles. The RMSE for subject #7 was 5.13 mM/L and the values for the other subjects ranged from 4.61 mM/L to 17.78 mM/L. The value from subject #7, 5.13 mM/L, ranked the second lowest, but this was comparable to the lowest value from subject #8, 4.61 mM/L. The reason for this similarity could be explained by the fact that these two subjects had similar glucose profiles during OGTTs, fasting glucose, time of peak glucose level, and glucose response at 180 min as shown in Table 1. The other cases also had similar tendencies. Thus, the IIGI simulation based on the OGTT model could accurately predict the response to intravenous glucose administration.
The proposed model have some limitations. Firstly, the ordinary differential equations of the OGTT model represented only general single peak of glucose level during the OGTT study. In case of subject #5, unusual double glucose peak levels were represented during the OGTT, which was not reproducible with our model so that the correlation coefficient for glucose profiles from subject #5 was very low (0.40). Nevertheless, the IIGI response was well predicted with a correlation coefficient of 0.90 because the simulation reflected the glucose levels from the intravenous glucose infusion. Secondly, since a limited number of subjects were used in this study, the proposed model needs to be further validated with additional normal subjects which is being planned as a future study. Thirdly, since all the subjects in this research have normal glucose tolerance, their responses are in normal range. It is necessary to develop advanced model based on this study that may predict the incretin effect and incretin response in the different populations such as subjects with type 2 diabetes or abnormal glucose homeostasis. Fourthly, only GIP results in simulation were compared to those in clinical study even though both GIP and GLP-1 are incretin hormones which contribute to the incretin effect (25). However, it was assumed that the changes in GLP-1 are too small to influence the model because plasma levels of GLP-1 are much lower than those of GIP in humans (13). Further studies to improve the model considering both incretin hormones (i.e., GIP and GLP-1) would be necessary. Lastly, fasting glucose levels at 0 min and decreased glucose levels near 180 min were unpredictably lower or higher than the expected range of parameters. To overcome these discrepancies, most of the glucose levels in the OGTT model was adjusted. Moreover, the initial conditions in this study were obtained by either OGTT or LOOCV method and only the glucose profiles during OGTTs for parameter estimation was used, although the data for insulin and GIP were also obtained. In this research, the objective was not fitting the model to the measured data, but predicting the other profiles using the OGTT model. The predicted insulin and incretin profiles were actually similar to the measured data, though the initial conditions were unavailable prior to the modeling.
In summary, for the calculation of incretin effect from the difference in insulin secretion, the proposed model in this research has attempted to represent the different routes of glucose administration; oral vs intravenous. The parameter estimation by applying the LOOCV method was able to reflect characteristics of the measured data without complicated comparisons. Moreover, the insulin and incretin profiles were effectively predicted to be based on the glucose response depending on the route of administration of glucose. The outcomes of this research will be useful to control and predict the responses of OGTTs and IIGI studies. This is the first proposed model to predict the hormone response of IIGI study from the data of OGTT study and the model would be the first step to understanding the incretin physiology with simulation study. Furthermore, by taking advantage of the prediction of the proposed model, the accuracy of the IIGI study could be improved by predicting the intravenous glucose infusion rates to trace the glucose profile during the OGTT. As a result, in clinical practice, the proposed method could significantly reduce the burden on subjects and researchers to predict the incretin effect. As a conclusion, the current model could play a vital role in developing a better understanding of the incretin effect and the proposed method could be used in additional clinical studies for the investigation of glucose dynamics.
 XML Download