

 PDF
PDF ePub
ePub Citation
 Print
Print


INTRODUCTION
In 2004, Nademanee et al. reported that catheter ablation of atrial fibrillation (AF) targeting complex fractionated atrial electrograms (CFAE) was effective in terminating and preventing AF (1). He also declared that epicardial catheter ablation targeting complex fractionated electrogram (CFE) reduces ventricular fibrillation (VF) or sudden cardiac death in Brugada syndrome (2). Sophisticated mapping and ablation of CFAE based on CFE-cycle length (CL) or rotor is known to improve the clinical outcomes of AF catheter ablation (3), and the 2012 HRS/ERHA/ECAS Expert Consensus Statement (4) recommended performing CFAE guided ablation in addition to conventional circumferential pulmonary vein isolation in patients with long-standing persistent AF.
Previously, we also reported that the area of CFE is associated with low voltage areas, as well as slow conduction velocity, in humans (5). However, the physiological meaning of CFE and why CFE guided ablation is effective have not yet been elucidated. The main difficulties encountered in physiologic studies of CFE are as follows: 1) CFE is acquired from local bipolar electrograms, and simultaneous acquisition from multiple mapping points is not clinically available. 2) With limited resolution in clinical electroanatomical mapping techniques, it is difficult to realize parameters for quantifying fibrillation wave dynamics, such as wave-break point (WB) or phase singularity point (PS) without surgical high density mapping. Therefore, in this study, we attempted to study CFE electrograms generated by virtual bipolar electrogram via in silico simulation modeling, comparing spatiotemporal distributions of WB, PS, and local dominant frequency (LDF).
The purpose of this study was to evaluate the meaning of CFE-CL in fibrillation wave-dynamics, comparing WB, PS, and LDF spatiotemporally. We also investigated the effect of virtual ablation targeting CFE and LDF.
MATERIALS AND METHODS
2D bidomain fibrillation modeling
A 2D bidomain fibrillation model for computer simulation were implemented using Microsoft visual C++ version 10.0 (Microsoft Co., Redmond, WA, USA) and MATLAB ver. 7.13 (MathWorks Co., Natick, MA, USA). The source code of the cell model was from the CellML version and already implemented in our previous computational studies (6-8). The solution algorithm for the bidomain method was from Ashihara et al. (9). A 1,000×1,000 element cell array was used to simulate fibrillation waves based on a ten Tusscher-Panfilov model (10) which describes the intracellular ion dynamics in more detail than Priebe-Beuckelmann (11) type model, and computationally more efficient than Iyer-Mazhari-Winslow (12) model (13). A spatial discretization of 0.25 mm and a temporal discretization of 0.05 ms were used for all simulations, and data were sampled every 1 ms. A finite element formulation using the Galerkin method (14) was used for the discretization of the bidomain equations for electric wave propagation in tissue. We chose diffusion coefficients of 0.00462 cm2/s for intracellular cellular portions and 0.00154 cm2/s for extracellular portions. No electric flux condition was applied for all the boundaries of intra- and extracellular domains. For the re-entry initiation, we used the protocol of Clayton and Holden (15) which we validated previously (8). In our 2D bidomain modeling, action potential duration at 90% repolarization (APD90) was 304 ms and conduction velocity was 0.58 m/s at 600 ms pacing cycle length (CL; Fig. 1A and C).
Generation of virtual bipolar electrogram and CFE
As a bipolar electrogram is needed to generate CFE, we designed virtual bipolar catheter simulating currently utilized clinical one (Celsius, model DI7TCBLRT, Johnson and Johnson Inc. Diamond Bar, CA, USA, Fig. 1B). The sizes of the distal electrode and proximal electrode were 3.5 mm×2.0 mm and 1.5 mm×2.0 mm, respectively. The inter-electrode distance was 1.0 mm, and we oriented the distal and proximal electrodes with consistent vertical directivity (top to bottom). We averaged the whole action potentials recorded within each virtual electrode areas, and generated virtual bipolar electrograms by subtracting the amplitudes of averaged potentials from each electrode and filtering with a band-pass of 30-200 Hz (Fig. 1D). The virtual catheter device sweeps every mesh point to compute point-by-point electrogram. CFE-CL was calculated from electrogram data collected for 6 sec by measuring the time intervals between multiple and discrete deflections at the maximum negative dV/dt and averaging inter-deflection time intervals. An adaptive peak-to-peak sensitivity threshold was not considered, because the data comprised simulation data without noise. The refractory period was set to 40 ms and the duration for preventing far-field events was set at 15 ms (16).
Determination of WB, PS, and LDF
WB was defined as a point where the wave-front and wave-tail met (17) on the pseudo action potential map. Wave-fronts were detected by the maximum dV/dt in phase 0 of an action potential curve, and wave-tails were defined as points of 50% repolarization. Wave-fronts are tracked, and when the wave-front meets a wave-tail, the point is determined to be WB. Phase of action potential, θ(t), was calculated as the arctangent of Vm (t)-Vm_MEAN over Vm (t+τ)-Vm_MEAN, where Vm (t) is the voltage of cardiac action potential at t seconds and τ is the embedding delay (30 ms). PS was defined as the point where the phase was undetermined or ambiguous, and was detected by Iyer-Gray's algorithm (18). PS also includes the points where the phase is undetermined. LDF was analyzed by the power spectra density function using a Hanning window (19) and discrete Fourier transform over a 6 sec duration of virtual action potential recording for each cell, and defined as the frequency of the maximum peak power within 1-20 Hz.
Spatiotemporal correlation methods for CFE, WB, PS, and LDF
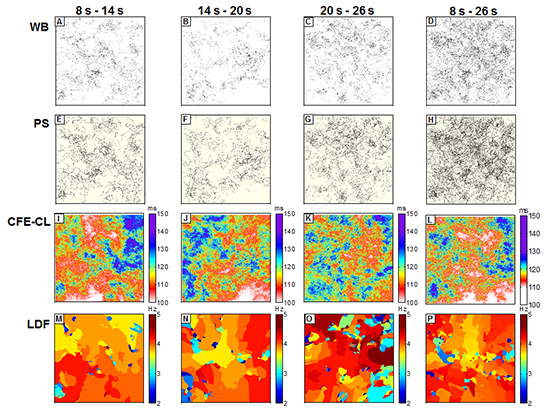
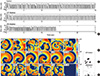
Based on the above algorithm, we generated color-coded WB, PS, LDF and CFE-CL maps using data collected during 8-14 sec, 14-20 sec, 20-26 sec, and overall 8-26 sec data of fibrillation (Fig. 2). Data collected during the first 0-8 sec were excluded due to the potential instability of wave-dynamics immediately after induction of fibrillation. For the spatial comparisons of each parameter (WB, PS, LDF, and CFE-CL), we divided each color map into 10×10 lattice zones (100×100 cells in each zone) for the same time period, and the mean values of each parameter in each lattice zone were calculated and analyzed spatially.
Overlaying PS on CFE-CL maps and virtual CFE and LDF ablations
To investigate the relationship of spatial distribution between PS and CFE, we projected PS on CFE maps (Fig. 3), and compared CFE-CL distribution at the periphery of PS sites vs non-PS sites. In consideration of a size mismatch between virtual electrodes and cells, CFE-CL at the central cell of virtual catheter was used as a representative value, and we compared standard deviations of CFE-CL from 8 cells around the cell of interest (Fig. 3D). To conduct virtual CFE and LDF ablation, both CFE-CL and LDF values at each site were sorted in ascending order, and the cells of the upper 5% of short CFE-CL and high LDF were ablated respectively, to minimize the effect of critical mass reduction. Ablation was done by setting the ionic current conductance to zero and membrane potential to the baseline (-86.2 mV).
Statistical analyses
Data are expressed as mean±standard deviation. Linear correlation was evaluated to prove the relationship among WB PS, LDF, and CFE, both spatially and temporally. The standard deviation of CFE-CL at PS sites and non-PS sites were compared quantitatively by Student's t-test. A P value of <0.05 was considered statistically significant.
RESULTS
Spatial correlation of CFE vs WB, PS, and LDF
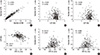
In this study, we were able to generate virtual bipolar electrograms with the algorithm described above and demonstrated CFE during fibrillation (Fig. 1D). Fig. 2 compares the spatial distributions of WB, PS, CFE-CL, and LDF, depending on the recording timing during fibrillation. For the 6 sec cumulative maps of WB and PS, their spatial distributes were very similar, but seemed to spare the area with short CFE-CL (Fig. 2I and J). At 20-26 sec, WB and PS distribution spread over the mapped area (Fig. 2C and G), and there was no significantly localized short CFE-CL area (Fig. 2K). However, a prominent high LDF area was observed, as shown in Fig. 2O. For 8-26 sec fibrillation data, areas of WB and PS were not localized, and neither were localized on the area of LDF. Although we observed sustained rotors in activation map from time to time, there was no stationary PS or WB sustaining longer than 6 sec. For statistical analyses, mean values of each parameter at 100 evenly divided lattice zones in three different serial time durations were compared and correlated. Accordingly, WB and PS exhibited very nice correlation to each other (Fig. 4A), and CFE-CL showed weak correlations with LDF, PS, and WB, respectively (Fig. 4D to F). However, LDF did not show any correlation with PS or WB (Fig. 4B and C).
PS positioned at the periphery of short CFE-CL Areas
As shown in Fig. 3, PS are positioned at the boundary of short CFE-CL areas, sparing the shortest CFE-CL area. We evaluated CFE-CLs around the cells with PS (PS area) and those without PS (non-PS area) to prove spatial relationships between CFE and PS. In statistical analysis, the standard deviation value of CFE-CL was significantly higher at cells with PS than at cells without PS, suggesting PS is more likely to be localized at areas of CFE-CL change than non-PS cells (P<0.001, Table 1). This finding was consistent temporarily (Fig. 3A to C), and PS tracked the boundary of the shortest CFE-CL area.
CFE Ablation terminated fibrillation, but LDF ablation organized fibrillation
In CFE-CL maps generated using 8-14 sec data, we plotted the upper 5% of the shortest CFE-CL cells and 5% critical mass of the highest DF area (Fig. 5). After plotting the mask area, we ablated the area of high DF (Fig. 5C) and short CFE-CL (Fig. 5D). In contrast the virtual DF ablation changed fibrillation to organized tachycardia, CFE ablation organized and finally terminated fibrillation in 14.3 sec.
DISCUSSION
In this study, we were able to realize virtual CFE and evaluate its meaning in fibrillation wave-dynamics by 2D bidomain homogeneous cardiac simulation modeling. Briefly, we observed high spatial correlation between WB and PS, and weak correlations between CFE-CL and WB, PS, or LDF. However, LDF was not shown to be correlated with WB or PS. Additionally, PS was shown to be positioned mostly at the periphery of areas with the shortest CFE-CL or CFE-CL change. Lastly, virtual ablation targeting CFE terminated fibrillation successfully.
Konings et al. (20) reported that CFAE areas were mostly observed at areas of slow wave conduction and/or at pivot points of wavelet turn-around. Afterwards, Nademanee et al. (1) suggested a clear definition of CFAE as 1) fractionated electrograms composed of two or more deflections and/or a perturbation of the baseline with continuous deflection of prolonged activation complex, and 2) atrial electrograms with a very short CL (≤120 ms). In patients with ischemic cardiomyopathy, CFEs were frequently recorded at the infarct border zone inside or outside of the ventricular tachycardia foci (21). However, it is more commonly found in patients with ischemic ventricular tachycardia than those without (22). Nademanee et al. (2) also reported that normalization of a Brugada pattern ECG in 89% after CFE-guide ablation in ventricular tachycardia/ventricular fibrillation (VT/VF) in patients with Brugada syndrome and 78% long-term suppression of ventricular tachyarrhythmias.
There are two major theories that explain the maintenance mechanism of fibrillation, the multiple wavelet hypothesis (17) and focal source hypothesis (23). The multiple wavelet theory suggests that continuous break-up of wavelets and co-existing 4-6 spiral wave cores maintain fibrillation, generating WB or PS. In contrast, the focal source hypothesis advocates that a high-frequency mother rotor generates fibrillatory conduction. Wu et al. (24) proved that both multiple wavelets and a mother rotor can exist in the same heart depending on conduction pattern, and Pak et al. (25) further emphasized the importance of the anatomical structure of this wave-dynamics pattern. In clinical practice, CFE targeted ablation exerts antiarrhythmic effects, but its meaning in fibrillation wave-dynamics has not yet been evaluated. Studies regarding CFE and wave-dynamics are limited to conduct, because of the low spatio-temporal resolution of bipolar electrograms and difficulty in excluding the effects of anatomical characteristics or anisotropy. In this study, we demonstrated a relatively weak spatial correlation between CFE and WB, PS, or LDF via a 2D homogeneous monolayer cardiac simulation model, excluding other confounding effects. Although there has been report the multicomponent continuous electrogram surrounds high DF area in human atrium (26), PS was not associated with high LDF area. Therefore, CFE might be associated with both active driver, such as mother rotor, and passive wavebreaker, such as collision of multiple wavelets, at the virtual condition excluding anatomical or histological characteristics. In contrast the virtual DF ablation changed fibrillation to organized tachycardia, CFE ablation gradually organized fibrillation and finally terminated it in our model. Both types of ablation had anti-arrhythmic effects with different mechanisms. We speculate that LDF ablation eliminated passive wave-breakers, but CFE ablation might target core of the fibrillation. Further study is warranted for the mechanism of virtual ablation and whether CFE ablation eliminated rotor or mother focus.
After Hodgkin and Huxley described action potential with a mathematical model (27), much research has been put into a model of human cardiac cells; moreover, computer models of cardiac electrophysiology have been developed to organ scales with parallel computing technology. Computer simulation modeling will fill the gap between clinical electrophysiology and sophisticated basic arrhythmia research. Furthermore, in silico models may be applicable to practical purposes, such as appropriate targeting of virtual ablation, estimation of cardiac resynchronization effects, or development of parameters to predict arrhythmia risk. It may also be able to provide clues in evaluating calcium associated wave-dynamics or mechano-electrical feedback. To achieve such goals, the development of physiologic and highly efficient modeling, integration of patient specific electroanatomical information, and creation of sophisticated analytic software are warranted.
Although CFE guided ablation has been mostly applied in atrial fibrillation, we used ten Tusscher-Panfilov model (10) which is a ventricular modeling. Though our previous studies suggest that fractionated electrogram guided ablation may terminate or reduce inducibility of ventricular fibrillation (28), the present study results may not be applicable to atrial wave dynamics. We are currently conducting a separate study using a human atrial cell model.
This study aims to apply clinical CFE ablation to a simulation model and to propose a new methodology to build a bridge between clinical approach and basic science of computer simulation. This study was conducted via 2D in silico modeling comprising a single cell layer. However, atrial tissue is thinner than ventricular tissue, and the role of transmural reentry is not as great as in ventricular models. Furthermore, our simulation modeling did not reflect anatomical characteristics, tissue heteogeneity with 3D anisotropic structure or realistic fiber orientations. Our model was more likely to realize the multiple wavelet type of fibrillation than mother rotor dependent fibrillation. We consistently placed the virtual bipolar catheter on a vertical position in the mapped area; therefore, the distribution of CFE may vary for different catheter directions or inter-electrode intervals.
We successfully realized virtual CFE and virtual CFE targeted ablation during fibrillation. CFE-CL was spatially correlated with WB, PS, or LDF, respectively, and PS are mostly positioned at the periphery of short CFE-CL areas with CFE-CL change. Virtual ablation targeting short CFE-CL area did terminate fibrillation and high LDF ablation changed fibrillation to organized tachycardia in this in silico human cardiomyocyte model. Current clinical CFE ablation has electrophysiologically valid background, not a barely experience based destructive surgery.

 XML Download