

 PDF
PDF ePub
ePub Citation
 Print
Print


INTRODUCTION
Osteoporosis and osteoporosis-related fractures are major public health problems worldwide (1). As the aged population is growing in many countries, the incidence of osteoporotic fractures expected to increase as well. Because Korea is one of the most rapidly aging countries, the percentage of people over 60 yr will triple by 2050 (from 13% in 2008 to 40% in 2050) (2). As a result, the number of osteoporotic fractures in Korea will likely continue to increase, contributing to rapid growth of the related social and economic burden in the future.
In 1994, the World Health Organization (WHO) defined osteoporosis on the basis of bone mineral density (BMD) using dual-energy X-ray absorptiometry (DXA), which is the most robust predictor of fracture risk (3). It has been widely used to assess fracture risk and diagnose osteoporosis. However, BMD is influenced by various factors such as genetic, geographic, and socioeconomic characteristics, and ethnic variations in BMD values are well documented. For example, it has been shown that the BMD of the non-Hispanic black and Mexican-American populations are higher than those of the non-Hispanic white population (4) and the values of the Asian population are lower than those of the American white population (5). There are also some differences in BMD among the Asian countries (5, 6, 7, 8). Hence, there is a need to develop and use local reference BMD values rather than those provided by the manufacturers of DXA systems. However, there is a lack of well-defined BMD reference values or criteria for the diagnosis of osteoporosis in Korean men and women. GE Lunar and Hologic, 2 major DXA manufacturers in Korea, currently use inappropriate reference data; GE Lunar DXA devices use small-scale samples from 6 health examination centers in Korea (9), and Hologic devices use data from the Japanese population (10).
The purpose of this study was to investigate BMD of the spine and femur of healthy men and women aged 20 yr and older, determine reference BMD values for the Korean population using a population-based sample, and compare the prevalence of osteoporosis using data calculated from the present study and data supplied by a DXA manufacturer.
MATERIALS AND METHODS
Study design and participants
This cross-sectional study used data from the Korea National Health and Nutrition Examination Survey (KNHANES), which have been periodically conducted by the Korea Centers for Disease Control and Prevention since 1998. The KNHANES is the largest publicly available database in Korea, and samples are selected through a complex, stratified, multistage probability design. It consists of three different components (a health interview, a nutrition survey, and a health examination). Data were collected by household interviews and direct standardized physical examinations conducted in mobile examination centers.
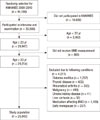
During the period from January 2008 to December 2010, 44,298 persons were selected for KNHANES from 576 national districts. Of those selected, 33,509 completed the interview and examination. From the 33,509 participants, we selected 29,254 individuals who were aged ≥20 yr and had received BMD measurement. Of these participants, 4,211 were excluded for specific illnesses or medications that may affect bone metabolism, gathering 25,043 participants as the final study population (Fig. 1).
Measurements of anthropometric parameters and BMD
For measurement of height, examinees stood barefoot on the flat base of the stadiometer. The height (in centimeters) and weight (in kilograms) of the subjects were measured to the nearest 0.1 cm and 0.1 kg, respectively, and body mass index was calculated as weight (kilograms) divided by height squared (meters). The BMD of the lumbar spine, left total hip, and left femoral neck was measured using the Discovery-W fan-beam densitometer (Hologic Inc., Bedford, MA, USA). For lumbar spine BMD, the mean value of L1 to L4 was chosen for analyses following the recommendation of the International Society for Clinical Densitometry (ISCD) in 2007 (11). When the BMD of the left femur could not be measured (e.g., postoperative state, fracture, deformity, or malformation), the BMD of the right femur was used. We measured the BMD of only the lumbar spine when it was impossible to assess the BMD of both femurs. All examinees were stratified by 10-yr age groups, and the BMD was calculated as the mean and standard deviation (SD) at the lumbar spine and femur along with the height, weight, and body mass index for each group.
Precision of BMD measurements
Technicians participated in BMD measurements were tested for precision. It was performed by making duplicate measurement of 30 participants or triplicate measurement of 15 participants. Between measurements, each individual stepped out of the machine and repositioned on the machine again. Precision errors were calculated as the percentage coefficient of variation (CV%), and allowed precision errors for total hip, femur neck, and total lumbar spine were 1.8%, 2.5%, and 1.9%, respectively.
Diagnosis of osteoporosis
The reference BMD values were determined from a group of young healthy adults (aged 20-29 yr) in accordance with the recommendations of the WHO and ISCD and the method chosen by the DXA manufacturer (Hologic). The T-score was calculated as follows:
Statistical analysis
Sample weights and the complex design of the survey were considered to produce national estimates of sex- and age-specific mean BMD values. SDs were calculated using a Taylor series linearization method to account for the complex survey design, and a ratio adjustment was used to produce sample weights (12). A Rao-Scott chi-square test was performed to compare the prevalence of osteoporosis according to different reference data. Statistical analysis was performed using Stata software version 10 (StataCorp LP, College Station, TX, USA).
RESULTS
Subject characteristics
The baseline characteristics of the subjects by decade are shown in Table 1. A total of 25,043 subjects (11,792 men and 13,251 women) were included in the analysis; 45.4% of the men and 43.8% of the women were ≥50 yr of age. Among the women ≥50 yr of age, 87.1% were postmenopausal. The mean age at menopause was 49.4±4.0 yr, and the difference between the current age and age at menopause was 14.3±11.5 yr.
Age-related changes in BMD
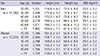
A comparison of each BMD measurement based on age (by decade) and sex is shown in Table 2. Age-related decreases in BMD were greater in women than in men. Compared with the reference BMD values for young adults (aged 20-29 yr), the BMD in men decreased by 17.6% in the total hip, 27.2% in the femoral neck, and 9.0% in the lumbar spine in those ≥70 yr of age. Among women, there was a large decline in BMD after 50 yr of age; the decreases in BMD in those ≥70 yr of age were 25.4% in the total hip, 32.3% in the femoral neck, and 25.2% in the total lumbar spine compared with the reference age group. Among men, peak BMD occurred in those 20-29 yr of age in all measured sites; among women, peak BMD occurred in those aged 40-49 yr of age in the total hip, in those aged 20-29 yr of age in the femoral neck, and in those aged 30-39 yr of age in the lumbar spine.
Cutoff values of BMD for diagnosis of osteoporosis
Table 3 summarizes the reference BMD values for each site from this study (from Korean population) and those supplied by the DXA manufacturer (from Japanese population). Compared with the values from Japanese, the mean reference BMD values from this study were higher for both the total hip and femoral neck and lower for the lumbar spine in men but were higher for the total hip and lower for both the femoral neck and lumbar spine in women. We also found differences in the SDs between the Korean and Japanese populations at all measured sites, but differences were very small (0.003-0.017 g/cm2).
In the current study, the cutoff values that corresponded to a BMD of 2.5 SD less than the mean reference BMD values from the Korean population were obviously higher than those from the Japanese population in the total hip (+ 0.127 g/cm2) and femoral neck (+ 0.053 g/cm2) in men and in the total hip (+ 0.070 g/cm2) in women. In contrast, the cutoff values from the Korean population at the other sites were lower than those from the Japanese population; however, the differences were relatively small (0.004-0.030 g/cm2).
Prevalence of osteoporosis
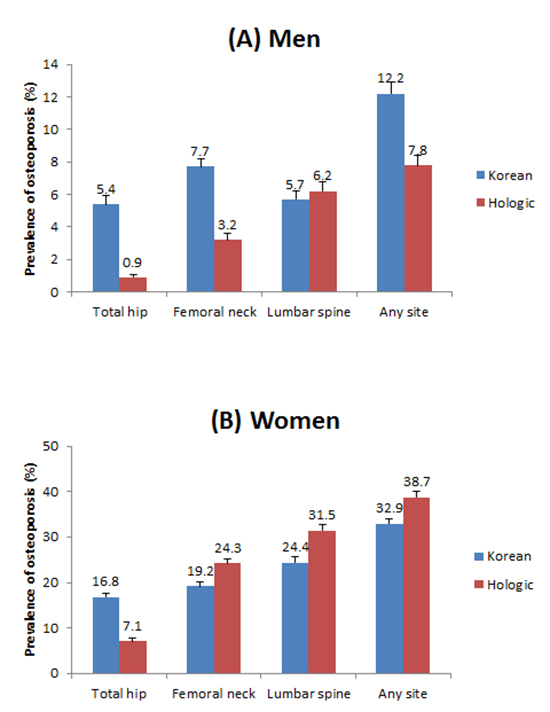
Fig. 2 shows the prevalence of osteoporosis in men and postmenopausal women (≥50 yr of age) in the total hip, femoral neck, and lumbar spine. Overall, the prevalence of osteoporosis at any site (total hip, femoral neck, and lumbar spine) based on the data in the current study was increased in men ≥50 yr of age compared with the Japanese reference data (12.2% vs. 7.8%, P<0.001) and decreased in postmenopausal women ≥50 yr of age compared with the Japanese reference data (32.9% vs. 38.7%, P<0.001). However, the difference in prevalence based on the application of the 2 reference values varied according to the measured anatomic site. In men, the prevalence of osteoporosis was higher at the total hip (5.4%) and femoral neck (7.7%) but not the lumbar spine (5.7%) when using the reference data from the present study compared with the Japanese reference data (0.9%, 3.2%, and 6.2%, respectively). In contrast, in postmenopausal women, the prevalence of osteoporosis was lower at the femoral neck (19.2%) and lumbar spine (24.4%) but not the total hip (16.8%) when using the reference data from the present study compared with the Japanese reference data (24.3%, 31.5%, and 7.1%, respectively). In terms of the sex ratio of the prevalence of osteoporosis, there were considerable differences when different criteria were applied. For example, the ratio (women to men) of osteoporosis at any site was 2.70 when using the reference data from the present study and 4.96 when using the Japanese reference data; the ratios for the total hip, femoral neck, and lumbar spine were 3.11, 2.49, and 4.28, respectively, when using the reference data from the present study and 7.89, 7.58, and 5.08, respectively, when using the Japanese reference data.
Fig. 3 shows the prevalence of osteoporosis for each age and sex group. The prevalence increased with age, resulting in a higher prevalence of osteoporosis in the aged population (31.8% of men and 63.2% of women ≥70 yr of age). In addition, a sex difference in the prevalence of osteoporosis was observed. The difference in the prevalence of osteoporosis using the 2 reference databases showed an increase with age in men but was relatively constant based on age in women.
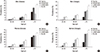
Fig. 4 shows the prevalence of osteoporosis in men and postmenopausal women ≥50 yr of age in various age groups and at various measurement sites according to different reference values. In contrast to the female group, the prevalence of osteoporosis in men determined using the reference data in the present study was remarkably increased with aging, especially in the total hip and femoral neck, compared with the prevalence estimated using the Japanese reference data; the prevalence of osteoporosis in men ≥70 yr of age at the total hip, femoral neck, and lumbar spine was 16.9%, 25.2%, and 12.2%, respectively, using the Korean reference data and 4.1%, 11.7%, and 11.9%, respectively, using the Japanese reference data. Similarly, in women ≥70 yr of age, the prevalence of osteoporosis at the total hip increased from 20.0% to 40.3% by applying the Korean reference data. The discrepancy in the prevalence of osteoporosis at the lumbar spine with the use of the Korean and Japanese reference data was relatively small in both sexes and at various ages.
DISCUSSION
The results of the present study show an increased prevalence of osteoporosis in men and a decreased prevalence of osteoporosis in women when using new diagnostic reference data from the Korean population compared with the existing Asian reference data provided by the manufacturer of the DXA device (Hologic). The difference in the prevalence of osteoporosis with the use of the Korean and Asian data (from Japanese population) increased with age, particularly in men.
We evaluated the characteristics of BMD at various ages in the general Korean population. As expected, the mean BMD values for both the hip and lumbar spine were lower than the values reported for the African-American, non-Hispanic white, Mexican American, and northern European populations (4, 13, 14). Compared with other Asian subjects, the BMD values were lower than those for Chinese (15) and Indian (16) subjects for all measured sites. However, the BMD values were slightly higher in the total hip and the femoral neck in men and in the total hip in women but were slightly lower at the other sites when compared with the values for Japanese subjects (based on Japanese data from Hologic).
We also found sex differences in age-related changes in BMD. The results of the present study showed that the decline in BMD values was sharp in women who were 50-59 yr of age but not in men. A steeper decline in BMD values in women ≥50 yr of age could be related to the rapid decrease of estrogen production at menopause. This phenomenon was similar across the female populations of all ethnicities (4).
In addition, there was a difference in achievement of peak BMD between both sexes. According to our results, the peak BMD of all measured sites in men was attained at 20-29 yr of age and decreased thereafter at a slower rate than in women, which is similar to other ethnicities (4). On the contrary, in women, the peak BMD in the total hip, femoral neck, and lumbar spine occurred at the ages of 40-49 yr, 20-29 yr, and 30-39 yr, respectively. Our findings in Korean men and women are consistent with the results of previous study that analyzed data of the KNHANES 2008 to 2010 of the Korean population (17). In other Asian female studies, such as Chinese (15) and Japanese (18), the achievement of peak BMD in the lumbar spine has been reported at 30-39 yr of age; However, the age at peak BMD in the femur were different according to populations (15, 18). In white subjects, the peak BMD in the lumbar spine and femur was reached generally at 20-29 yr of age (4, 19, 20).
To explain these different observations among populations, several studies were performed to evaluate the influence of diverse factors. As a result, the difference of BMD in same age group between ethnicities decreased or disappeared after adjusting for height, weight, or body composition, which implies that these factors are major contributors for ethnic variations (21, 22). However, various trends between ethnicities and sexes (i.e., age-related bone loss and age at peak BMD) were not accounted for simply by body size or composition, and may result from numerous biochemical and biomechanical factors (including calcium and vitamin D metabolism, sex hormone levels, weight bearing physical activity, etc.) as well as genetic, nutritional, and health status variables (23, 24).
To apply the WHO criteria, it is important to select an appropriate age group for the calculation of BMD reference values. Researchers have chosen various reference ranges, such as 20-29 yr (25, 26, 27), 20-39 yr (13, 14, 28), 30-50 yr (29), 20-44 yr (18, 30), and so on. In contrast, some studies have determined the reference data on the basis of the age group with the highest mean BMD values (5, 16, 31). In choosing a cutoff value of -2.5 SD, the original intention of the WHO group was for osteoporosis to be a rare diagnosis in healthy women before menopause (32). Based on this, the ISCD recommended an age range of 20-29 yr as a reference group. Although there have been several reports on the prevalence of osteoporosis in Korean adults, these studies used an age range of 20-39 yr (33) or age decades with peak BMD (30-39 yr) (31). However, as mentioned previously, we chose the mean BMD at 20-29 yr to follow the WHO and ISCD recommendations and to apply the same method as that from the Japanese reference data from Hologic. Despite adopting the identical method, there was considerable discrepancy between the local reference values from our study and the data supplied by Hologic.
As indicated in the definition of osteoporosis, the cutoff values are determined by the mean and SD of the reference BMD values. In this study, there were differences between the Korean and Japanese data at all skeletal sites. In general, when different databases were compared, the difference in the mean BMD value was relatively larger than that of the SD because the SD was stable across populations (16, 30). This trend was also observed in the current study between the Korean and Japanese data at all measured areas. When combining the differences in the mean and SD of BMD, the differences in the cutoff values were largest at the total hip in men and women. The consequent effect on the prevalence of osteoporosis, however, was not the same because the prevalence of osteoporosis in the total hip contributes more to the overall prevalence in men than in women. This is caused by a different pattern of bone loss between the sexes; that is, after 50 yr of age, bone loss in the lumbar spine is steeper in women. Thus, the prevalence of osteoporosis in women is determined mainly in the lumbar spine, and the difference in the values at the femur has only a minimal effect on the overall prevalence of osteoporosis.
Using the Korean reference data from the current study, the prevalence of osteoporosis in Korean men and postmenopausal women ≥50 yr of age was 12.2% and 32.9%, respectively. However, when applying the Japanese reference data, the prevalence was 7.8% and 38.7%, respectively. Which reference data from these 2 sources are appropriate? There is evidence that supports the use of local reference data. First, although these studies were performed in subjects of the same ethnicities, differences in BMD in adjacent regions have been reported in many investigations in Asian (5, 6, 7, 8) and white (13, 20, 28) subjects. In addition, each study suggested reasonable explanations to favor cutoff values based on local reference data, such as relating the prevalence of osteoporosis with the incidence of fragility fracture in the local population (13) or comparing the prevalence of osteoporosis with that of other countries (6). Second, in general, the prevalence of osteoporosis in women ≥50 yr of age is 2 to 3 times greater than that in men (6, 7, 19, 34), which is roughly equivalent to the difference in the risk of an osteoporotic fracture between men and women over their lifetimes (3, 35). A study of the incidence of fracture of the femur among Korean adults also reported a similar trend (36). When applying the local reference data, the ratio of osteoporosis prevalence between the sexes was almost identical to this observation (3.11, 2.49, and 4.28 for the total hip, femoral neck, and lumbar spine, respectively). However, when using the DXA reference data, the ratio was nearly 5 to 7 (7.89, 7.59, and 5.08 for the total hip, femoral neck, and lumbar spine, respectively), which denotes inappropriateness as a reference standard in predicting fracture risk (Fig. 2). Third, a typical age-related change in BMD was not found when using the Japanese reference data. In men ≥50 yr of age, the decrease in BMD in the hip became more rapid with age compared with the lumbar spine, as indicated in previous studies (4, 15, 33). Therefore, in men ≥70 yr of age, the BMD of the hip has a major effect on the prevalence of osteoporosis. In the current study, this trend was noted only after the application of the Korean reference data, not with the Hologic-provided reference data. Thus, the existing Asian reference data from Japanese population are not applicable to the Korean population. Taking all of these factors into account, the new reference data from the general Korean population in this study are appropriate for the diagnosis of osteoporosis in Korean subjects. Accordingly, the simple adoption of the Japanese reference data from Hologic will lead to an underestimation of the prevalence of osteoporosis in men and an overestimation of the prevalence in women.
There have been 2 studies of the prevalence of osteoporosis in Korea using local normative BMD data (31, 33). One of these studies (31) was performed using health screening subjects (3,435 male and 10,231 female). Although the study had a large sample size, the number of subjects who were 20-29 yr of age, the most important age range in determining the reference cutoff value, was too small (34 male and 61 female). In addition, it was not a population-based study. Thus, the results were a limited representation of Korean normative BMD data. The other study (The Namwon Study) (33) investigated new reference values for the diagnosis of osteoporosis from 4,148 community-dwelling men and women who were 20-79 yr of age. The reference age group included subjects who were 20-39 yr of age. The prevalence of osteoporosis among those 50-79 yr of age at the femoral neck and lumbar spine was 12.4% and 40.1% in women and 5.9% and 6.5% in men, respectively; these are relatively lower values in women and higher values in men compared with the findings in the present study. The sex ratio of the prevalence of osteoporosis was 2.11 and 6.17 for the femoral neck and lumbar spine, respectively, which is similar to our findings for the femoral neck and much higher than our findings for the lumbar spine. The results of the Namwon study had some limitations, including geographically localized participants, an unequal sample size across age decades (a relatively large sample of subjects in their 60s), use of a different definition of lumbar spine than used in the ISCD recommendation (L2-L4 vs. L1-L4), and inappropriately high sex ratio in the lumbar area.
By applying the new Korean reference data, the prevalence of osteoporosis in men increased by 4.4% compared with the value determined using the Japanese reference data. In subjects ≥70 yr of age, the prevalence of osteoporosis increased dramatically from 18.7% to 31.2%. Although osteoporotic fractures are less common in men than in women, fractures in men are associated with higher morbidity and mortality than in women (37). In this respect, we need to determine whether osteoporosis in elderly men is an overlooked public health issue. According to the database from the Health Insurance Review and Assessment Service of Korea, the prevalence of hip fracture has increased approximately 8.7% every year (between 2010 and 2012) in men ≥70 yr of age, which is approximately 27% higher than the increase in the male population in the same age group. Moreover, based on recent nationwide data on hip fracture (between 2005 and 2008), the sex ratio (women to men) of cases of hip fracture in Korea was 1.99-2.06, which was lower than that of many other Asian (2.49-3.11) and Western countries (2.26-2.87) (36). These phenomena may partially stem from the lower treatment rate with underdiagnosis of men with osteoporosis resulting from indiscriminate adoption of the cutoff values provided by the DXA manufacturer.
In addition, on the basis of our findings, use of the Japanese reference data from Hologic has resulted in the overdiagnosis of osteoporosis in Korean women and may have caused unnecessary use of prescription medications to prevent osteoporosis. This is important because overtreatment resulting from overdiagnosis increases the economic burden of individuals and the government, which is of great clinical significance given the rapidly aging population and shrinking workforce in Korea. Furthermore, use of a bisphosphonate, the most widely used anti-osteoporotic agent, could induce severe adverse events such as osteonecrosis of the jaw and atypical fragility fracture (38). Hence, our results have important clinical and public health implications. It is prudent to use local normative data for the diagnosis of osteoporosis, and new reference values from the current study should be applied to use of the Hologic DXA device in Korea.
The strengths of this study are that it is the first large-scale study of reference values for BMD of the vertebral and femur area in the general Korean population. Also, the study subjects were randomly sampled from all geographic regions in Korea, which ensures the representativeness of the reference data and reduces the effects of potential biases that could adjust the estimates. Furthermore, based on the WHO and ISCD recommendations, the appropriate age group was selected in this study, and the sex ratio of the prevalence of osteoporosis was in good agreement with data on prevalence of fracture in Korea (36). Lastly, our study used the results from fan-beam type densitometer which is widely used in Korea. However, the reference data provided by densitometer were measured by pencil-beam type machine (10). Given that the difference of fan-beam type and pencil-beam type, reference values from this study are more appropriate for Korean population (39). Nevertheless, this study has several potential limitations. First, because of the cross-sectional design, we could not accurately evaluate the association between aging and changes in BMD. Second, metabolic diseases were not fully excluded in reference age group (aged 20-29 yr). Despite our efforts to select healthy young adults among the participants, limited information had prevented our group from managing this problem completely. Third, we excluded subjects with comorbid conditions that may affect BMD, and this may have resulted in an underestimation of the prevalence of osteoporosis. Finally, although the sex ratio of osteoporosis agrees well with lifetime prevalence of osteoporotic fracture, it does not always support the appropriateness of our normative values because it is only ratio, not absolute value.
In summary, we established new reference values for the femur and lumbar spine that differ from the Japanese values provided by the manufacturer of the DXA device. Our data will serve as valuable reference standards for the diagnosis and management of osteoporosis in Korea. Further research should be conducted to investigate the relationship between osteoporosis as determined in our study and fracture risk. Also, our results warrant future research to evaluate the reference values provided by manufacturers of other DXA devices used in Korea.


 XML Download