

 PDF
PDF ePub
ePub Citation
 Print
Print


INTRODUCTION
Chronic kidney disease (CKD) is associated with end stage renal disease as well as cardiovascular morbidity and mortality (1-3). CKD is a worldwide public health problem, and thus, identification and management of modifiable CKD risk factors are important to deploy for the prevention of adverse effects. The most important established risk factors for CKD are diabetes and hypertension (4-7). Obesity and metabolic syndrome are also known as independent predictors for the development of CKD (8-10).
Uric acid (UA) is a final byproduct produced by purine metabolism in humans. It is strongly associated with renal failure and cardiovascular disease (11, 12), and it is found at particularly high serum levels in people with hypertension and metabolic syndrome, as well as those suffering UA related metabolic abnormalities (e.g., dyslipidemia or insulin resistance) (13, 14).
Recent concerns relating UA and CKD have been identified with some epidemiologic studies reporting an association between hyperuricemia and CKD (15-18). Despite the existence of these studies, there is scarce longitudinal data available about the relationship between serum UA levels and the development of CKD by Chronic Kidney Disease Epidemiology Collaboration (CKD-EPI) equation in the Korean population, where the genetic and environmental backgrounds differ from that of western countries. Therefore, we conducted a prospective cohort study in order to investigate whether or not serum UA is useful as an independent predictor for the development of CKD in apparently healthy Korean men.
MATERIALS AND METHODS
Study participants
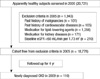
All employees of Korean companies participate in an annual health examination, as required by Korea's Industrial Safety and Health law. The participants in this study were composed of individuals who had received a comprehensive health examination at baseline (2005) and were then re-examined 4 yr later (2009), with both examination conducted at Kangbuk Samsung Hospital. Initially, 20,721 individuals were identified as potential participants, and of these, 1,943 (9.4%) were excluded for the following reasons: past history of malignancies (n = 101, 0.5%); past history of cardiovascular disease (n = 105, 0.5%); administration of medications for lipid-lowering (n = 1,356, 6.5%) or kidney diseases (n = 171, 0.8%) at the time of examination. Based on the baseline (2005) medical records, 210 (1.0%) subjects were also excluded due to the observation of baseline eGFR < 60 mL/min per 1.73 m2. After these exclusions, the total number of eligible study participants was 18,778 (Fig. 1).
Measurements
The initial health examinations performed in 2005 included a medical history evaluation, a physical examination, a questionnaire about health-related behavior, and anthropometric and biochemical measurements. The medical and drug prescription history were assessed by the examining physicians as part of the examination. All participants were asked to respond to a health-related behavior questionnaire which included the topics of alcohol consumption, smoking and exercise. The questions about alcohol intake included the frequency of alcohol consumption on a weekly basis and the typical amount consumed on a daily basis ( ≥ 20 g/day). We considered persons reporting that they smoked at the time of the questionnaire to be current smokers. In addition, the participants were asked about the frequency per week of physical activities they engage in that lasts long enough to produce perspiration such as jogging, bicycling and swimming ( ≥ 1 time/week). The diagnosis of diabetes mellitus was defined as a fasting blood glucose level of at least 126 mg/dL, or the current use of blood glucose-lowering agents. Hypertension was defined as either the current use of antihypertensive medication or as having a measured blood pressure (BP) ≥ 140/90 mmHg at the initial examination.
Blood specimens were sampled from an antecubital vein after more than 12 hr of fasting. Serum levels of creatinine, glucose, total cholesterol, triglycerides, low-density lipoprotein (LDL) cholesterol, high-density lipoprotein (HDL) cholesterol and UA were measured using Bayer Reagent Packs on an automated chemistry analyzer (Advia 1650 Auto Analyzer; Bayer Diagnostics, Leverkusen, Germany). The measurement techniques employed included the hexokinase method for glucose, an enzymatic colorimetric assay for serum lipids, and an immunoradiometric assay for insulin (Biosource, Nivelles, Belgium). The serum UA method was based on the Fossati enzymatic reaction using uricase with a Trinder-like endpoint (Advia 1650 Auto Analyzer). Insulin resistance was calculated using the homeostasis model assessment of insulin resistance (HOMA-IR) as described by Matthews et al. (19): fasting serum insulin (µU/mL) × fasting blood glucose (mmol/L)/22.5. Serum creatinine (SCr) was measured using the alkaline picrate (Jaffe) method. Kidney function was estimated using the glomerular filtration rate (GFR) which was calculated using the CKD-EPI equation: eGFR = 141 × min (SCr/K, 1)a × max (SCr/K, 1)-1.209 × 0.993age × 1.018 [if female] × 1.159 [if Black], where SCr is serum creatinine, K is 0.7 for females and 0.9 for males, "α" is -0.329 for females and -0.411 for males, min indicates the minimum of SCr/K or 1 and max indicates the maximum of SCr/K or 1 (20). CKD was defined as an eGFR of < 60 mL/min per 1.73 m2.
Trained nurses obtained sitting BP levels using a standard mercury sphygmomanometer. The first and fifth Korotkoff sounds were utilized in order to estimate the systolic and diastolic BP. Height and weight were measured after an overnight fast with the shoeless participants wearing a lightweight hospital gown.
Statistical analyses
One-way ANOVA and χ2-test were used to analyze the statistical differences between the characteristics of the study participants at the time of enrollment in relation to the quintiles of serum UA levels. Categories for serum UA results were comprised of the following quintiles: < 5.1 mg/dL, 5.1 to 5.7 mg/dL, 5.7 to 6.3 mg/dL, 6.3 to 7.0 mg/dL and ≥ 7.0 mg/dL. Age-adjusted and multivariable-adjusted logistic regression analyses (models 1, 2 and 3, with the latter adjusted for age) were performed to include HOMA-IR, triglyceride, BMI, alcohol intake, smoking status, regular exercise, hypertension and diabetes mellitus.
In addition, we compared the development of CKD in hyperuricemic participants (serum UA ≥ 7.0 mg/dL) vs normouricemic participants. Statistical analyses were performed using SPSS 17.0 for Windows software package (SPSS, Chicago, IL, USA). All reported P values were two-tailed and those with results < 0.05 were considered to be statistically significant.
RESULTS
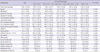
The metabolic characteristics of the participants, arranged according to serum UA quintiles, are shown in Table 1. Overall, the mean ± S.D age of the participants was 41.8 ± 6.3 yr.
During 74,821.4 person-years of follow-up, 110 cases of CKD had developed by 2009. At baseline, a graded increasing trend in relation to serum UA quintiles was observed for systolic and diastolic BP, BMI, total cholesterol, triglyceride, LDL-cholesterol, HOMA-IR, blood creatinine, insulin, BUN and percentage of Hypertension. Age, HDL-cholesterol, fasting serum glucose, eGFR, percentage of regular exercise, and diabetes mellitus showed a graded decreasing trend in relation to serum UA quintiles.
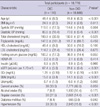
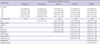
The metabolic characteristics of the participants relative to the development of CKD during the 4 yr follow-up period are shown in Table 2. During the follow-up period, CKD occurred in 110 of the total participants. Table 3 presents the odds ratio (OR) and 95% confidence intervals (CI) for the likelihood of development of CKD relative to the quintile groups established for serum UA level. In the categorical analyses, the likelihood of developing CKD increased with increasing serum UA quintile (P for trend < 0.001). In unadjusted analyses whereby Q1 was utilized as a reference, the Q4 and Q5 groups were found to be significantly associated with a greater likelihood for the development of CKD. This difference remained significant even after further adjustments for covariates in models 1, 2, and 3. After adjusting for age, baseline eGFR, systolic BP, HOMA-IR, triglyceride, BMI, alcohol intake, smoking status, regular exercise, hypertension and diabetes mellitus, the OR and 95% CI associated with the likelihood for development of CKD with respect to groups Q2, Q3, Q4, and Q5 were 1.22 (0.54-2.75), 1.19 (0.54-2.65), 2.59 (1.22-5.51), and 3.03 (1.48-6.19), respectively.
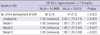
Table 4 presents the multivariate-adjusted OR and 95% CI for the development of CKD by comparing the hyperuricemic (≥ 7.0 mg/dL) vs normouricemic (< 7.0 mg/dL) participants. With the normouricemic participants set as the reference, the OR and 95% CI for the development of CKD with respect to the hyperuricemic participants was 1.96 (1.28-2.99).
DISCUSSION
The major finding of our study was that high serum UA levels increased the risk for the development of CKD, independent of confounding variables. Thus, serum UA levels are useful as a predictor of disease susceptibility in apparently healthy Korean men. Our findings provide significant evidence that hyperuricemia is associated with the development of CKD, regardless of other well-known risk factors such as aging, alcohol intake, smoking, hypertension and diabetes mellitus.
In this study, only men were considered eligible study participants. The application of the CKD-EPI equation is not the same for men and women, and pre-menopausal women have lower serum UA levels than men or post-menopausal women, as estrogen stimulates urinary urate excretion (21).
The importance of serum UA as an independent predictor for CKD progression remains a topic of ongoing debate. A number of studies have reported that hyperuricemia is associated with the development of CKD (15-18), while others have produced contrary results (22, 23). In a population-based study including epidemiological follow-up data from 13,338 participants in two community-based cohorts, the Atherosclerosis Risks in Communities and the Cardiovascular Health Study (Weiner et al.) evaluated the association between elevated serum UA and increased risk of incident kidney disease in a general US population over an extended follow-up period. They reported that each 1 mg/dL increase in UA increased the risk of developing CKD by 7%-11% (15). Obermayr et al. evaluated the prospective cohort of the Vienna Health Screening Project and found that elevated levels of serum UA independently increased the risk for developing new-onset kidney disease (16). On the other hand, Sturm et al. reported that serum UA was not an independent predictor for CKD progression as evidenced by a 7-yr follow-up study, The Mild to Moderate Kidney Disease (MMKD) Study (22).
There are a number of mechanisms by which hyperuricemia increases the risk for the development of CKD. Clinical evidence exists indicating that hyperuricemia raises BP due to endothelial dysfunction caused by UA (24). Another study in rats suggests that hyperuricemic conditions alter glomerular hemodynamics and cause cortical renal vasoconstriction as evidenced by a significant increase of afferent and efferent arteriolar resistances. A decrease in the glomerular plasma flow and ultrafiltration coefficient resulted in a 35% decrease in single nephron GFR but an increase in glomerular pressure (25).
The major strengths of this study include the large sample size and the prospective study design. Furthermore, estimating eGFR using the recently developed CKD-EPI equation is known to be more accurate in the eGFR range > 60 mL/min per 1.73 m2. Participants with baseline eGFR < 60 mL/min per 1.73 m2 were excluded. Nevertheless, some limitations should be considered. First, the study participants were recruited from individuals who actively sought to evaluate their health status at a health promotion center; thus, this study may show a participant selection bias. Second, the participant's serum creatinine levels were measured only once a year. Third, we used an eGFR instead of a directly measured GFR in order to define CKD. A recent review article reported that current eGFR had greater inaccuracy in populations without known CKD than in those with the disease (26). Nevertheless, current eGFR facilitates the detection, evaluation and management of CKD, and many organizations recommend the use of equations that estimate GFR in epidemiologic studies and in clinical evaluation of renal function (26). Therefore, our findings are applicable to clinical and public health practice settings. In addition, ethnic factors characteristic of Asian populations are not well-established for the use of equations that estimate GFR. Therefore, these equations need to be validated with additional studies including large Asian cohorts.
In conclusion, this epidemiologic prospective cohort study indicates that high serum UA levels are associated with an increased likelihood for the development of CKD over a 4-yr follow-up period, and these associations are significant after adjusting for age, baseline eGFR, systolic BP, HOMA-IR, triglyceride, BMI, alcohol intake, smoking status, regular exercise, hypertension and diabetes mellitus, all of which are known independent risk factors for development of CKD. These findings highlight the importance of regular surveillance and monitoring of serum UA for the goal of circumventing the manifestation of CKD and its progression into cardiovascular disease and endstage renal disease.
 XML Download