

 PDF
PDF ePub
ePub Citation
 Print
Print


INTRODUCTION
Spirometry is clinically important for the evaluation of general respiratory health, as well as for the diagnosis and follow-up of various respiratory diseases, including asthma and chronic obstructive pulmonary disease (1). It is also often used to monitor the incidence of respiratory diseases caused by exposure to occupational and environmental toxins, and to perform epidemiological investigations into the causal relationships between such exposures and respiratory disease (2).
The interpretation of spirometry results is mainly based on comparisons between reference values estimated from reference equations and values measured in individuals (3). The interpretation may be different according to the reference equations used to estimate the normal values (4, 5). Spirometry reference equations differ among countries and ethnicities (6-12), and it is recommended to choose a reference equation derived from a general population having the same anthropometric (gender, age, height, etc.), ethnic, socioeconomic, and environmental characteristics as those to whom the equation is to be applied (3, 13).
Several studies have reported spirometry reference equations for the Korean population, but most of them were limited to a specific area or age group, or focused on the patients of specific hospitals; thus, their equations were not generally applicable to the entire Korean population (7, 14-18). In 2005, a spirometry reference equation for representative Koreans was reported based on the data from the second Korea National Health and Nutrition Examination Survey (KNHANES II, 2001). However, the predicted values of forced vital capacity (FVC), forced expiratory volume in 1 second (FEV1), and FEV1/FVC% estimated from KNHANES II equations were much higher than those of other Koreans or ethnicities (4, 6). The proportion of subjects classified as ventilation dysfunction was increased when the KNHANES II equations is used as a reference equation (5, 19). In our recently study, we have compared the goodness-of-fits of KNHANES II and US NHANES III reference equations to spirometry data of healthy Korean adults (20). The results suggested that the US NHANES III reference equations showed a better fit to spirometry data of healthy Korean adults than KNHANES II ones. In 2005, moreover, the American Thoracic Society (ATS) and the European Respiratory Society (ERS) suggested stricter criteria for evaluating acceptability and repeatability (1), but most of spirometry reference equations reported for Koreans do not meet those criteria. In this situation, new models estimating the normal reference values of FVC, FEV1, and FEV1/FVC% are required to be derived from representative Korean data with high acceptability and repeatability. In addition, it is necessary to construct novel spirometric reference values, well designated for various conditions of a contemporary Korean general population because Korea has turned into a rapidly-aging society.
This study was conducted in order to develop new reference equations for the Korean population using the data of the fourth Korea National Health and Nutrition Examination Survey (KNHANES IV, 2007-2009), and to evaluate the equation by comparing it with previously reported prediction equations for Koreans or other ethnicities.
MATERIALS AND METHODS
Data source and study population
This study is based on a secondary data analysis using the raw data from KNHANES IV (2007-2009). Data used in the analysis were obtained after approval of the research plan by the Center for Disease Control and Prevention of the Ministry of Health and Welfare of Korea. KNHANES, a nationwide sampling survey for obtaining national-level health statistics, secured its representativeness by selecting subjects using a probability sampling method (21).
The sampling method is summarized as follows: based on the census in 2005, survey areas (dongs/eups/myeons) were sampled by applying proportional allocation. From the selected dongs/eups/myeons, sampling units were extracted (100 in the first year and 200 in the second year), and from each of the extracted sampling units, 20-23 households were sampled through systematic sampling. KNHANES IV began in July 2007 and ended in December 2009. The survey of the KNHANES IV (2007-2009) covered 24,871 people over 1 yr of age from 9,421 households, and 23,632 of them participated in the health questionnaire and the physical examination survey (response rate: 74.5%). The KNHANES IV dataset comprised 3 sections: a health questionnaire (socioeconomic factors; smoking; drinking; physical activities; chronic disease symptoms, such as respiratory disease; and clinical history), a physical examination (anthropometric measures, blood pressure, blood test, and pulmonary function test), and dietary and nutritional data (21).
Spirometry
A dry rolling seal spirometer (Model 2130, Sensor Medics, Yorba Linda, CA, USA) was used to measure FVC, FEV1, and FEV1/FVC% according to the guidelines recommended by ATS/ERS (1). Spirometry was performed for adults over 19 yr of age, excluding those with severe chronic obstructive pulmonary diseases (severe asthma, bronchitis and pulmonary emphysema), those who had received thoracic or abdominal surgery within the previous 3 weeks, and those who had suffered myocardial infarction or heart attack within the previous 6 weeks. All spirometry results were evaluated, whether the results met the ATS/ERS criteria of acceptability and repeatability (1, 22). The criteria of acceptability and repeatability are as follows: first, there should be no coughing during the first second of expiration, no glottis closure-influencing measurement, no early termination or cutoff, no air leak at the mouth, and no obstruction of mouthpiece. Secondly, the spirogram must have a good initiation without hesitation in beginning expiration, and the extrapolated volume at the beginning of expiration should be less than 5% of FVC, or 0.15 L. Third, the spirogram shows a plateau, or the subject has attempted to exhale for at least 6 s. Finally, if 2 acceptable spirograms have been obtained, the 2 largest FVC and FEV1 values from 2 acceptable measurements must be within 0.15 L.
Statistical analyses
We conducted statistical analyses using SPSS 19 (IBM, Armonk, NY, USA). Reference equations were derived separately for men and women, and each equation was derived through multiple regression analysis using one of the spirometry parameters (FEV1, FVC, or FEV1/FVC%) as the dependent variable, and age, height, weight, body mass index (BMI), body surface area (BSA = 0.20247 × height0.725 × weight0.425), and their respective squares and cubes, as independent variables. The independent variables included in the final prediction model were selected based on the statistical significance of the combination of independent variables, adjusted coefficient of determination (explanatory power), standard error of estimate (SEE), simplicity, usability, reliability, low degree of freedom, and other factors (10). In order to compare the goodness of fit of the reference equations derived in this study with that of other equations, we calculated differences between the observed values and the values predicted using each prediction equation, and presented the differences as the percent mean difference ([observed value - predicted value]/[mean of observed value] × 100) and the mean squared difference (13), and compared the means of predicted values and observed values using a paired t-test.
RESULTS
Reference population
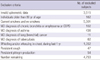
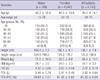
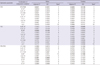
A total of 18,406 adults over 19 yr of age were included in the raw dataset of KNHANES IV, and spirometry measurements were available for 12,964 of them. Table 1 lists the exclusion criteria used in the reference population sampling. A total of 4,753 adults (706 men and 4,047 women) were selected as the reference population for deriving spirometry reference equations. Table 2 shows the anthropometric and spirometry measurements of the reference population. The mean ages of the men and women were 46.3 and 49.9 yr, respectively, and the age range was from 19 to 79 yr for all subjects. The mean height was 169.4 cm for men and 156.1 cm for women, and the height range was 124.8-196.0 cm for men and 124.2-176.7 cm for women.
Derivation of new reference equations
The adjusted R2 and SEE according to the combinations of independent variables are shown in Table 3. For FEV1 the combination of age square, height square and weight had the highest explanatory power and there was no multicollinearity among the independent variables. BMI and BSA were individually significant independent variables, but were excluded because they all showed multicollinearity with height and weight, and did not increase explanatory power significantly when added to the regression model. For FVC, when cube of height was entered into the regression model instead of height or height square, additional explanatory power was obtained. For FEV1/FVC%, combinations of independent variables had the highest adjusted R2 for men and women were those of age square and height and those of age and cube of height, respectively. Table 4 shows the final selected spirometric reference equations derived from reference population of this study. Polynomial regression models for FEV1 and FVC were shown higher explanatory power and high goodness of fit relative to linear regression models, they were finally adopted.
Difference between observed and predicted values
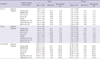
The means of the observed values of FEV1, FVC, and FEV1/FVC% for the reference population were not statistically different from the means of the predicted values in this study. However, predicted values calculated from other reference equations showed significant differences from the observed spirometric values, except for predicted FVC from Morris et al. (12) and predicted FEV1/FVC% from KNHANES II in females. The mean squared differences of the reference equations derived in this study were the lowest for all of the spirometry parameters, showing the highest goodness of fit of the regression models (Table 5).
Comparison with other reference equations
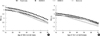
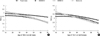
We fixed height at the mean height of the reference population, and compared changes in reference values of FEV1 and FVC according to age for each reference equation (Fig. 1, 2). For men, the FEV1 reference values of Morris et al. (12) showed the smallest difference from those of the present study, and for women, those of NHANES III (10) showed the smallest difference from the present study. The reference values for FEV1 of NHANES III were higher than the reference values of this study for both men and women, but the difference decreased in the over 60 age group, and, especially in women, the values were reversed (Fig. 1). The reference values for FVC in the present study showed the smallest difference from the reference values of Morris et al. (12) for both men and women. The reference values for FVC of this study, as those for FEV1, were generally lower than those of NHANES III for both men and women, but the difference was reduced in the over 60 age group (Fig. 2).
DISCUSSION
Our current study established a new spirometric prediction equation using the KNHANES IV data. The authors chose the combinations of age and height as independent variables for predicting normal FVC. Age and height are the factors most closely related to vital capacity, and most previous studies also formulate their prediction equations upon these 2 variables (7-12, 14). Respiratory function declines with age, mainly because of structural changes induced by aging in the respiratory system, including the chest wall, respiratory muscle, parenchyma, and peripheral airway (23). FEV1 and FVC reach a plateau at the age of 18-25 yr, and decrease thereafter. In general, the decrease starts later in non-smokers than in smokers (24), and the rate of decrease in FEV1 and FVC is accelerated at older ages (23). These tendencies suggest that the change in vital capacity resulting from aging in adults is non-linear. This may be why the explanatory power was the highest when the square or cube of age was included in the FEV1 and FVC reference equations. In this study, explanatory power was the highest when the cube of height was included in the FVC reference equation because the cube of height, which can represent the volume of human body, can better predict vital capacity (25). Two previous prediction equations for Koreans included weight in addition to age and height as explanatory variables of FVC (6, 15). We also found that weight was a significant explanatory variable for FVC and FEV1. When weight was included in the model for FEV1 together with age and height, it did significantly improve the explanatory power of the model while it did not for FVC. When within normal range, weight shows a positive correlation with vital capacity. In obese individuals, fat accumulated in the abdomen and chest wall presses against the chest, diaphragm, and lungs and, consequently, the correlation of weight with vital capacity becomes negative (26, 27). Because of its heterogeneous effects, weight can be an effective modifier when it is included in vital capacity prediction equations.
The mean of the predicted FEV1 values by the KNHANES II equation was 8.4% higher than that of the observed values for men and 6.1% higher for women. The mean of the predicted FVC by the KNHANES II equation values was also 8.6% and 6.5% higher than the mean observed for men and women, respectively. The differences between the predicted and observed means were larger for the KNHANES II equation than for the Japanese and American equations. Those differences for the new equation in the present study were minimal (less than ± 0.01%), and the mean squared difference (which represents model fit) was also lesser than that of any other regression model. These results indicate that our newly developed reference equations have a high goodness of fit in the Korean population.
Previous studies recommended using a race/ethnic adjustment factor of 0.94, assuming that normal predicted values of FEV1 and FVC for Asian-Americans would be approximately 6% lower than the predicted values for Caucasians in the US NHANSE III (3). Similarly, when the predicted FEV1 and FVC values of this study were compared with the predicted values for Caucasians in the US NHANSE III, FEV1 was 4.0% lower for men and 2.5% lower for women, and the FVC was 5.5% lower for men and 4.5% lower for women. The differences in the two predicted values were relatively large among age groups under 45 yr of age, and decreased as age increased. In contrast, the normal predicted values for KNHANES II were higher than the values obtained in this study and the US NHANES III data. In particular, in subjects of > 60 yr of age, the predicted FVC value of KNHANES II was noticeably increased relative to other predicted FVC values. These facts indicated that the KNHANES II equations overestimated normal FVC values in the elderly (20).
Although both the KNHANES II and IV reflected a national, representative, large-scale survey using the same model of spirometer, the estimated normal vital capacity in this study based on KNHANES IV was lower than that estimated using KNHANES II data. This discrepancy may have resulted from several methodological factors rather than an actual difference in the normal values of vital capacity. First, KNHANES II and IV used different repeatability criteria. KNHANES IV was applied to the recently updated 2005 ATS/ERS criteria for repeatability assessment, and improved the accuracy and quality of the spirometric data compared with KNHANES II that was based on the relatively lenient 1994 ATS guidelines. When updated limits for repeatability were applied in the KNHANES II, there was an approximately twofold increase in the frequency of invalid spirometric data (28). Secondly, the KNHANES IV survey was conducted during the whole year to control for seasonal variation of respiratory function, whereas KNHANES II was investigated only during the autumn and winter seasons. Although the spirometry tests of KNHANES II were performed during the seasons in which respiratory infections are more prevalent, more strict exclusion criteria were adapted. For example, individuals with a medical condition (such as cough, phlegm, common cold, fever, or other conditions) were not included in the analysis of KNHANES II (6). The differences in the exclusion criteria may at least partially explain the discrepancies between the reference values. Third, unlike KNHANES II, KNHANES IV did not exclude individuals with abnormal chest radiography findings because of lack of information. Similar to KNHANES IV, some previous studies such as those of Ip et al. (8), NHANES III (10), and Morris et al. (12), also did not exclude data from individuals with abnormal chest radiography. Although the spirometric reference values of KNHANES IV were derived from healthy-looking, lifelong nonsmokers without known respiratory diseases or symptoms, there is a possible underestimation resulting from the inclusion of spirometric data of individuals with respiratory diseases. That is a limitation of this study. Nevertheless, the reference equations derived in this study showed higher model fit than did the other reference equations. Our reference population based on representative data with enough sample size, and they well reflect for nutrition, health status and environmental conditions of contemporary Korean general population.
In conclusion, the new spirometry reference equations from KNHANES IV data are the most well represented pulmonary function of current Korean healthy adults. These reference values can be used as criteria for the interpretation of spirometry results and the diagnosis of respiratory diseases in Korean adults.

 XML Download