

 PDF
PDF ePub
ePub Citation
 Print
Print


INTRODUCTION
Vancomycin is commonly used to treat methicillin-resistant Staphylococcus aureus (MRSA) infection, and its use has increased with the prevalence of MRSA infection (1). Vancomycin has a narrow therapeutic range, and its concentration-effect and concentration-toxicity relationships are generally established. Therefore, it is appropriate that the therapy is guided by therapeutic drug monitoring (TDM) (2, 3). Vancomycin is primarily eliminated via the kidneys, and thus, renal function is an important factor in deciding the dosing regimen of vancomycin. Serum creatinine (SCr) concentrations have been widely used as markers for renal function. However, SCr concentrations may not accurately reflect the renal function in some patients such as elderly patients or those low muscle mass or myopathy. It leads to the overestimation of the glomerular filtration rate (GFR) represented by creatinine clearance, and the possibility of renal toxicity due to overdose would be increased in these cases (4, 5).
Cystatin C is a low-molecular-weight protein that is stably produced in the body and has been proposed as an alternative endogenous marker of glomerular filtration. It is the product of a housekeeping gene expressed in all nucleated cells and therefore exhibits a stable production rate, even in the presence of an acute inflammatory response (6, 7), irrespective of muscle mass, gender, and body weight. Thus, cystatin C has many of the characteristics of an ideal endogenous GFR marker. Recent investigations have indicated that cystatin C may be superior to SCr as a GFR marker (6). Vancomycin clearance (CL) is better correlated with cystatin C, especially in elderly or critically ill patients (8-10). Our previous study also found that vancomycin concentration was better correlated with serum cystatin C than serum creatinine concentration in elderly patients (11). Although data from a small number of patients in the previous study were also included in this study, the purpose and methods of these two studies are significantly different from each other. The previous study was for simple correlation between vancomycin concentrations and two biomarkers (creatinine and cystatin C) of renal function in elderly patients. On the basis of the results of our previous study, we could plan for this population pharmacokinetics (PK) modeling study using cystatin C in general patient population.
Although the role of cystatin C in vancomycin PK is established, no validated population PK model to describe the overall impact of cystatin C together with other demographic or clinical sources of variability of vancomycin PK is available. If an integrated model with high predictive performance is developed, a more valuable basis for selecting a dosing regimen would be available. One reported study described a population PK approach with cystatin C in Japanese patients; however, this study only included data from 78 patients and only trough concentrations, and analysis for other covariates and exact quantification of the cystatin C effect were limited (12). To develop an integrated model describing the effects of multiple factors and to clarify the precise impact of cystatin C, a sufficiently large population should be investigated. In addition, to avoid confounding effects and interactions between cystatin C and SCr, a population with normal SCr concentrations is optimal (≤ 1.2 mg/dL).
Therefore, the present study attempted to develop an assumption-free integrated population PK model of vancomycin to quantify the effects of various demographic factors including cystatin C on vancomycin PK by a nonlinear mixed effect modeling approach in a large population of 678 Korean patients with normal SCr concentrations.
MATERIALS AND METHODS
Subjects and collection of blood samples
All data were collected from patients receiving vancomycin at a single institution from June 2006 to May 2010. We included patients who were aged 18 yr or older and those whose SCr concentrations were equal or lower than 1.2 mg/dL. Vancomycin concentrations had reached steady state in most patients. Vancomycin was dispensed in 100 mL of saline per 1,000 mg and then intravenously infused over 1 hr. After vancomycin was administered more than three times, its concentration was measured. The blood samplings were performed just before the next infusion (trough) and 1 hr after completing the infusion of vancomycin (peak). Concentrations of SCr and cystatin C were measured on the same day with the vancomycin concentrations. Other clinical and demographic data were collected from the medical records of the recruited patients.
Assay of vancomycin, serum creatinine and cystatin C levels
The serum concentrations of vancomycin were determined using fluorescence polarization immunoassay methods (Cobas Integra 800 Analyzer, Roche, Mannheim, Germany). Serum creatinine concentrations were measured using Jaffe kinetic method (Hitach 7600, Hitach, Tokyo, Japan). Reference ranges of SCr are 0.6-1.0 mg/dL for female and 0.8-1.3 mg/dL for male. There had been no change in standardization during the study period.
Cystatin C concentrations were measured using particle enhanced immunoturbidimetric assay (Roche Cobas 6000, Roche, Mannheim, Germany). Human cystatin-C agglutinates with latex particles coated with anti-cystatin C antibodies (rabbit). The aggregate is determined turbidimetrically at 546 nm. Reference ranges of cystatin C are 0.57-0.97 mg/L for female and 0.65-1.10 mg/L for male.
Population Pharmacokinetics analysis
The population PK model was built using the first-order conditional estimation with interaction method of the nonlinear mixed-effects modeling program NONMEM® (Version 7.1.0, Icon Development Solutions, Ellicott City, MD, USA) with the gfortran compiler. One- or two-compartment models were compared, and several error models were investigated (i.e., proportional, exponential, and additive random-effects models) to describe residual variability.
The clinical and demographic variables analyzed as covariates for potential influence on vancomycin PK were age, sex, total body weight (TBW), height, serum cystatin C concentration, SCr, intensive care unit admission, and concomitant use of amikacin or furosemide. To screen the influence of covariates on parameter estimates, a graphic approach to exploratory data analysis and the generalized additive model (GAM) with the aid of Xpose4 were used (13). Potential covariates identified in the covariate screening step were then tested by stepwise forward selection and backward elimination using NONMEM and the PsN toolkit (14) on the criteria of the minimum objective function value (OFV; -2×the log likelihood function) with significance set at P < 0.01 (forward) and P < 0.001 (backward).
The final model was evaluated by goodness of fit plots between the predicted and observed values, performing a numerical predictive check (NPC) and a bootstrap analysis using the PsN toolkit. The NPC generated 1,000 simulated concentration sets according to the final model, calculated the percentage of observations lying outside of their prediction intervals, and compared the values with the expected number. The 95% confidence intervals for the expected number of observations lying outside their prediction intervals were also computed. The nonparametric bootstrap (15) analysis consisted of repeated 1,000 NONMEM runs with random sampling from the original data set. The bootstrap median parameter values and 95% percentile intervals were compared with those estimated from the original data set using the final model. The predictive performance was evaluated by the mean prediction error (MPE, prediction error = ([prediction-observation]/observation) and mean absolute prediction error (MAPE) of the population and individual predictions, which were measurements for bias and precision, respectively. The shrinkages of both empirical Bayes estimates (EBEs) and residual errors were calculated by 1-SD×(EBEs)/Intersubject variability, and 1-SD×individual weighted residual (IWRES), respectively.
Finally, given the estimated parameter, simulations were performed to describe the time course of the steady-state vancomycin concentration profiles following the administration of 1,000 mg of vancomycin q 12 hr according to various cystatin C concentrations (0.4-3.0 mg/L) in a patient group having typical demographic characteristics or representative low and high clearance (CL) groups to depict how the covariate changes contributed to the concentration profiles of vancomycin.
Ethics statement
This retrospective study was reviewed and approved by the institutional review board at Gangnam Severance Hospital of the Yonsei University Health System in Seoul, Korea (Reg. No. 3-2011-0106). The board waived the requirements to obtain informed consents. All procedures were conducted in accordance with the guidelines of the Declaration of Helsinki.
RESULTS
Clinical data description
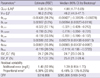
Patient characteristics are listed in Table 1. A total of 1,373 vancomycin concentration measurements in 678 patients were used to develop the model. The median vancomycin dosage was 2,000 mg/day, and most patients (89%) were treated with 1,000-2,000 mg/day.
Population PK modeling
Both one- and two-compartment models were applied. OFV was lower in the two-compartment model; however, the covariance step failed, and even minimization was terminated depending on the structure of intersubject variability (ISV) parameters. The parameter estimates were unrealistic for both the central and peripheral compartment volumes of distribution (36.5 and 210 L, respectively) regardless of error model, revealing overparameterization probably because most of the data consisted of only one peak and one trough concentration per patient. In addition, simpler structural model would be more desirable for covariate model analysis (16). Therefore, the one-compartment model with zero-order intravenous input and first-order elimination was assumed to adequately describe serum vancomycin concentrations.
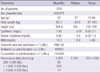
The numbers of potential covariates detected by GAM analysis were seven for CL and five for V (volume of distribution). Using these potential covariates, stepwise covariate model searching was performed by forward selection and backward elimination. The final model was described by five covariates (age, TBW, cystatin C, SCr, and sex) for CL and three covariates (age, TBW, and sex) for V. We considered the creatinine clearance (CLCR) calculated by the Cockcroft and Gault method as a covariate, but this did not significantly improve OFV. The Cockcroft and Gault method also has components of creatinine concentration and demographic data, and thus, we omitted this variable to avoid a redundant covariate model structure. Cystatin C was found to be the most influential covariate, and it decreased OFV by 428.3. The relationship with CL was better described by a power model, and the rest of the variables had linear relationships. The parameter values for the proposed final model are summarized in Table 2. In this model, the primary PK parameters, CL and V, are expressed as follows:
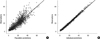
Compared to the base model, the estimated unexplained ISV of CL and V expressed as coefficients of variation (CVs) were reduced from 44.4% and 28.6% to 24.7% and 25.1%, respectively. When only cystatin C was used as a covariate in the model, unexplained ISV of CL was reduced to 31.1%. Plots of model-predicted versus observed concentrations based on population and individual parameter estimates of the final model are shown in Fig. 1. The residual error based goodness-of-fit plots (IWRES versus individual prediction, conditional weighted residual versus time, and others) were visually checked and acceptable (figure not shown). The shrinkage for EBEs and residual errors were as follows: shrinkage (EBE_CL) = 5.8%, shrinkage (EBE_V) = 17.3%, and shrinkage (IWRES) = 48.3%.
Model evaluation
The robustness of the final model was evaluated by a bootstrap analysis (1,000 replicates). The final parameter estimates and results of the bootstrap procedure are shown in Table 2. The population estimates of the final model were very close to the median of the nonparametric bootstrap replicates, and all estimates were included within the 95% confidence intervals. NPCs of the data exhibited good predictive performance with a slight overprediction at the upper limit of the 95th percentile prediction interval (Fig. 2). The population-predicted concentrations were unbiased, with an MPE of 4.6% and a precision (estimated by the MAPE) of 25.8%. Using individual predicted concentrations, the bias and precision were 0.1% and 5.9%, respectively.
Prediction of vancomycin concentration in various groups of patients
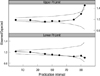
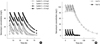
Predicted steady-state time-concentration profiles of vancomycin after 1,000 mg q 12 hr administrations were simulated using the final model in patients with normal SCr concentration (≤ 1.2 mg/dL) (Fig. 3). In patients with typical demographic characteristics (age = 57 yr, TBW = 60.8 kg, male, SCr = 0.8 mg/dL), the predicted vancomycin trough concentrations were 2.4-33.8 mg/L (14-fold) for cystatin C concentrations ranging from 0.4 to 3.0 mg/L. The trough and peak concentrations in the representative high-CL group (CL = 10.9 L/h and V = 45.7 L by age = 20 yr, TBW = 100 kg, male, cystatin C = 0.4 mg/L, and SCr = 0.6 mg/dL) were 0.4 and 18.7 mg/L, respectively, and those of the low-CL group (CL = 1.7 L/h and V = 41.8 L by age = 90 yr, TBW = 40 kg, female, cystatin C = 3.0 mg/L, and SCr = 1.2 mg/dL) were 85.2 and 107.1 mg/L, respectively, which were 213- and 5.7-fold changes, respectively, than those in the high-CL group. Even at the same cystatin C concentration of 3.0 mg/L, the low-CL group exhibited a 250% higher trough concentration (85.2 mg/L) than the typical population group (33.8 mg/L).
DISCUSSION
In this study, we developed an integrated population PK model of vancomycin that quantifies the cystatin C effect as well as significant demographic data in adult patients with normal SCr concentrations. The model indicates that cystatin C has a close relationship with vancomycin CL with an inverse power of -0.78. This reciprocal relationship has been reported previously for cystatin C and GFR (17, 18). Other continuous demographic variables centered on their populzation median values have linear relationships within the observed range. Age and SCr had negative and TBW had a positive relationship with CL. Females have 15% lower clearance, which is in line with the Cockcroft and Gault equation (19).
The influence of each continuous covariate on PK parameters was calculated by the maximum percent difference of the parameter using the marginal or median values from the equations of the final model. The order of the difference size was as follows: for CL, cystatin C (62%) > TBW (34%) > age (17%) > sex (15%) > SCr (13%); and for V, TBW (52%) > age (23%) > sex (12%). Cystatin C is the most influential factor for vancomycin CL and has an approximately 5-fold greater effect than SCr. TBW was also an important covariate for both CL and V. As only 33 patients (4.9%) were clinically obese (body mass index > 30 kg/m2), using ideal body weight or lean body weight instead of TBW in the population PK analysis did not improve the fitting significantly, which was consistent with other studies, and the actual TBW is usually recommended for dosage adjustment for vancomycin TDM (20). Simulation analysis indicated that a 14-fold difference in the trough concentrations (2.4-33.8 mg/L) of vancomycin was observed according to only cystatin C concentrations at the same dosage of vancomycin. Using other demographic factors together, our model could predict a wider range of trough concentrations of 0.4-85.2 (213-fold) in representative cases of high- or low-CL patients as expected.
There was good agreement between the predicted and observed values from a visual exploration. The predictive performance of the model, expressed as bias and precision, were less than 5 and 30%, respectively, in the population prediction. This is clinically acceptable considering the errors from assay and/or clinical procedures in routine care settings. The NPC failed only at the upper limit of the 95% interval. This means that in some cases, very high concentrations mainly consisting of peak concentrations were not predicted well. This is possibly due to the estimation problem regarding V by a one-compartmental model. ISV for V was also imprecisely estimated with a standard error of 37%. In these sparse data from routine clinical practice, V is generally not precisely estimated relative to CL estimation as reported previously (21, 22). Limited samples permit only one-compartment modeling, although two-compartment modeling is considered more realistic for vancomycin PK (23, 24). However, this model can provide results representative of the population studied because a large number of patients were analyzed. In addition, the treatment outcome of vancomycin is mainly correlated to vancomycin trough concentrations, and thus, we believe that the application of this model will be possible for routine clinical care with minor exceptions at very high concentrations.
The extent of the shrinkage of IWRES was moderate (48%), but it is considered acceptable because the observations consisted of sparse routine clinical data. The most problematic situation of the epsilon shrinkage is model misspecification (25). However, the impact of model misspecification was low because there was substantial evidence of one-compartmental analysis of vancomycin PK with routine TDM data, and the estimated values of PK parameters were similar to those of our model (12, 21, 26, 27). Moreover, there was similarity in the PK parameters across different ethnic groups. We believe that our results can be generalized to other ethnic groups, although confirmation is needed.
In linking the pharmacodynamics with the PK of vancomycin, an AUC24/MIC value of at least 400 was proposed for the treatment of invasive MRSA in vancomycin practice guidelines (20). The AUC24/MIC values of individual patients were obtained using the model with an estimated AUC24 (daily dose divided by CL) and an MIC of 1 mg/L. In total, 362 out of 678 patients (53.4%) had AUC24/MIC values above the target of 400. Trough concentrations (Ctrough) were also predicted, and the numbers of patients with Ctrough < 5, 5 - < 20, and ≥ 20 mg/L were 154 (22.7%), 465 (68.6%), and 59 (8.7%), respectively. In this post hoc analysis, when the Ctrough is higher than 10 mg/L (259 patients), the percentage of patients with AUC24/MIC ≥ 400 was 99.6% (258 out of 259). However, for patients with Ctrough of 5-10 mg/L, only 39.1% (101/265) of patients achieved the target AUC24/MIC, and thus, the possibility of treatment failure is increased in this concentration range. As a surrogate marker to predict the target AUC24/MIC, maintaining a Ctrough ≥ 10 mg/L would be proposed in this population.
This is the first study to analyze the actual effect of cystatin C by integrated population PK modeling of vancomycin with full evaluation of covariates in a large population. Modeling was done in assumption-free conditions: no GFR estimation, no calculated demographic factors, and no restriction to steady-state concentrations. All covariates had a direct relationship with each PK parameter. A large pool of data rendered the estimation errors very small for the population PK parameters and the effects of covariates, which were consistently observed in a nonparametric bootstrap analysis.
Our study has some limitations. First, the model has not been evaluated by external data. Although measuring vancomycin concentration itself at peak and trough is the best validated predictor of clinical response and toxicity, we believe the dosing guide using our model is applicable if it can reliably predict peak and trough concentrations and AUC24/MIC values before the initiation of therapy and thus lead to improved treatment outcomes. To accomplish this, the predictive performance of the model should be validated using an external dataset, and the treatment outcomes need to be confirmed. Second, the clinical utility of the model is limited. It is necessary to further study how well the AUC24/MIC values obtained through our model reflect the treatment outcome in patients with MRSA bacteremia using the real MIC values prospectively. It is also necessary to investigate the difference between the calculated AUC24 based on the conventional SCr value and our cystatin C model and clarify how these differences affect the determination of vancomycin dosage. Third, this model is focusing on the patients with SCr ≤ 1.2 mg/dL, so its utility to renal impairment patients outside this range (about 20% in our internal data) would be limited.
In conclusion, the population PK model of vancomycin in relation to cystatin C was developed for Korean patients. There was considerable variability in vancomycin concentrations even among normal SCr concentrations. Cystatin C concentrations reflect vancomycin CL better than SCr concentrations and play a major role in explaining this variability. Measuring cystatin C concentrations is recommended for the optimal dosage selection of vancomycin based upon our population PK model among patients with normal SCr concentrations. Furthermore, cystatin C would be a good marker for dose adjustment when TDM is performed for drugs that are excreted mainly by the kidneys, which needs to be confirmed clinically in a prospective study.
 XML Download