

 PDF
PDF ePub
ePub Citation
 Print
Print


INTRODUCTION
Cancer has been the leading cause of death in Korea since 1983 (1) and poses a major public health concern. Over 150,000 new cancer cases are diagnosed annually in Korea and one out of four deaths results from cancer (2, 3). This paper gives an overview of the nationwide cancer statistics, including the incidence, mortality, and survival rates, and their trends in Korea. This report is a part of Special Article series that presents the annually updated nationwide cancer statistics in Korea since 2009 (4).
MATERIALS AND METHODS
Data sources
The Korea Ministry of Health and Welfare started a nationwide, hospital-based cancer registry called the Korea Central Cancer Registry (KCCR) in 1980. Details of the history, objectives, and activities of the KCCR have been documented (5). Incidence data from 1999 to 2007 were obtained from the Korea National Cancer Incidence Database (KNCIDB). Cancer cases were classified according to the International Classification of Diseases for Oncology 3rd edition (6) and converted to the International Classification of Diseases 10th edition (ICD-10) (7). The survival analysis used 1,302,353 cancer cases first diagnosed during 1993-2007 from the KNCIDB, and followed vital status through 31 December 2008.
Mortality data from 1983 to 2007 were obtained from the Korea National Statistics Office (KNSO) (1). Cause of death was coded and classified according to the ICD-10. The population data were also obtained from KNSO using the resident registration population on 1 July each year.
Crude rates (CRs) and age-specific rates of cancer incidence and mortality were calculated. Age-standardized rates (ASRs) were determined using the World Health Organization (WHO) world standard population (8). The cumulative risks of cancer incidence, which are the probability of developing cancer to the life expectancy, were also calculated. Changes in the annual age-standardized cancer incidence rates were examined by calculating the annual percentage change (APC) over a time period as 100(e-1), where e is the slope of the regression of log age-standardized rates on a calendar year (9).
The survival duration of each case was determined as the time difference between the date of initial diagnosis and the date of death, date of loss to follow-up, or closing date for follow-up. Observed survival rates were calculated using a life table method and relative survival rates were examined with the Ederer II method (10) using an algorithm written in SAS by Paul Dickman (11), with some minor adaptations.
RESULTS AND DISCUSSION
Incidence
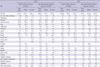
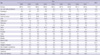
Table 1 presents the number of new cancer cases during 2006-2007 in Korea by sex and cancer site. 153,237 new cancer cases in 2006, 161,920 new cancer cases in 2007 were observed in Korea. The cumulative risks for developing a cancer to the life expectancy were 34.6%, 34.4% for men and 27.3%, 28.9% for women during 2006 and 2007, respectively.
Table 2 ranks cancer incidence by sex during 2006-2007. The CRs of all sites combined in 2006 were 334.7 and 292.1 per 100,000 in men and women, respectively, and the ASRs of all sites combined were 307.4 and 215.0 per 100,000. The CRs of all sites combined in 2007 were 346.2 and 312.8 per 100,000 in men and women, respectively, and the ASRs of all sites combined were 305.9 and 224.9 per 100,000. In males, the five leading primary sites of cancer were the stomach (CR 70.4, ASR 61.2), lung (CR 52.1, ASR 47.5), colon & rectum (CR 49.7, ASR 43.5), liver (CR 45.2, ASR 38.4), and prostate (CR 21.5, ASR 20.0), accounting for 69.0% of all newly diagnosed cancers in 2007. In females, the most common cancer sites were the thyroid (CR 73.5, ASR 55.6), breast (CR 47.4, ASR 34.7), stomach (CR 35.0, ASR 23.9), colon & rectum (CR 33.9, ASR 23.4), lung (CR 20.4, ASR 13.3), and liver (CR 15.4, ASR 10.7), accounting for 72.1% of all newly diagnosed cancers. Thyroid cancer alone accounts for 23.5% (18,019) of incident cases in women in 2007.
From the construction of a KNCIDB for 1999 onward to 2007, the completeness of the Korea Cancer Registry data has improved gradually. This might have contributed in part to the gradual overall increases in cancer incidence, especially among the elderly.
Mortality
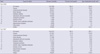
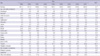
A total of 65,519 cancer deaths were reported in Korea, accounting for about 27.0% of all deaths in 2006 (Table 3). In 2007, cancer deaths (67,561 cases) account for 27.6% of all deaths. The CRs of all sites combined in 2006 were 170.7 and 97.1 per 100,000 for men and women, respectively, and the ASRs of all sites combined were 161.9 and 65.3 per 100,000. In 2007, the CRs of all sites combined were 173.7 and 101.1 per 100,000 for men and women, respectively, and the ASRs of all sites combined were 158.2 and 65.6 per 100,000. Cancers of the lung, liver, stomach and colon & rectum were the most common fatal cancers, which accounted for about 63% of all cancer deaths in 2007 (Table 4).
In men, the five leading primary cancer sites for mortality of the year of 2007 were the lung (CR 42.8, ASR 39.5), liver (CR 34.1, ASR 29.3), stomach (CR 27.9, ASR 25.3), colon & rectum (CR 15.2, ASR 14.0), and pancreas (CR 7.8, ASR 7.1). In women, lung cancer mortality (CR 15.2, ASR 9.4) has increased gradually, was the first cancer sites for mortality in 2007, following stomach (CR 15.0, ASR 9.3), colon & rectum (CR 11.7, ASR 7.3, liver (CR 11.2, ASR 7.5), and gallbladder (CR 7.1, ASR 4.3).
Trends in cancer incidence
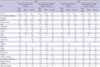
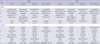
Table 5-1, 5-2, 5-3 show the trends in cancer incidence for all sites combined and for selected cancer sites. The incidence rate for all sites combined increased by 2.8% annually from 1999 to 2007. The incidence rate for all sites combined increased by 1.3% annually in men and by 4.7% in women from 1999 to 2007.
The incidence rates have continued to increase for colorectal and thyroid cancer in both sexes, along with breast cancer in females and prostate cancer in males. Stomach and lung cancer incidence rates plateaued in men and women, while the incidences of liver cancer in both sexes and the cervical cancer in women have decreased.
One notable aspect is the sharp increase (25.7% annually) in the incidence of female thyroid cancer. As diagnostic techniques for thyroid cancer have become more sensitive, such as the advent of ultrasound and fine-needle aspiration, the detection of subclinical disease has become possible. Therefore, the increased incidence of thyroid cancer might reflect improved diagnostic techniques for previously undetected disease, rather than a true increase in the occurrence of thyroid cancer (12, 13).
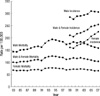
Trends in cancer mortality
Figs. 1, 2 show the trends in cancer deaths for all sites combined and for selected cancer sites. Age-standardized mortality rates have decreased for all sites combined in both sexes since 2002. Lung cancer surpassed stomach cancer as the leading cause of cancer death in 1999, and is expected to account for 21.1% of all cancer deaths in 2007. The age-standardized mortality rates of lung cancer has decreased slightly for men since 2001, but increased in women. The age-standardized mortality rates of stomach and cervix uteri cancer have decreased continuously. Along with the significant increases in colorectal, prostate and female breast cancer incidence, the mortality rates of these cancers have also continued to increase.
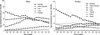
Age-specific incidence rates for selected cancer sites
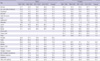
Table 6 presents the most common cancer sites by sex and age group in 2006-2007. Leukemia and thyroid were the most common forms in both sexes, for ages 0-14 and 15-34 yr, respectively. For males, stomach cancer was the most common in 35-64-yr-olds, while lung cancer was more frequent for those aged 65 and older. For females, the most common sites of cancer were the thyroid for the 35-64-yr-old. For the 65 and over age groups, colorectal cancer was the second common sites in 2006, was most common cancer sites in 2007.
Fig. 3 shows the age-specific incidence rates of the selected cancers for men and women in 2007. The data show that the incidence of stomach, lung, liver and colorectal cancers increased gradually with age. In women, the age-specific incidence rates of breast and thyroid cancer has increased with age until the forties and leveled off.
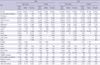
Survival rates
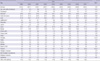
Table 7 shows the 5-yr relative survivals for four different periods: 1993-1995, 1996-2000, 2001-2005 and 2003-2007. Notable improvement has been made in the 5-yr relative survival rates for all cancer sites combined. The 5-yr survival in females appeared to be higher than in males, and this can be partly explained by the high frequency of cancers in females that are known to have relatively good prognoses (e.g., thyroid, breast and uterine cervix).
The 5-yr relative survival rates appeared to be higher for most major cancer sites in patients diagnosed during 2003-2007 compared to 1993-1995, except for cancers of the pancreas. The greatest improvements were seen in prostate cancer, stomach cancer, leukemia, non-Hodgkin's lymphoma. The improving survival rates could be attributable to early detection, as well as to improved treatments (14, 15), but this needs to be evaluated further. Lack of progress in early detection and treatment could explain the observed absence of improvement in the survival rate of pancreatic cancer (16).
 XML Download