

 PDF
PDF ePub
ePub Citation
 Print
Print


INTRODUCTION
Single nucleotide polymorphisms (SNPs) are highly abundant and are perceived as being more stable than microsatellite markers due to lower mutation rates. Recent technological advances in high-throughput genotyping have made it feasible to use SNPs for genome-wide association mapping. Although the number of reported SNPs is increasing rapidly, the density of markers may not be sufficient to allow association mapping of some loci. Microsatellite markers may serve as useful additional markers for mapping studies because their frequency in the genome and high heterozygosities potentially make them informative candidates for such studies, and the map density of microsatellite markers required for association mapping might be considerably less than that of SNPs (1-3). It has been suggested that the haplotypic relationship between microsatellite markers and SNPs is of considerable importance, as microsatellite markers can potentially be incorporated into haplotypes containing SNPs to increase marker density across a region of interest (4-6).
Haplotype variations consisting of both fast-evolving short tandem repeat polymorphisms and more slowly evolving markers such as SNPs, restriction-fragment length polymorphisms and insertion/deletion polymorphisms have been reported to be useful for the tracing of population migration and determining when mutation events occurred (7-10). However, these data have been derived from a relatively small number of markers at a limited selection of loci, and there was a report showing dramatic loss of linkage disequilibrium (LD) between SNPs and microsatellite markers across a very short physical distance in both African and non-African populations (4). SNPs and microsatellite markers have different mutation rates and durations, and it is conceivable that the LD patterns between the genetic markers may considerably differ. Therefore, we compared the LD patterns between the two genetic markers using 1,661 SNPs and 65 microsatellite markers along chromosome 22.
Many studies have found that the global LD patterns of common SNPs were remarkably similar even in populations that had different demographic histories (11-13). Consistently, the survey of microsatellite markers suggested that chromosome region-specific differences in LD patterns appear to be more important that the differences in intermarker LD between distinct populations (14). We first confirmed the similarities of the global LD patterns between the Korean and European populations for each genetic maker (11, 15). We next compared the LD patterns between SNPs and microsatellite markers and investigated whether common patterns of LD between the two genetic markers are deduced from the results.
MATERIALS AND METHODS
Selection of markers
We collected blood samples from 104 unrelated Korean individuals after obtaining informed consent. SNPs for genotyping were selected by walking along chromosome 22 in 8.7-kb steps through all available SNPs in dbSNP (NCBI dbSNP build number 119). All available SNPs were mapped onto the sequence of chromosome 22. DNA samples from the eight random individuals were screened for 4,021 SNPs on chromosome 22 using SNaPshot assays (AppliedBiosystems, Foster City, U.S.A.). Of 4,021 candidate SNPs assayed, 2,223 (55.3%) markers that demonstrated uniformly heterozygous or homozygous genotypes throughout the 16 chromosomes were excluded and 1,798 (44.7%) markers were verified to be polymorphic in one or more individuals.
Microsatellite markers from the deCODE map (15) were ordered by its genetic map, and the ordering corresponded with its physical map based on the Reference sequence of NCBI Build 34. We genotyped 66 microsatellite markers on 104 unrelated Korean DNA samples. The average spacing of markers is 430 kb (0.9 cM).
Genotyping and data checking
Genotyping of 1,798 SNPs was performed by primer extension of multiplex products with detection by matrix-assisted laser desorption ionization-time of flight (MALDI-TOF) mass spectrophotoscopy (Sequenom, San Diego, CA, U.S.A.) on 56 Korean DNA samples. We tested all SNPs for Hardy-Weinberg equilibrium (HWE) using the SAS Genetics program. As a result, 7.6% of 1,798 SNPs were rejected for the violation of HWE using a threshold of p<0.05. The final set of 1,661 SNPs had a median spacing of 20.75 kb and included 1,099 common markers that had minor allele frequencies ≥0.20. The complete list of analyzed SNPs can be found at: http://www.populationgenomics.or.kr/jkms2006.
We genotyped 66 fluorescently-labeled microsatellite markers from the deCODE set. Polymerase chain reaction (PCR) was done using standard conditions, and PCR products were detected by using the ABI PRISM® 3100 Genetic Analyzer (Applied Biosystems, Foster City, U.S.A.) and were analyzed by the GeneScan® and Genotyper® software version 3.7 (Applied Biosystems, Foster City, U.S.A.). All genotypes were independently double checked. One of the 66 microsatellite markers failed genotyping.
Pairwise measures and pattern of linkage disequilibrium along the chromosome 22
We calculated LD measures D' and γ2 for each pair of confirmed common biallelic markers (MAF ≥0.2), using the statistical program GOLD. To characterize a locally varying structure of LD and minimize non-biological fluctuations in the measures due to the distribution of markers unevenly spaced, we plotted the average values of D' and γ2, respectively, for all the SNP pairs whose physical distance ranged from 50 kb to 500 kb within 1.7-Mb windows, each slide consecutively and overlapped adjacently by 0.1 Mb along the whole chromosome 22 (11), keeping the number of pairs of markers in each window large (≥50).
Statistics and comparison of the LD patterns
To compare the LD patterns between the SNPs and microsatellite markers in a population, we calculated confidence limits by bootstrapping (1,000 replications) and considered that non-overlap of the error bars of the two groups implies a statistically significant difference. Confidence limits were determined by calculating the probability of the observed data for all possible values of D', from which an overall probability distribution was determined. The upper and lower bounds represent the 5% tails of the overall probability distribution.
The unrelated United Kingdom (U.K.) and Icelandic genotype data
We used genotype data for 1,260 SNP markers from 90 unrelated U.K. Caucasian DNAs, which were produced by the Chromosome 22 Group at the Sanger Institute (11), to compare the LD patterns among SNPs between the Korean and European populations. In the Sanger data sets, we updated the marker position by matching to and calibrating on the Reference Cluster IDs of NCBI dbSNP Build 119. As a result of updating the marker position, 26 of the previously reported 1,286 markers were withheld from the pairwise LD analysis.
In order to compare the LD patterns among microsatellite markers between the two populations, we obtained the Icelandic genotype data from deCODE Genetics after submitting a complete agreement form. We examined the LD patterns for 65 microsatellite markers of chromosome 22 from average 168 (range, 74-213) Icelandic founders. One marker (D22S1171), which was biallelic in the Icelandic founders, showed D' confidence limits ranging from 0 to 1 and was excluded from the further analysis.
Comparison of Icelandic families and founders
Samples of founders include more independent chromosomes, but less phase ambiguity exists in families. To evaluate whether the two approaches had an influence on the LD patterns among microsatellite markers, we calculated multiallelic D' values with a set of haplotypes constructed from the Icelandic family genotype data by the bootstrap and permutation using the Allegro and miLD Program (16), and compared the results with the D' values estimated by the EM algorithm in the Icelandic founders. The distinct change of the LD patterns between the two samples provides an indication of significant influences of phase information.
RESULTS
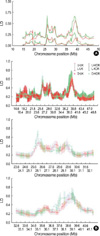
We assessed the LD patterns along the chromosome 22 by calculating average D' and γ2 for SNPs within sliding windows. The results highlight areas with very high levels of LD, notably at positions 25-30 Mb and 35-41 Mb of the reference sequence (Fig. 1A). The global patterns of LD along chromosome 22 were very similar in the Korean and unrelated U.K. populations. The regional difference of the LD patterns between the Korean and U.K. populations was examined by comparing the D' confidence limits within each sliding window. In the Korean samples, average D' levels are higher than those in U.K. samples at positions 25.9-26.1 Mb and 37.5-37.8 Mb, which are on the edge of the two longest tracts of high LD on the chromosome, presenting non-overlapping distinctions of the error bars of the two groups (Fig. 1B). We also found the regional differences at the similar positions in the Sanger data sets, including CEPH family and Estonian samples (11).
We assessed the LD patterns with 65 matched microsatellite markers used for the high-resolution recombination mapping in the Icelandic population. The LD values among SNPs showed relatively narrow confidence limits, and we could specify plausible values to within a tiny range. However, the patterns of LD among microsatellite markers varied considerably between juxtaposed regions with extended tracts of strong LD bordering areas of minimal LD showing wide ranges of D' confidence limits (Fig. 2C). We could not recognize a block-like pattern, in which extensive regions of high LD are interspersed with regions of little LD because the LD patterns among microsatellite markers are highly irregular.
To evaluate whether the phase ambiguity in Icelandic founders had a significant influence on these irregular LD patterns among microsatellite markers, we analyzed the D' values using haplotype data constructed from the Icelandic family genotype data and compared the results with the D' values estimated by the EM algorithm in the Icelandic founders. The LD values were consistent between the two samples (Fig. 2A), indicating usefulness of D' values estimated by the EM algorithm in unrelated samples for comparison of the LD patterns among microsatellite markers between the Korean and Icelandic populations. The general patterns of LD among microsatellite markers also appeared similar in the Korean and Icelandic populations (Fig. 2B, C).
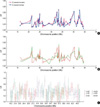
We next investigated the relationship between the LD patterns detected using SNPs and microsatellite markers. The regions, which showed consistently high (D' >0.60) or low (D' <0.20) levels of LD among microsatellite markers in both Icelandic and Korean populations, at positions 33 Mb and 26-30 Mb, respectively, did not correspond to those of SNPs (Fig. 3). These results imply that the LD runs of microsatellite and SNP markers show considerably different patterns.
DISCUSSION
These results demonstrate the patterns of LD among microsatellite markers vary considerably and the LD runs of SNPs and microsatellite markers show distinct patterns. There may be many disputes over technical and biological points on comparison of the LD patterns between different genetic markers. However, common patterns of the global LD were deduced from each genetic marker in distinct populations, and it appears to be valuable to compare the LD patterns between SNPs and microsatellite markers. We used unrelated Korean and Icelandic founder samples for analysis of LD patterns among microsatellite markers. To evaluate whether the phase ambiguity in the unrelated populations significantly influence on these irregular LD patterns among microsatellite markers, we analyzed the D' values using haplotype data constructed from the Icelandic family genotype data and compared the results with the D' values estimated by the EM algorithm in the Icelandic founders. The results showed no distinct difference of the LD patterns between the two samples. Therefore, we think that the irregular LD patterns among microsatellite markers might be due to the disruption of LD patterns by elevated rates and the evolutionary complexity of microsatellite mutations rather than the effect of phase ambiguity.
Most SNPs in modern humans probably arose by single base-modifying events that took place within single DNA molecules a long time ago, which corresponds to models underlying the decay of LD over time (17). By contrast, microsatellite markers have a much higher mutation rate, and the evolution of microsatellite markers is a more complex process (18), which has distinct mutation properties from those of SNPs, such as characteristic length changes in microsatellite DNA by replication slippage (19), mutation-rate heterogeneity (20), and directional biases in the mutation process (21). We consider that these might contribute to the different LD patterns between the two genetic markers.
The usefulness of mixed marker haplotypes in LD-based mapping is based on the assumption that LD between stable markers and microsatellite markers might be maintained over considerable genetic distance in non-African populations. In this study, the LD runs of SNPs and microsatellite markers showed distinct patterns. Therefore, it would seem inadvisable to make assumptions about persistence of LD across even a relatively small genetic distance among microsatellite markers and to construct mixed marker haplotypes/LD maps employing microsatellite markers without understanding of the local patterns of LD between two genetic markers at each locus.
 XML Download