

 PDF
PDF ePub
ePub Citation
 Print
Print


INTRODUCTION
Bronchial asthma is a chronic airway inflammatory disorder, characterized by airway infiltration of inflammatory cells such as eosinophils and T-lymphocytes, and progressive airflow obstruction (1). These cells are involved in a network of various cytokines (2) and contribute to bronchial hyperresponsiveness and structural changes (3). As a consequence, enhanced attention has been paid to the structural changes referred as airway remodeling (4-7) characterized by goblet cell hyperplasia/hypertrophy (8), subepithelial collagen deposition, and smooth muscle hyperplasia/hypertrophy. All these changes were responsible for airway wall thickening, which appears to be the basis of increased airway hyperresponsiveness (AHR) in chronic asthma (9). Recently, several animal studies were performed to clarify the relation between airway inflammation and remodeling, and furthermore their contribution to AHR in chronic asthma, despite the fact that the precise mechanisms and associations are unknown (10-15).
In the present study, we studied the kinetics of inflammatory cell infiltration, specific IgE, IgG1, IgG2a response, cytokine production in the airways, goblet cell hyperplasia, airway fibrosis, and their association with AHR during chronic (long time course) ovalbumin (OVA) challenge in sensitized mice.
MATERIALS AND METHODS
Animal model
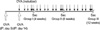
Specific pathogen-free female BALB/c mice were used as a chronic asthma model when they reached 7 weeks of age. The mice were housed in environmentally controlled specific-pathogen free conditions for 1 week prior to the study and during the experiments. All animal experimental protocols were approved by the Catholic University of Korea, Animal Subjects Committee. Mice were actively sensitized by intraperitoneal injections of 100 µg OVA (grade V; Sigma, St. Louis, MO) together with 500 µg aluminum hydroxide (Aldrich, Milwaukee, WI) in phosphate buffered saline (PBS) on day 0 and day 14. From day 21, they were exposed to aerosolized OVA (1% wt/vol diluted in sterile PBS) for 30 min twice weekly. Different groups of mice were studied according to the duration of antigen exposure: Group I (n=12), 4 weeks; Group II (n=12), 8 weeks; Group III (n=11), 12 weeks (Fig. 1). Control mice (n=8) were sensitized and then exposed to PBS in the same manner. Mice of each experimental group were then killed 24 hr after exposure to OVA or PBS aerosols for 3 consecutive days. The aerosol was generated from a nebulizer and was drawn into a dome shaped exposure chamber where restrained animals were distributed evenly and circumferentially.
Measurement of airway function
Before the mice were killed, airway responsiveness to methacholine was measured. To assess the airway responsiveness, we used a non-invasive whole body mouse plethysmograph (Allmedicus, An Yang, Korea) to measure a derived index named enhanced pause (Penh). Penh is a reasonable analogue of airway responsiveness to a non-specific inhaled stimulus, such as methacholine, which provides an accepted measure for comparison between the experimental groups.
Bronchoalveolar lavage fluid (BALF) preparation
After determination of airway responsiveness, the animals were killed for collection of BALF and histological examination. The right lung of each mouse was lavaged with 0.4 mL calcium- and magnesium-free PBS after the trachea was cannulated and the left bronchus was tied. This procedure was repeated three times (total volume; approximately 1.0 mL, recovery >80%). BALF from each animal was collected in a plastic tube and cooled on ice, and centrifuged (2,000 rpm) at 4℃ for 7 min. The supernatants of BALF in each experimental group were stored at -70℃ for determination of IL-13, IFN-gamma, pro-matrix metalloproteinase-9 (pro-MMP-9), tissue inhibitor of matrix metalloproteinase-1 (TIMP-1), and transforming growth factor-beta1 (TGF-beta1). Cell pellets were resuspended in PBS, stained with trypan blue, and the number of nucleated cells was counted in a hematocytometer. A differential count was made on a smear prepared with a cytocentrifuge and stained with Diff-Quik solution of at least 400 cells.
Measurement of OVA-specific IgE, IgG1, and IgG2a
Bloods from each experimental group were collected, and sera were obtained by centrifugation and stored at -70℃. OVA-specific IgE, IgG1, and IgG2a were determined by enzyme-linked immunosorbent assay (ELISA) as follows. One hundred microliters of OVA (100 µg/mL in PBS) was dispensed into each well of a 96-well flat microtiter plate and incubated overnight at 4℃. The antigen-coated plates were washed three times with 0.05% PBS-Tween 20 buffer (washing buffer) and incubated with mice sera overnight at 4℃. Plates were washed five times with washing buffer and incubated with antimouse IgE (Pharmingen, San Diego, CA, U.S.A.), IgG1 (Sigma, St. Louis, MO, U.S.A.), and IgG2a (Sigma, St. Louis, MO, U.S.A.) antibody overnight at 4℃. They were then washed further five times before adding citric acid-phosphate buffer containing 0.15 mg/mL of O-phenylenediamine (Sigma, St. Louis, MO, U.S.A.). Color was developed at room temperature, and the reaction was stopped with 2.5 M sulfuric acid, which was measured at 492 nm. The each antibody level was expressed as arbitrary unit (A.U.), which was a relative value based on the standard mouse serum that was sensitized and exposed to OVA in the same manner.
Measurement of cytokines in BALF
The amount of cytokine in the supernatant of BALF was measured using enzyme immunoassay (R&D Systems, Minneapolis, MN, U.S.A. for IL-13, IFN-gamma, pro-MMP-9, and TIMP-1, BioSource International, Camarillo, CA, U.S.A. for TGF-beta1). Each sample was measured according to the manufacturer's recommendations. The detection limit of each kit is 1.5 pg/mL for IL-13, 2 pg/mL for IFN-gamma, 8 pg/mL for pro-MMP-9, 2.1 pg/mL for TIMP-1, and 15.6 pg/mL for TGF-beta1.
Immunocytochemical staining for MMP-9 and TIMP-1
For immunocytochemistry of MMP-9 and TIMP-1, the cytocentrifuge preparations of BALF cells were fixed with 4% paraformaldehyde for 5 min and incubated sequentially in accordance with instructions for mouse MMP-9, TIMP-1 immunostaining kit (R&D Systems, Minneapolis, MN, U.S.A.). Briefly, detection was based on the formation of the avidin-biotin complex with primary antibodies that reacted with antigens. Visualization was based on enzymatic conversion of a chromogenic substrate 5-bromo-4-chloro-3'-indolyphosphate p-toluidine salt (BCIP) and nitro blue tetrazolium chloride (NBT) into a colored black-purple precipitate by alkaline phosphatase (AP) at the sites of antigen localization. After immunostaining, the slides were counterstained with Nuclear Fast Red (Vector Laboratories, Burlingame, CA, U.S.A.). For the control, BALF cells from mice were treated without the primary antibody, under the same condition.
Histological study
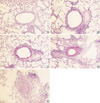
For each mouse, the left lung was removed and fixed in 4% paraformaldehyde and then embedded in paraffin. At that time, the left lung of each mouse was equally sectioned into three pieces from the apex of the lung. Hematoxylin and eosin stains were performed for general morphology, periodic acid-Schiff (PAS) stain for identification of goblet cells in the epithelium, Masson's trichrome stain for airway fibrosis, respectively. For the study, the bronchioles in which the total length of the epithelial basement membrane is 1.0-1.5 mm, were selected.
To quantify the goblet cell hyperplasia, we used the method described by Padrid et al. (16) with some modifications. Briefly, the pathological changes were evaluated according to the modified 5-point scoring system (grade 0-4) and were expressed by scores according to the percentage of the goblet cells in the epithelial cells: grade 0 (no goblet cells); grade 1, <25%; grade 2, 25-50%; grade 3, 51-75%; grade 4, >75%. The mean scores of goblet cell hyperplasia in each mouse were calculated.
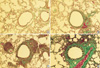
The areas of airway fibrosis beneath the epithelial basement membrane in the Masson's trichrome stained tissue sections were calculated using a Polaroid DMC1e digital microscope color camera (Polaroid Corporation, Cambridge, MA, U.S.A.) connected with computerized image analyzer program, Optimas (Media Cybernetics, Silver Spring, MD, U.S.A.). The mean areas of subepithelial fibrosis in each mouse were calculated.
RESULTS
Airway responsiveness
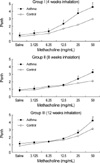
To investigate the relation with airway remodeling, AHR to methacholine was examined at each time point. Fig. 2 shows the dose response curve of airway responsiveness to methacholine. In each OVA-exposed asthma group, airway responsiveness to methacholine was significantly increased compared with control group. But there was no significant difference in AHR between the asthma groups.
Serum OVA-specific Immunoglobulins and BALF cytokines
The serum level of OVA-specific IgE was consistently increased in each asthma group exposed to OVA for 4, 8, and 12 weeks as compared with that of control mice. The peak level of OVA-specific IgE was reached at 4 weeks of OVA exposure, and after that, the level was significantly decreased according to the exposure duration.
All asthma groups produced detectable levels of OVA-specific IgG1 and IgG2a in serum, but there was no difference between the asthma groups. In control group, serum OVA-specific IgG1 and IgG2a were not detected.
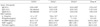
In BALF, the amount of a Th2 cytokine, IL-13 was significantly increased in all asthma groups compared with control group. In asthma groups, the peaked IL-13 level at 4 weeks was decreased at 8, 12 weeks according to the duration of antigen exposure. In contrast, the level of a Th1 cytokine, IFN-gamma showed no significant difference between control and asthma groups. The amount of pro-MMP-9 and TIMP-1 in BALF was significantly higher in asthma groups than in control mice throughout the experiment. In asthma groups, the pro-MMP-9 level was increased in time dependent manner and reached its peak at 12 weeks after exposure. In contrast, the TIMP-1 level in asthma groups showed no significant difference according to the duration of antigen exposure. The TGF-beta1 level in BALF was significantly higher in asthma groups than in control mice, and the level peaked at 4 weeks after exposure (Table 1).
Cellular response in BALF
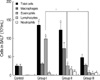
A significant increase in the total number of BALF cells from OVA challenged mice was observed in comparison with control mice (Fig. 3). The increase in total cell numbers was associated with a significant increase in eosinophils, lymphocytes and to a lesser degree, neutrophils throughout the experiments. The increased eosinophils in Group I were significantly decreased according to the duration of repeated OVA challenge in Group II and Group III.
Immunocytochemical staining for MMP-9 and TIMP-1
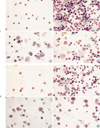
Compared with control mice, MMP-9 and TIMP-1 expressions were remarkable in all asthma groups. According to the morphological criteria, these expressions were observed in various kinds of cells including macrophages, eosinophils, neutrophils, and lymphocytes (Fig. 4).
Goblet cell hyperplasia
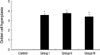
For the morphometric measurements of goblet cell hyperplasia, the average number of 25 (range: 23 to 27) airways were analyzed in each experimental group. The length of peribronchial basement membrane showed no significant differences in each experimental group; Control, Group I, Group II, and Group III (1.27±0.26 mm, 1.28±0.39 mm, 1.27±0.25 mm, and 1.28±0.24 mm, respectively). All asthma groups showed significant goblet cell hyperplasia compared with the control group detected with PAS staining (Fig. 5). All of the challenged mice but none of the controls demonstrated severe goblet cell hyperplasia, but there were no significant differences between asthma groups (Fig. 6).
Peribronchial fibrosis
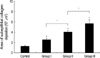
For the morphometric measurements of peribronchial fibrosis, the average number of 28 (range: 21 to 33) airways were analyzed in each experimental group. The length of peribronchial basement membrane showed no significant differences in each experimental group; Control, Group I, Group II, and Group III (1.26±0.27 mm, 1.26±0.28 mm, 1.26±0.21 mm, and 1.26±0.17 mm, respectively). All asthma groups showed significantly increased peribronchial fibrosis compared with the control group detected with Masson's trichrome staining (Fig. 7). In asthma groups, peribronchial fibrosis was significantly increased according to the duration of OVA exposure (Fig. 8).
DISCUSSION
Until now, methods to establish a animal model of bronchial asthma have been diverse because many laboratories performed different animal experiments according to the type and dose of antigen, duration of antigen exposure, route of antigen administration, the use of systemic sensitization, animal strain, and method of measuring AHR (10-15).
Human asthmatic airway shows chronic change, so called airway remodeling. However, most of the experimental animals for human asthma studies use an acute animal model, which lacks the airway remodeling characteristics of human chronic asthma. Recently, some animal researches used a chronic asthma model that resembled airway remodeling of human chronic asthma (10, 14). However, after chronic antigen exposure, the animal easily developed immune tolerance, and chronic asthma model was difficult to maintain for a long time (13, 17).
In this study, we established a clinically relevant experimental animal model that replicated most of the features of chronic human asthma. Furthermore, we could observe the time sequence of airway inflammation and remodeling as well as AHR from 4 to 12 weeks of allergen exposure. Various cytokines as well as inflammatory cells were related with airway inflammation and remodeling in a time-dependent manner in this study protocol.
Total inflammatory cell counts in BALF decreased after a prolonged exposure. In Group III, total inflammatory cell counts showed a significant decrease compared with Group I. The reason could be thought that generally, not acute but chronic inflammation tends to decrease the number of inflammatory cells. The eosinophils in BALF also decreased after prolonged exposure, but the neutrophils and the lymphocytes increased gradually which showed that chronic exposure of antigen was associated with the increased lymphocytes and neutrophils. Therefore, it might be thought that neutrophils and lymphocytes as well as eosinophils are involved in chronic allergic airway inflammation. Kamath et al. (18) suggested the important role of neutrophils in the allergic airway inflammations, and presented data that supported the current renewed interest in the neutrophil as a primary driver of airway inflammation, particularly in the most severe forms of asthma. Further studies, especially the principal drivers of neutrophil influx into asthmatic airways, the quantification of neutrophil trafficking, and its therapeutic applications would be needed more on the exact role of neutrophils (18, 19). In the present study, the eosinophils in BALF were decreased significantly after a prolonged exposure, but the AHR was maintained, suggesting that eosinophils were not the only effecter cells, but neutrophils, lymphocytes, and other factors might have been involved in the AHR.
OVA-specific IgG1 and IgG2a were significantly increased in the asthma groups compared with the control group, which suggested that the Th1 immune response as well as the Th2 immune response were involved in allergic inflammation. These results were similar to those of mouse asthma model by Tanaka et al. (20), in which IgG1 showed a significant increase and IgG2a showed an increased tendency compared with control mice.
The Th2 cytokine IL-13 in BALF was increased in all asthma groups compared with the control group, and after a peak level at the 4 weeks exposure, it decreased gradually at the 8 and 12 weeks exposure, which was reverse with the degree of peribronchial fibrosis.
Goblet cell hyperplasia developed remarkably as early as 4 weeks of OVA exposure, and was maintained in the same potency to 12 weeks of OVA exposure. However, peribronchial fibrosis occurred only mildly in 4 weeks of OVA exposure, although it progressed severely in a time-dependent manner. Goblet cell hyperplasia and peribronchial fibrosis are the main components of airway remodeling, but each expressed different patterns in a time-dependent manner. In the pathogenesis of airway mucus hypersecretion, Morcillo et al. (21) reviewed that a distinct mucus hypersecretory phenotype may be present in asthma. Overexpression of MUC5AC, MUC5B and Muc2 has been associated in asthma secretions. Activation of epidermal growth factor receptor appears to be the central part in transducing many different stimuli, including oxidative stress, proteases and T-helper-2 derived cytokines such as IL-4, IL-5, IL-9, and IL-13. Among the T-helper-2 derived cytokines, IL-13 is probably the primary regulator of mucus hyperplasia in vivo (22). In contrast to airway mucus hypersecretion, collagen I, III, and V; fibronectin; and tenascin-C are deposited in the pathogenesis of peribronchial fibrosis. Extensive evidence supports the pivotal role of IL-4 and IL-13 in peribronchial fibrosis; however the precise mechanism remains unclear (23). Therefore, it might be thought that goblet cell hyperplasia and peribronchial fibrosis could have different expressive patterns according to the time sequence due to their different pathogenesis.
AHR was continuously noted from 4 weeks to 12 weeks of OVA exposure, but it did not progress after repeated OVA exposure. Furthermore, at 8 or 12 weeks of OVA exposure, it did not show a significant difference in some of methacholine concentrations compared with the control group. Thus, we could know that further increase of peribronchial fibrosis did not contribute to further increase of AHR, at least in this model. We could suggest several possible mechanisms underlying this discordance between AHR and peribronchial fibrosis. First, AHR was developed by diverse relationships such as inflammatory cells including the eosinophils, the cytokine balance, the components of airway remodeling including bronchial epithelium, submucosal changes, smooth muscle hyperplasia/hypertrophy, angiogenesis. Thus, AHR could not be determined by only one element among them. Second, according to the study of Palmans et al. (24) with Brown Norway rat, airway fibrosis increased in a time-dependent manner, but AHR was abolished at 12 weeks exposure. They suggested that airway fibrosis could have made thinner airway thickness, which led to decreased AHR.
In this study, Pro-MMP-9 and TIMP-1 in BALF were also increased in the asthma groups compared with the control group, which was consistent in other human and animal asthma studies, suggesting that both MMP-9 and TIMP-1 contribute to tissue remodeling (25-29). The balance between MMP-9 and TIMP-1 may be critical in extracellular matrix remodeling. An excess of TIMP-1 over MMP-9 has been associated with chronic airflow obstruction, but the mechanisms underlying this association remain unknown. In this experiment, as the peribronchial fibrosis progressed, TIMP-1 levels were maintained relatively constant, but pro-MMP-9 showed a further increase due to the prolonged antigen inhalation. This result could be explained by the previous report of Cho et al. (30) that they showed MMP-9 and TIMP-1 had different expression patterns according to the source of anatomical sites in the remodeled airway. MMP-9 but not TIMP-1, was expressed in airway epithelium, whereas both MMP-9 and TIMP-1 were expressed in peribronchial inflammatory cells. In this experiment, we examined MMP-9 and TIMP-1 levels in BALF that manifested mostly the airway epithelium, the main source of MMP-9 but not of TIMP-1. In addition, we measured pro-MMP-9 levels, which could not display the active form of MMP-9.
In conclusion, we established a mouse model of chronic asthma that maintained the airway and systemic inflammation for 12 weeks, which may contribute to the development of airway remodeling. Chronic inflammatory cells, IgE, Th1 and Th2 cytokines, MMP-9 and TIMP-1 were involved continuously with different-time dependent manners. Airway hyperresponsiveness could not be determined with a single factor such as peribronchial fibrosis.
 XML Download