

 PDF
PDF ePub
ePub Citation
 Print
Print


INTRODUCTION
Recently, World Health Organization (WHO) regarded injury as the most important health problem and proposed a new classification system for injury surveillance. Traditionally, injury data have been represented by using the external cause codes of the International Classification of Disease (ICD). For more than two decades, however, experts have argued that the ICD codes lack the scope and specificity for effective information for injury prevention and control activities. To overcome these limitations, WHO proposed the International Classification of External Causes of Injuries (ICECI), a new injury surveillance system that aims to collect systematic information, to approach related factors, and to control and prevent injury. Many pilot studies have been performed to evaluate the validity of the ICECI according to this new guideline (1). The characteristic of the ICECI is that it was designed for an easy collection of information on the location, activities, drug or alcohol intoxication, intent, and the mechanism of injury (2). In 1999, the Center for Disease Control and Prevention (CDC) of the U.S.A. developed a short version of ICECI which was modified to be used at the emergency department (3). The short version of ICECI was based on the ICD-10th version injury mortality framework, and its efficacy and usefulness were evaluated as an injury surveillance system (4). However, there has been little concern about the new injury surveillance system in Korea because the ICD-10th version has been dominated for injury surveillance as ever.
According to the formal reports by the Korean government, the incidence and mortality rate by motor vehicle injury have decreased year by year, but the mortality rate by poisoning has remained unchanged. Poisoning is the representative fatal injury occurring by accident or intentional suicide. In particular, the economic crisis in 1997 in Korea provoked the high incidence of suicidal poisoning attempts, which have been considered to be the most important health problem. Until now, most studies on poisoning had limitations in that they were based on a hospital level, focused on clinical manifestations or the distribution of toxic agents (5-8), and did not reflect the national tendency and the longitudinal trend. Because of these limitations, the magnitude of the death by poisoning, the proportion of suicidal attempt, and major fatal agents were not fully evaluated, which led many clinicians to depend on the foreign data in the emergency situations.
We investigated the distributions and changes of external causes of death by injuries, the epidemiologic characteristics of death by poisoning, and the effects of socioeconomic factors on suicidal poisoning, based on the new injury surveillance system such as the ICECI.
MATERIALS AND METHODS
Materials
Death cases by injury that had been registered on National Death Certificates from 1991 to 2001 were included in this study. The death cases were coded with initial letters, V, W, X, and Y based on the ICD-10th version.
Methods
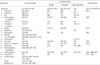
All death cases were recoded based on the short version of ICECI. The short version of ICECI is the modified ICECI system that CDC proposed. It was designed to recode the external causes of injuries based on the ICD-10 (Table 1) (9). According to the intent, all external causes of injuries were divided into three categories, accidental, intentional, and undetermined. Intentional injuries are also divided into the three groups, that is, suicide, homicide, and legal intervention or war. According to the injury mechanism, all external causes of injuries were also divided into 16 categories: cut/pierce, drowning, fall, fire/hot object or substance, firearm, machinery, all transport, natural/environmental, overexertion, poisoning, struck by or against, suffocation, other specified to be classifiable, other specified not to be classifiable, unspecified, and adverse effect by drugs or medical care.
We evaluated the mortality rate of injury by year, gender, age, and external cause. We also investigated the changes of the yearly incidence and the mortality rate by five major external causes. The mortality rate was estimated by the direct standardization based on the national population.
The proportion and the mortality rate of death by poisoning were estimated by year and 5-yr age interval. The mortality rates caused by major toxic agents were evaluated according to gender and age. They were also analyzed yearly and monthly according to the intent. Major toxic agents were classified into five categories; herbicides and pesticides, toxic gases such as carbon monoxide (CO) or cyanide (CN), chemical materials such as acids or alkali, clinical drugs, and unknown toxic agents.
The distribution of the death by suicidal or other poisoning was evaluated by socioeconomic factors such as educational attainment, region, marital status, and job from 1993 to 2001. The effects of socioeconomic factors on the death by suicidal poisoning was also evaluated.
Statistical methods
The descriptive statistics were estimated by the SAS system for Windows V8, and the socioeconomic gradients were tested by using the multivariate logistic regression analysis. In model 1, adjusted odds ratio (OR) and 95% confidence interval (95% CI) of suicidal poisoning were estimated for age and gender. In model 2, OR and 95% CI were adjusted for other factors as well as age and gender.
RESULTS
The longitudinal trends of the death by external causes of injuries and poisoning
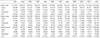
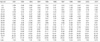
Table 2 shows the distribution and the proportion of death by external causes of injuries and poisoning from 1991 to 2001. The total number of death cases was 2,613,283. Among these, death cases of male and female were 1,473,802 and 1,139,489, respectively. Death cases by external causes of injuries were 346,656 (13.27%) and the proportion of male (17.11%) was much higher than that of female (8.30%). The proportion of death by external causes of injuries was 13.53% in 1991, 14.46% in 1996, and decreased to 11.73% in 2000, and 11.89% in 2001, respectively. Meanwhile, the number of death cases by poisoning was 40,150 (11.58% of total death cases by external causes) which included 26,104 (10.35%) male and 14,046 (14.86%) female cases, respectively. This trend showed that the proportion of death by poisoning was higher in female than in male, although the absolute total number of death cases by external causes of injuries was higher in male than in female. The longitudinal trend of death by poisoning showed that there was a decreasing tendency from 1991 to 1996, but an increasing tendency since 1997 in both genders.
The mortality rate by intent and its longitudinal trend
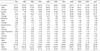
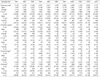
Table 3 shows the mortality rate by intent, year, and gender. The mortality rate per 100,000 by accidental injury was 57.01 in 1991, 89.64 in 1995, and decreased to 39.68 in 2001. The mortality rate in male was 85.90 in 1991 and decreased to 55.22 in 2001, while that in female was 27.91 in 1991 and 24.03 in 2001. The mortality rate has continuously increased in suicidal death from 1991 to 2001. Table 4 shows the mortality rate by the mechanism of injury. The mortality rates per 100,000 in five major categories were 33.27 in all transport, 8.69 in poisoning, 6.50 in fall, 6.52 in suffocation, and 5.04 in drowning. The longitudinal trend shows that the mortality rates due to all transport and drowning have decreased, while those due to poisoning, fall, and suffocation have steadily increased.
The magnitude and the mortality rate of poisoning
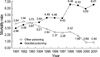
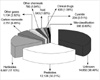
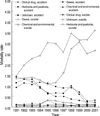
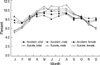
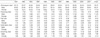
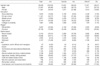
Table 5 represents the mortality rate of poisoning by year and age. The mortality rate by poisoning reached a peak in 1998, and then remained stable. As to age, the mortality rate was less than 1.00 below 14 yr, 9.01 in 40-44 yr, and increased to 21.30 in 60-64 yr. Fig. 1 shows the mortality rate due to poisoning by intent and year. Two lines showing the mortality rate by suicidal poisoning and other poisoning are crossing in 1993 and the mortality rate by suicidal poisoning increased rapidly thereafter. Table 6 shows the mortality rates of major toxic agents by intent and gender. Fig. 2 shows the proportion of major toxic agents causing the deaths. Herbicides and pesticides occupied the largest proportion of the death cases by all poisoning. The total number of death cases by herbicides and pesticides poisoning was 1,064 (33.85%) in 1991, 1,879 (55.61%) in 1996, and slightly decreased to 2,126 (50.90%) in 2001. Toxic gases such as CO or CN, chemicals, and clinical drugs occupied 9.77%, 4.05%, and 1.58%, respectively. Unknown toxic agents occupied a large portion of toxic agents which were 37.89% in 1991, 23.21% in 1995, and 40.75% in 2001. Fig. 3 shows the longitudinal trend of the mortality rate by accidental poisoning and suicidal poisoning. Year by year, the mortality rates by suicidal poisoning using herbicides, pesticides or unknown toxic agents continuously increased, while the mortality rate by accidental poisoning steadily decreased. The proportion of suicidal poisoning changed from an increase in summer to a decrease in winter, which was different from that of accidental poisoning (Fig. 4).
The socioeconomic gradients of death by suicidal poisoning
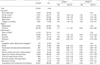
The socioeconomic gradients of death by suicidal poisoning were measured by using death cases from 1993 to 2001. Table 7 shows the distribution of death by poisoning by gender, educational attainment, region, marital status, and job. The death proportion by suicidal poisoning was about twice higher than that of other poisonings. When we compared the suicidal poisoning with other poisonings, the ratio was 21.85% versus 11.92% in the primary school group, and 49.03% versus 25.95% in the province group. Table 8 shows the results of the logistic regression analysis. There were significant differences between the higher education attainment groups and the lowest one, between the metropolitan group and the province group, and between the never-married group and the other marital status groups in model 2, which was adjusted for all socioeconomic factors as well as age and gender. However, there was no significant difference by jobs. When we compared the suicidal poisoning with other poisonings in model 2, adjusted odds ratio was estimated at 1.49 (95% confidence interval: 1.34-1.64) in the high school group versus the never-attainment group, 0.92 (95% confidence interval: 0.87-0.98) in the province group versus the metropolitan group, and 1.12 (95% confidence interval 1.05-1.35) in the divorced group versus the never-married group.
DISCUSSION
There are some limitations and merits of reclassification based on the short version of ICECI. The most important point for the application of the short version of ICECI is whether or not the National Death Certificates database has the validity and reliability in recoding the database with the new injury surveillance system. The Death Certificates database has been based on medical death certificates recorded by licensed doctors. However, the coding structure of the external causes of injuries was so complicated that doctors usually had a difficulty in selecting the diagnosis code. Although the validity and the reliability should be tested prior to use of the database, we assumed that its validity and reliability were appropriate.
Only 32,660 cases (9.42%) of all death cases were not classified into the new injury mechanism based on the short version of ICECI. Similarly, only 893 cases (0.26%) were not classified into the new injury surveillance system in reclassification by intent. These results suggest that it is not difficult to apply the short version of ICECI for the classification of the Death Certificates database.
The gender difference in the total death by injury revealed that the total death cases in male were about twice more than those in female, while the gender difference in death by poisoning showed rather a higher mortality rate in female (14.86%) than in male (10.35%). In addition, the longitudinal trend from 1991 to 2001 showed that the mortality rate in male decreased by 35% because of a rapid decrease of transport injury, while the rate decreased by only 13% in female due to the increasing tendency of increasing poisoning or fall. The mortality rate per 100,000 of total injury, accidental injury, and suicidal injury in Korea in 2000 was 60.8, 41.8, and 13.6, respectively, and these were higher than 53.8, 35.6, and 10.7 in the U.S.A., respectively (10). In 1994, the total number of death cases by poisoning was 16,527 in the U.S.A. compared to 3,331 in Korea (11).
Especially, the longitudinal trend showed that accidental injury has decreased, whereas suicidal injury has increased with a peak in 1998, which was a period of the economic crisis. The mortality rate by poisoning also reached a peak in 1998 in both genders, and the suicidal poisoning has increased steadily year by year, but the accidental poisoning has decreased, reversely. These findings might have been caused by the high unemployment rate or divorce rate symbolizing the family disorganization after the economic crisis. However, we did not evaluate these factors. Further studies are needed to analyze the related factors.
According to a report by American Association of Poison Control Centers (AAPCC) on the toxic agents to causing deaths in the U.S.A., major toxic agents were clinical drugs such as psychotic drugs, NSAIDs, and narcotics, which covered 34% of all death cases by poisoning (12). In our study, however, herbicides and pesticides were the most important agents and toxic inhalation gases were the second important agents. This could be explained by the international discrepancy in socioeconomic environments. The rapid decrease in the mortality rate due to inhalation of toxic gases from 1991 (22.65%) to 2001 (3.81%) seems to be associated with the environmental changes such as the reduced use of briquet at home. This study showed that clinical drugs or chemicals were less responsible for death by poisoning than unknown drugs. Considering the high proportion of the unknown drugs for the death by poisoning, it seems to be meaningless to compare directly the proportion of fatal toxic agents among nations.
According to the annual report by the AAPCC, the proportion of intentional poisoning was 50-60% from 1983 to 1999 (13). The National Center for Health Statistics (NCHC) reported the number of death cases by intentional poisoning was 5,322 (32.20%) in 1994. On the other hand, the proportion of suicidal poisoning was 64.43% in our study.
The monthly differences were observed in suicidal poisoning and other poisonings. This can be explained by the seasonal accessibility to herbicides or pesticides. In summer, those toxic agents could be easily accessible by the victims in Korea.
By the logistic regression analysis, the suicidal poisoning increased more in the high education attainment group, in the metropolitan group, and in the divorced group. On the other hand, There was no significant difference by jobs. The reason why there was no significant difference among jobs would be the characteristics of the socioeconomic factors. The job is a fixed factor that does not reflect the change of individual status, different from such as divorcing. Losing or getting a job will reflect a more important aspect in analyzing the socioeconomic effect than the job itself. The adjustment for direct variables such as income, the longitudinal changes, and socioeconomic status of the household level should be considered first to evaluate the influence of socioeconomic factors on suicidal poisoning (14).
 XML Download