

 PDF
PDF ePub
ePub Citation
 Print
Print


Abstract
Background:
In vitro serum allergen-specific IgE tests have been routinely used in the clinical diagnosis of allergic diseases. We evaluated the clinical usefulness of a newly introduced multiple antigen screen test, Advansure Allergy Screen (LG Life Science, Korea) (LG-Screen) for the detection of allergen specific IgE.
Methods:
A total of 180 sera (80 for inhalant and 100 for food panels) were tested by LG-Screen and RIDA Allergy Screen (R-biopharm, Germany) (RIDA-Screen) assays. According to the 58-60 specific allergens or allergen groups, the positive rates and agreement rates were analyzed using the cut off levels of class 2. For the quantitation of total IgE and specific IgE, nephelometry and ImmunoCAP test were performed in the sera showing discrepant results between the two allergy screen assays.
Results:
The agreement rate and kappa value (k) of total IgE between the two allergy screen assays was 73.9% and 0.333. LG-Screen showed higher agreement rate with nephelometry than RIDA-Screen. The positive rates to common outdoor inhalant and food allergens were significantly higher in RIDA-Screen. Overall agreement rate of specific IgE between the two allergy screen assays for 58 allergens was 86.7% (6,086/7,020) (k, 0.293). In samples showing discrepant results between the two allergy screen assays, concordance rate of allergy screen assay with ImmunoCAP assay was 70.9% (449/633) for LG-Screen (k, 0.585) and 29.1% (184/633) for RIDA-Screen (k, −0.303).
REFERENCES
1.Hamilton RG. Clinical laboratory assessment of immediate-type hypersensitivity. J Allergy Clin Immunol. 2010. 125:S284–96.

2.Cox L., Williams B., Sicherer S., Oppenheimer J., Sher L., Hamilton R, et al. Pearls and pitfalls of allergy diagnostic testing: report from the American College of Allergy, Asthma and Immunology/American Academy of Allergy, Asthma and Immunology Specific IgE Test Task Force. Ann Allergy Asthma Immunol. 2008. 101:580–92.
3.Steckelbroeck S., Ballmer-Weber BK., Vieths S. Potential, pitfalls, and prospects of food allergy diagnostics with recombinant allergens or synthetic sequential epitopes. J Allergy Clin Immunol. 2008. 121:1323–30.
4.Lim HS., Kim HS., Oh H. Current status of serum allergen tests in Korea. Korean J Lab Med. 2008. 28:124–9. (임환섭, 김현수, 오흥범. 국내혈청 알레르기 항원 검사법의 현황. Korean J Lab Med 2008;28:124-9.).
5.CLSI. Analytical performance characteristics and clinical utility of immunological assays for human immunoglobulin E (IgE) antibodies and defined allergen specificities: approved guideline. CLSI document I/LA20-A2. 2nd ed.Wayne, PA: Clinical and Laboratory Standards Institute;2009.
6.Park DS., Cho JH., Lee KE., Ko OS., Kim HR., Choi SI, et al. Detection rate of allergen-specific IgE by multiple antigen siumltaneous test-immunoblot assay. Korean J Lab Med. 2004. 24:131–8. (박도심, 조지현, 이기은, 고옥순, 김학렬, 최삼임 등. Multiple Antigen Simultaneous Test-Immunoblot법을 이용한 알러젠 특이항체 검출. 대한진단 검사의학회지 2004;24:131-8.).
7.Jang WR., Nahm CH., Kim JH., Lim DH., Jang TY., Moon YS, et al. Allergen specific IgE measurement with Polycheck Allergy: comparison of three multiple allergen simultaneous tests. Korean J Lab Med. 2009. 29:465–72. (장우리, 남정현, 김정희, 임대현, 장태영, 문연숙 등. Polycheck Allergy를 이용한 알레르겐 특이 IgE 측정: 세 가지 다중 알레르겐 항원 검사법의 비교. Korean J Lab Med 2009;29:465-72.).
8.Park CH., Kwon YE., Kim DI., Kwon HS., Sohn SW., Park HW, et al. Comparative evaluation of GENEDIA-ELISA assay and MAST-Immunoblot (RIDASCREEN) assay for detecting allergen-specific IgE against 16 common inhalant allergens in Korea. J Asthma Allergy Clin Immunol. 2007. 27:26–32. (박창한, 권용은, 김덕인, 권혁수, 손성욱, 박흥우 등. 알레르기 환자에서 한국의 대표적 흡입성 항원 16종의 특이 IgE 측정: GENEDIA-ELISA (Genedia Inhalant Allergen ELISA)법과 MAST-Immunoblot (RIDASCREEN)법 결과 비교. 천식및알레르기 2007;27:26-32.).
9.Kim TB., Kim KM., Kim SH., Kang HR., Chang YS., Kim CW, et al. Sensitization rates for inhalant allergens in Korea; a multi-center study. J Asthma Allergy Clin Immunol. 2003. 23:483–93. (김태범, 김경묵, 김세훈, 강혜련, 장윤석, 김철우 등. 흡입 알레르겐에 대한 감작율: 다기관 공동연구. 천식및알레르기 2003;23:483-93.).
10.Kim KE., Jeoung BJ., Lee KY. The incidence and principal foods of food allergy in children with asthma. Pediatr Allergy Respir Dis. 1995. 5:96–106. (김규언, 정병주, 이기영. 소아 천식환자에서 식품알레르기의 빈도 및 원인 식품. 소아알레르기및호흡기학회지 1995;5:96-106.).
11.Williams P., Sewell WA., Bunn C., Pumphrey R., Read G., Jolles S. Clinical immunology review series: an approach to the use of the immunology laboratory in the diagnosis of clinical allergy. Clin Exp Immunol. 2008. 153:10–8.
12.Gendo K., Larson EB. Evidence-based diagnostic strategies for evaluating suspected allergic rhinitis. Ann Intern Med. 2004. 140:278–89.
13.Sampson HA., Ho DG. Relationship between food-specific IgE concentrations and the risk of positive food challenges in children and adolescents. J Allergy Clin Immunol. 1997. 100:444–51.
14.Oh JW., Lee HB., Lee JS. A comparative study of the diagnostic characteristics of MAST assay and UniCAP system for food allergy. Pediatr Allergy Respir Dis. 2003. 13:72–80. (오재원, 이하백, 이준성. 피부단자시험을 기준으로 한 시험관내 집먼지진드기와 식품 알레르겐특이 IgE 항체 측정 방법의 효용성 비교. 소아알레르기및호흡기학회지 2003;13:72-80.).
15.Ricci G., Capelli M., Miniero R., Menna G., Zannarini L., Dillon P, et al. A comparison of different allergometric tests, skin prick test, Pharmacia UniCAP and ADVIA Centaur, for diagnosis of allergic diseases in children. Allergy. 2003. 58:38–45.
16.Williams PB., Barnes JH., Szeinbach SL., Sullivan TJ. Analytic precision and accuracy of commercial immunoassays for specific IgE: establishing a standard. J Allergy Clin Immunol. 2000. 105:1221–30.
17.Feinstein AR., Cicchetti DV. High agreement but low kappa: I. The problems of two paradoxes. J Clin Epidemiol. 1990. 43:543–9.
18.Ahlstedt S., Murray CS. In vitro diagnosis of allergy: how to interpret IgE antibody results in clinical practice. Prim Care Respir J. 2006. 15:228–36.
19.Jenkins JA., Griffiths-Jones S., Shewry PR., Breiteneder H., Mills EN. Structural relatedness of plant food allergens with specific reference to cross-reactive allergens: an in silico analysis. J Allergy Clin Immunol. 2005. 115:163–70.
20.Weber RW. Patterns of pollen cross-allergenicity. J Allergy Clin Immunol. 2003. 112:229–39.
Fig. 1.
Quantitative results of total IgE in 34 sera showing discrepant results between the two allergy screen assays.
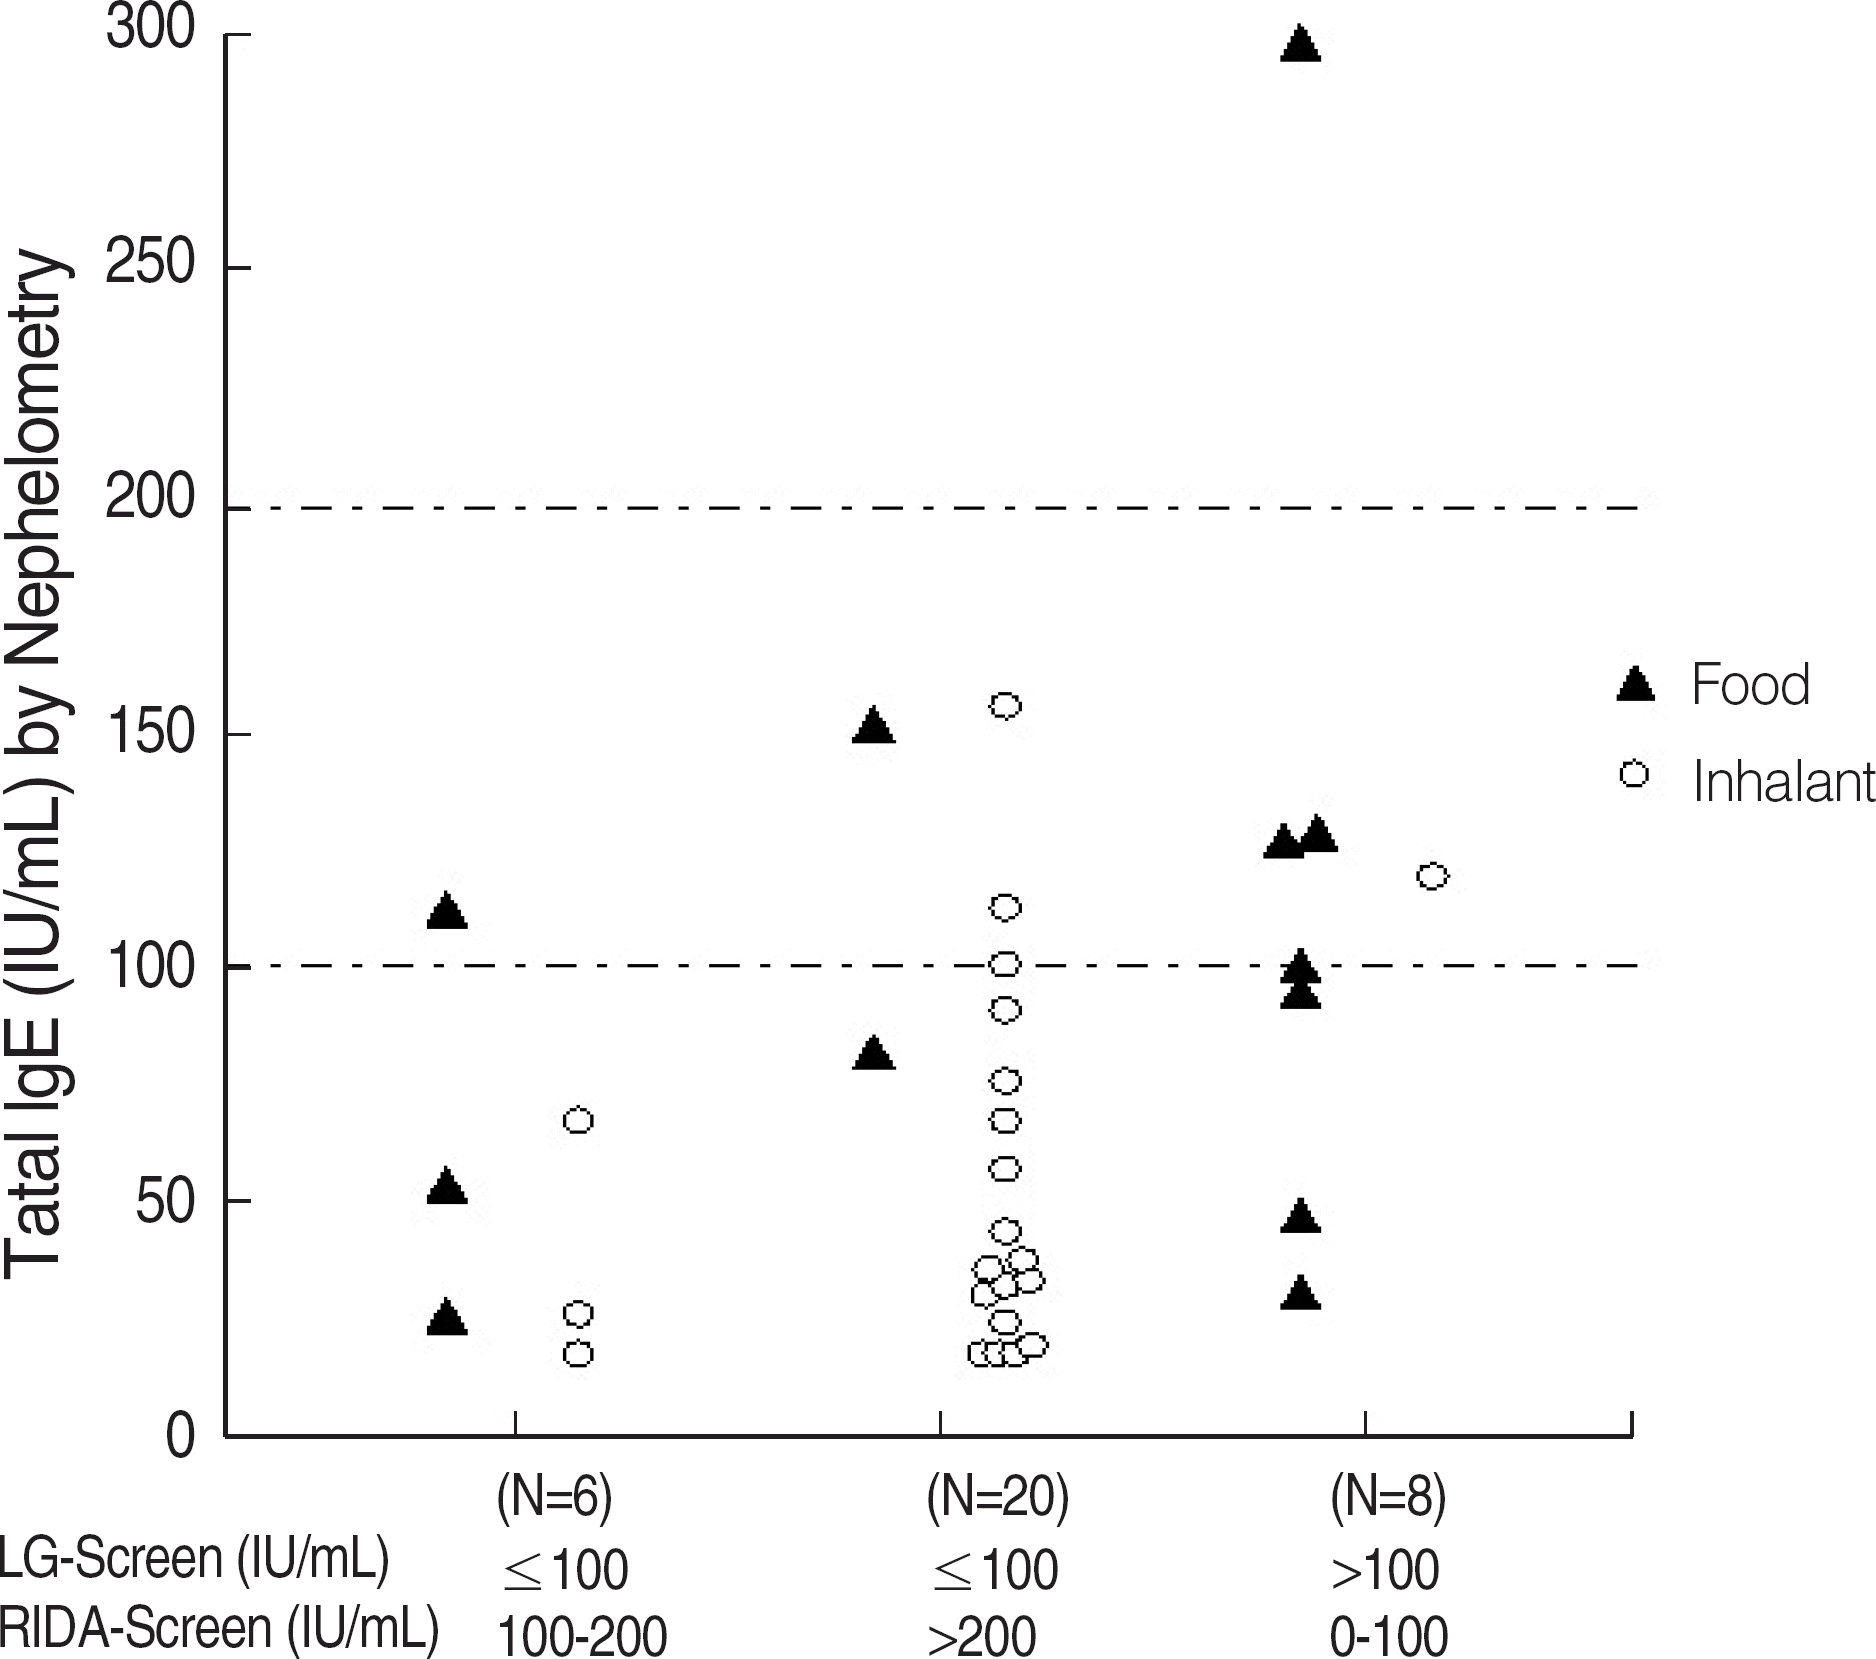
Fig. 2.
Positive rates of allergen-specific IgE in LG-Screen and RIDA-Screen assays. Numbers of sera tested according to different allergens were 180(∗), 100(†) and 80(‡).
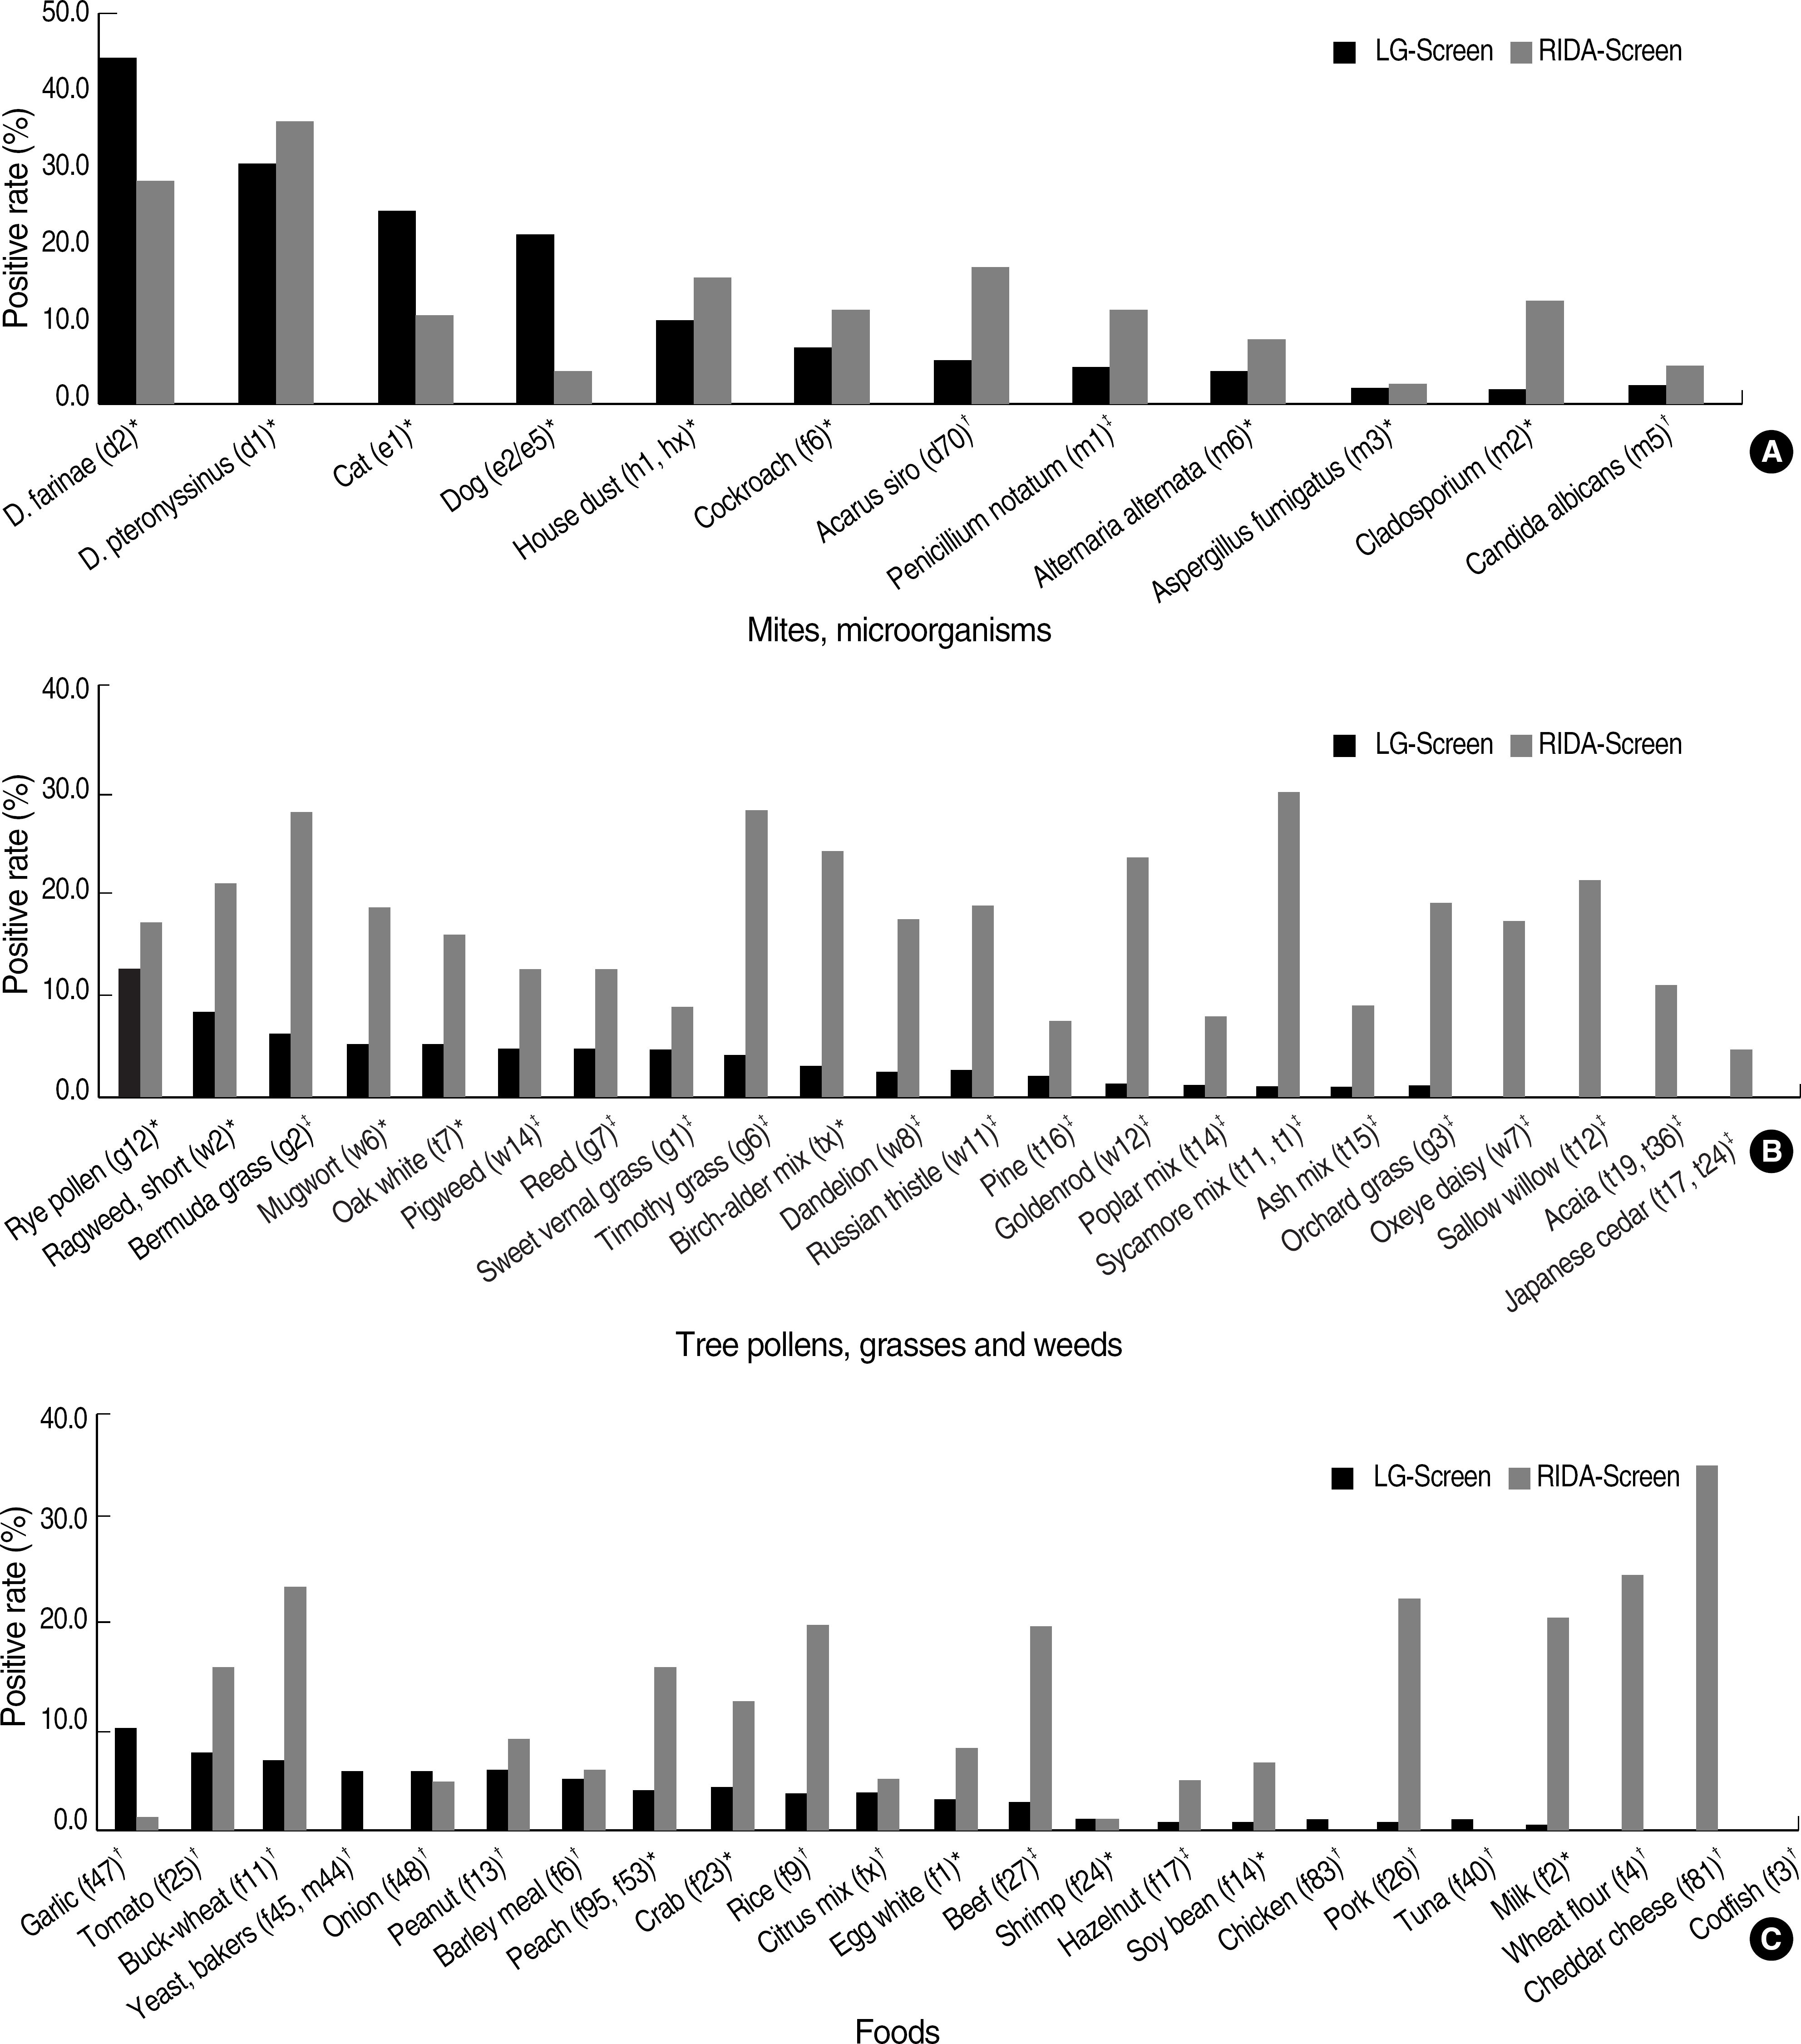
Table 1.
Tested allergens in LG-Screen, RIDA-Screen and ImmunoCAP assays
| Panel | LG-Screen | RIDA-Screen | ImmunoCAP | |||||
|---|---|---|---|---|---|---|---|---|
| Code | Allergens | Code | Allergens | Code | Allergens | |||
| Inhalant | F17 | Hazelnut | ∗ | ∗ | ||||
| G1 | Sweet vernal grass | ∗ | ∗ | |||||
| G2 | Bermuda grass | ∗ | ∗ | |||||
| G3 | Orchard grass | ∗ | ∗ | |||||
| G6 | Timothy grass | ∗ | ∗ | |||||
| G7 | Reed | ∗ | ∗ | |||||
| M1 | Penicillium notatum | ∗ | ∗ | |||||
| T11 | Sycamore mix | T1 | Sycamore maple | T11 | Sycamore mix | |||
| T12 | Sallow willow | ∗ | ∗ | |||||
| T14 | Poplar mix | ∗ | ∗ | |||||
| T15 | Ash mix | ∗ | ∗ | |||||
| T16 | Pine | ∗ | ∗ | |||||
| T17 | Japanese cedar | T24 | Cedar | T17 | Japanese cedar | |||
| T19 | Acacia | T36 | Acacia | T19 | Acacia | |||
| W11 | Russian thistle | ∗ | ∗ | |||||
| W12 | Goldenrod | ∗ | ∗ | |||||
| W14 | Pigweed | ∗ | ∗ | |||||
| W7 | Oxeye daisy | ∗ | ∗ | |||||
| W8 | Dandelion | ∗ | ∗ | |||||
| Food | D70 | Acarus siro | ∗ | ∗ | ||||
| F11 | Buck-wheat | ∗ | ∗ | |||||
| F13 | Peanut | ∗ | ∗ | |||||
| F25 | Tomato | ∗ | ∗ | |||||
| F26 | Pork | ∗ | ∗ | |||||
| F27 | Beef | ∗ | ∗ | |||||
| F3 | Codfish | ∗ | NT | |||||
| F4 | Wheat flour | ∗ | ∗ | |||||
| F40 | Tuna | ∗ | ∗ | |||||
| F41 | Salmon | ∗ | NT | |||||
| F45 | Yeast, bakers | M44 | Yeast, bakers | F45 | Yeast, bakers | |||
| F47 | Garlic | ∗ | ∗ | |||||
| F48 | Onion | ∗ | ∗ | |||||
| F6 | Barley meal | ∗ | ∗ | |||||
| F81 | Cheddar cheese | ∗ | ∗ | |||||
| F83 | Chicken | ∗ | ∗ | |||||
| F9 | Rice | ∗ | ∗ | |||||
| Fx | Citrus mix | Kofx | Citrus mix | NT | ||||
| M5 | Candida albicans | ∗ | ∗ | |||||
| Common | D1 | D. pteronyssinus | ∗ | ∗ | ||||
| D2 | D. farinae | ∗ | ∗ | |||||
| H1 | House dust | Hx | House dust | H1 | House dust | |||
| E1 | Cat | ∗ | ∗ | |||||
| E2/E5 | Dog epithelium | E5 | Dog | E2 | Dog epithelium | |||
| F1 | Egg white | ∗ | ∗ | |||||
| F14 | Soy bean | ∗ | ∗ | |||||
| F2 | Milk | ∗ | ∗ | |||||
| F206 | Mackerel | ∗ | NT | NT | ||||
| F23 | Crab | ∗ | ∗ | |||||
| F24 | Shrimp | ∗ | ∗ | |||||
| F95 | Peach | F53 | Peach | ∗ | ||||
| G12 | Rye pollens | ∗ | G5 | Rye-grass | ||||
| I6 | Cockroach | ∗ | ∗ | |||||
| M2 | Cladosporium | ∗ | ∗ | |||||
| M3 | Aspergillus fumigatus | ∗ | ∗ | |||||
| M6 | Alternaria alternata | ∗ | ∗ | |||||
| T7 | Oak white | ∗ | ∗ | |||||
| Tx | Birch-alder mix | TxKo | Birch-alder mix | T2, T3 | Grey alder, common silver birch | |||
| W2 | Ragweed, short | W2 | Ragweed, short | W1 | Common ragweed | |||
| W22 | Japanese hop | NT | NT | |||||
| W6 | Mugwort | ∗ | ∗ | |||||
Table 2.
Comparison of the test results between LG-Screen and RIDA-Screen assays
| Allergens | N | LG-Screen + | + | - | - | Agreement % (kappa value) | |
|---|---|---|---|---|---|---|---|
| RIDA-Screen + | - | + | - | ||||
| D. pteronyssinus (d1) | 180 | 40 | 16 | 26 | 98 | 76.7 (0.481) | |
| D. farinae (d2) | 180 | 44 | 36 | 8 | 92 | 75.6 (0.487) | |
| Acarus siro (d70) | 100 | 4 | 2 | 14 | 80 | 84.0 (0.267) | |
| House dust (h1, hx) | 180 | 8 | 12 | 22 | 138 | 81.1 (0.215) | 79.3 (0.443)∗ |
| Cat (e1) | 180 | 6 | 39 | 15 | 120 | 70.0 (0.027) | |
| Dog (e2, e5) | 180 | 7 | 33 | 1 | 139 | 81.1 (0.235) | 75.6 (0.123) |
| Egg white (f1) | 180 | 6 | 0 | 9 | 165 | 95.0 (0.550) | |
| Buck-wheat (f11) | 100 | 6 | 1 | 18 | 75 | 81.0 (0.313) | |
| Peanut (f13) | 100 | 4 | 2 | 5 | 89 | 93.0 (0.497) | |
| Soy bean (f14) | 180 | 1 | 1 | 11 | 167 | 93.3 (0.126) | |
| Hazelnut (f17) | 80 | 1 | 0 | 3 | 76 | 96.3 (0.388) | |
| Milk (f2) | 180 | 0 | 1 | 37 | 142 | 78.9 (-0.011) | |
| Crab (f23) | 180 | 5 | 3 | 18 | 154 | 88.3 (0.275) | |
| Shrimp (f24) | 180 | 2 | 1 | 1 | 176 | 98.9 (0.661) | |
| Tomato (f25) | 100 | 6 | 2 | 10 | 82 | 88.0 (0.440) | |
| Pork (f26) | 100 | 0 | 1 | 23 | 76 | 76.0 (-0.020) | |
| Beef (f27) | 100 | 2 | 1 | 18 | 79 | 81.0 (0.128) | |
| Codfish (f3) | 100 | 0 | 0 | 0 | 100 | 100 (NaN) | |
| Wheat flour (f4) | 100 | 0 | 0 | 25 | 75 | 75.0 (0.000) | |
| Tuna (f40) | 100 | 0 | 1 | 0 | 99 | 99.0 (0.000) | |
| Salmon (f41) | 100 | 0 | 0 | 0 | 100 | 100 (NaN) | |
| Yeast, Baker (f45, M44) | 100 | 0 | 6 | 0 | 94 | 94.0 (0.000) | |
| Garlic (f47) | 100 | 0 | 10 | 1 | 89 | 89.0 (-0.019) | |
| Onion (f48) | 100 | 3 | 3 | 2 | 92 | 95.0 (0.519) | |
| Peach (f95, f53) | 180 | 7 | 1 | 22 | 150 | 87.2 (0.332) | |
| Barley meal (f6) | 100 | 3 | 2 | 3 | 92 | 95.0 (0.519) | |
| Cheddar cheese (f81) | 100 | 0 | 0 | 35 | 65 | 65.0 (0.000) | |
| Chicken (f83) | 100 | 0 | 1 | 0 | 99 | 99.0 (0.000) | |
| Rice (f9) | 100 | 4 | 0 | 16 | 80 | 84.0 (0.286) | |
| Citrus mix (fx) | 100 | 2 | 2 | 3 | 93 | 95.0 (0.419) | 89.5 (0.220) |
| Sweet vernal grass (g1) | 80 | 3 | 1 | 4 | 72 | 93.8 (0.515) | |
| Rye pollens (g12) | 180 | 18 | 5 | 13 | 144 | 90.0 (0.609) | |
| Bermuda grass (g2) | 80 | 5 | 0 | 17 | 58 | 78.8 (0.299) | |
| Orchard grass (g3) | 80 | 1 | 0 | 14 | 65 | 82.5 (0.104) | |
| Timothy grass (g6) | 80 | 3 | 0 | 19 | 58 | 76.3 (0.186) | |
| Reed (g7) | 80 | 4 | 0 | 6 | 70 | 92.5 (0.538) | 85.6 (0.403) |
| Cockroach (i6) | 180 | 10 | 4 | 12 | 154 | 91.1 (0.509) | |
| Penicillium notatum (m1) | 80 | 3 | 1 | 7 | 69 | 90.0 (0.385) | |
| Cladosporium (m2) | 180 | 1 | 3 | 24 | 152 | 85.0 (0.032) | |
| Aspergillus fumigatus (m3) | 180 | 1 | 3 | 4 | 172 | 96.1 (0.203) | |
| Candida albicans (m5) | 100 | 0 | 2 | 5 | 93 | 93.0 (-0.029) | |
| Alternaria alternata (m6) | 180 | 3 | 5 | 12 | 160 | 90.6 (0.215) | 90.9 (0.264) |
| Sycamore mix (t11, t1) | 80 | 1 | 0 | 23 | 56 | 71.3 (0.057) | |
| Sallow willow (t12) | 80 | 0 | 0 | 17 | 63 | 78.8 (0.000) | |
| Poplar mix (t14) | 80 | 0 | 1 | 6 | 73 | 91.3 (-0.022) | |
| Ash mix (t15) | 80 | 1 | 0 | 6 | 73 | 92.5 (0.233) | |
| Pine (t16) | 80 | 1 | 1 | 5 | 73 | 92.5 (0.221) | |
| Japanese cedar (t17, t24) | 80 | 0 | 0 | 4 | 76 | 95.0 (0.000) | |
| Acacia (t19, t36) | 80 | 0 | 0 | 9 | 71 | 88.8 (0.000) | |
| Oak white (t7) | 180 | 9 | 1 | 19 | 151 | 88.9 (0.427) | |
| Birch-alder mix (tx) | 180 | 6 | 0 | 37 | 137 | 79.4 (0.198) | 86.5 (0.186) |
| Russian thistle (w11) | 80 | 2 | 0 | 13 | 65 | 83.8 (0.200) | |
| Goldenrod (w12) | 80 | 1 | 0 | 18 | 61 | 77.5 (0.078) | |
| Pigweed (w14) | 80 | 2 | 2 | 8 | 68 | 87.5 (0.231) | |
| Ragweed, short (w2) | 180 | 13 | 2 | 25 | 140 | 85.0 (0.421) | |
| Mugwort (w6) | 180 | 9 | 1 | 24 | 146 | 86.1 (0.364) | |
| Oxeye daisy (w7) | 80 | 0 | 0 | 14 | 66 | 82.5 (0.000) | |
| Dandelion (w8) | 80 | 1 | 1 | 13 | 65 | 82.5 (0.085) | 83.6 (0.263) |
| Total | 7,020 | 259 | 210 | 724 | 5,827 | 86.7 (0.293) | |
Table 3.
Specific allergens according to the agreement between LG-Screen and RIDA-Screen assay results
Table 4.
Analysis of discrepant results between LG-Screen and RIDA-Screen assays compared with ImmunoCAP assay (N=633)
| Allergens | LG-Screen | + | + | + | + | Agreement % (kappa value) between ImmunoCAP & | |||
|---|---|---|---|---|---|---|---|---|---|
| N RIDA-Screen | - | - | - | - | |||||
| ImmunoCAP - | - | - | - | LG | RIDA | ||||
| D. pteronyssinus(d1) | 27 | 2 (7.4)∗ | 8 (29.6) | 2 (7.4) | 15 (55.6) | 37.0 | 63.0 | ||
| D. farinae (d2) | 31 | 3 (9.7) | 21 (67.7) | 3 (9.7) | 4 (12.9) | 77.4 | 22.6 | ||
| Acarus siro (d70) | 13 | (0.0) | 1 (7.7) | 5 (38.5) | 7 (53.8) | 46.2 | 53.8 | ||
| House dust (hx, h1) | 28 | 4 (14.3) | 6 (21.4) | 8 (28.6) | 10 (35.7) | 50.0 | 54.5 (0.127)† | 50.0 | 46.5 (-0.138) |
| Cat (e1) | 36 | 18 (50.0) | 9 (25.0) | 8 (22.2) | 1 (2.8) | 47.2 | 52.8 | ||
| Dog (e2,e5) | 22 | 15 (68.2) | 6 (27.3) | 1 (4.5) | (0.0) | 31.8 | 41.4 (0.094) | 68.2 | 58.6 (-0.172) |
| Egg white (f1) | 6 | (0.0) | (0.0) | 5 (83.3) | 1 (16.7) | 83.3 | 16.7 | ||
| Buck-wheat (f11) | 9 | (0.0) | (0.0) | 5 (55.6) | 4 (44.4) | 55.6 | 44.4 | ||
| Peanut (f13) | 3 | (0.0) | 1 (33.3) | 1 (33.3) | 1 (33.3) | 66.7 | 33.3 | ||
| Soy bean (f14) | 7 | (0.0) | (0.0) | 1 (14.3) | 6 (85.7) | 14.3 | 85.7 | ||
| Hazelnut (f17) | 3 | (0.0) | (0.0) | 3 (100) | (0.0) | 100 | 0.0 | ||
| Milk (f2) | 24 | (0.0) | (0.0) | 22 (91.7) | 2 (8.3) | 91.7 | 8.3 | ||
| Crab (f23) | 16 | 2 (12.5) | 1 (6.3) | 12 (75.0) | 1 (6.3) | 81.3 | 18.8 | ||
| Shrimp (f24) | 2 | (0.0) | 1 (50.0) | (0.0) | 1 (50.0) | 50.0 | 50.0 | ||
| Tomato (f25) | 6 | (0.0) | (0.0) | 2 (33.3) | 4 (66.7) | 33.3 | 66.7 | ||
| Pork (f26) | 15 | (0.0) | (0.0) | 15 (100) | (0.0) | 100 | 0.0 | ||
| Beef (f27) | 13 | (0.0) | (0.0) | 13 (100) | (0.0) | 100 | 0.0 | ||
| Wheat flour (f4) | 17 | (0.0) | (0.0) | 6 (35.3) | 11 (64.7) | 35.3 | 64.7 | ||
| Tuna (f40) | 1 | (0.0) | 1 (100) | (0.0) | (0.0) | 100 | 0.0 | ||
| Yeast, Bakers (f45, M44) | 5 | 3 (60.0) | 2 (40.0) | (0.0) | (0.0) | 40.0 | 60.0 | ||
| Garlic (f47) | 9 | 1 (11.1) | 8 (88.9) | (0.0) | (0.0) | 88.9 | 11.1 | ||
| Onion (f48) | 5 | (0.0) | 3 (60.0) | (0.0) | 2 (40.0) | 60.0 | 40.0 | ||
| Peach (f95, f53) | 18 | (0.0) | (0.0) | 11 (61.1) | 7 (38.9) | 61.1 | 38.9 | ||
| Barley meal (f6) | 3 | (0.0) | 1 (33.3) | 2 (66.7) | (0.0) | 100 | 0.0 | ||
| Cheddar cheese (f81) | 24 | (0.0) | (0.0) | 24 (100) | (0.0) | 100 | 0.0 | ||
| Chicken (f83) | 1 | 1 (100) | (0.0) | (0.0) | (0.0) | 0.0 | 100 | ||
| Rice (f9) | 9 | (0.0) | (0.0) | 3 (33.3) | 6 (66.7) | 33.3 | 73.0 (0.271) | 66.7 | 27.0 (-0.160) |
| Sweet vernal grass (g1) | 5 | (0.0) | 1 (20.0) | 3 (60.0) | 1 (20.0) | 80.0 | 20.0 | ||
| Rye pollens (g12, g5) | 6 | 1 (16.7) | 2 (33.3) | 3 (50.0) | (0.0) | 83.3 | 16.7 | ||
| Bermuda grass (g2) | 6 | (0.0) | (0.0) | 6 (100) | (0.0) | 100 | 0.0 | ||
| Orchard grass (g3) | 13 | (0.0) | (0.0) | 11 (84.6) | 2 (15.4) | 84.6 | 15.4 | ||
| Timothy grass (g6) | 17 | (0.0) | (0.0) | 17 (100) | (0.0) | 100 | 0.0 | ||
| Reed (g7) | 5 | (0.0) | (0.0) | 4 (80.0) | 1 (20.0) | 80.0 | 90.4 (0.496) | 20.0 | 9.6 (-0.117) |
| Cockroach (i6) | 13 | 1 (7.7) | 2 (15.4) | 3 (23.1) | 7 (53.8) | 38.5 | 61.5 | ||
| Penicillium notatum (m1) | 7 | 1 (14.3) | (0.0) | 5 (71.4) | 1 (14.3) | 71.4 | 28.6 | ||
| Cladosporium (m2) | 15 | 3 (20.0) | (0.0) | 11 (73.3) | 1 (6.7) | 73.3 | 26.7 | ||
| Aspergillus fumigatus (m3) 3 | 1 (33.3) | (0.0) | 2 (66.7) | (0.0) | 66.7 | 33.3 | |||
| Candida albicans (m5) | 3 | (0.0) | (0.0) | 3 (100) | (0.0) | 100 | 0.0 | ||
| Alternaria alternata (m6) | 8 | 2 (25.0) | 1 (12.5) | 5 (62.5) | (0.0) | 75.0 | 75.0 (0.069) | 25.0 | 25.0 (-0.025) |
| Sycamore mix (t11, t1) | 22 | (0.0) | (0.0) | 22 (100) | (0.0) | 100 | 0.0 | ||
| Sallow willow (t12) | 7 | (0.0) | (0.0) | 6 (85.7) | 1 (14.3) | 85.7 | 14.3 | ||
| Poplar mix (t14) | 7 | 1 (14.3) | (0.0) | 5 (71.4) | 1 (14.3) | 71.4 | 28.6 | ||
| Pine (t16) | 6 | 1 (16.7) | (0.0) | 5 (83.3) | (0.0) | 83.3 | 16.7 | ||
| Japanese cedar (t17, t24) | 2 | (0.0) | (0.0) | 2 (100) | (0.0) | 100 | 0.0 | ||
| Acacia (t19, t36) | 4 | (0.0) | (0.0) | 4 (100) | (0.0) | 100 | 0.0 | ||
| Oak white (t7) | 14 | (0.0) | (0.0) | 10 (71.4) | 4 (28.6) | 71.4 | 28.6 | ||
| Birch-alder mix (tx, t2, t3) | 18 | (0.0) | (0.0) | 12 (66.7) | 6 (33.3) | 66.7 | 82.5 (-0.045) | 33.3 | 17.5 (0.009) |
| Russian thistle (w11) | 13 | (0.0) | (0.0) | 12 (92.3) | 1 (7.7) | 92.3 | 7.7 | ||
| Goldenrod (w12) | 17 | (0.0) | (0.0) | 17 (100) | (0.0) | 100 | 0.0 | ||
| Pigweed (w14) | 9 | 1 (11.1) | (0.0) | 8 (88.9) | (0.0) | 88.9 | 11.1 | ||
| Ragweed (w2, w1) | 17 | (0.0) | (0.0) | 15 (88.2) | 2 (11.8) | 88.2 | 11.8 | ||
| Mugwort (w6) | 17 | (0.0) | (0.0) | 11 (64.7) | 6 (35.3) | 64.7 | 35.3 | ||
| Oxeye daisy (w7) | 13 | (0.0) | (0.0) | 9 (69.2) | 4 (30.8) | 69.2 | 30.8 | ||
| Dandelion (w8) | 13 | 1 (7.7) | (0.0) | 11 (84.6) | 1 (7.7) | 84.6 | 83.8 (-0.037) | 15.4 | 16.2 (0.007) |
| Total | 633 | 62 (9.8) | 75 (11.8) | 374 (59.1) | 12 (19.3) | 70.9 (0.585) | 29.1 (-0.303) | ||
 XML Download