This article has been
cited by other articles in ScienceCentral.
Dear Editor,
A new-generation proficiency testing (PT) was launched by the Korean Association of Quality Assurance for Clinical Laboratory (KAQACL) in early 2016 [
1]. Previously, PT for electrolyte tests included two main peer groups, direct and indirect ion-selective electrode (ISE) groups, which were independent of the manufacturer and model. However, the current peer group distinguishes the manufacturer of the test system participating in the PT, although it is not a specific test system. Using the revised KAQACL PT results, we evaluated the overall accuracy of Na
+, K
+, and Cl
− tests by the manufacturer, as well as direct and indirect ISE results of electrolyte analyzers currently used in Korea.
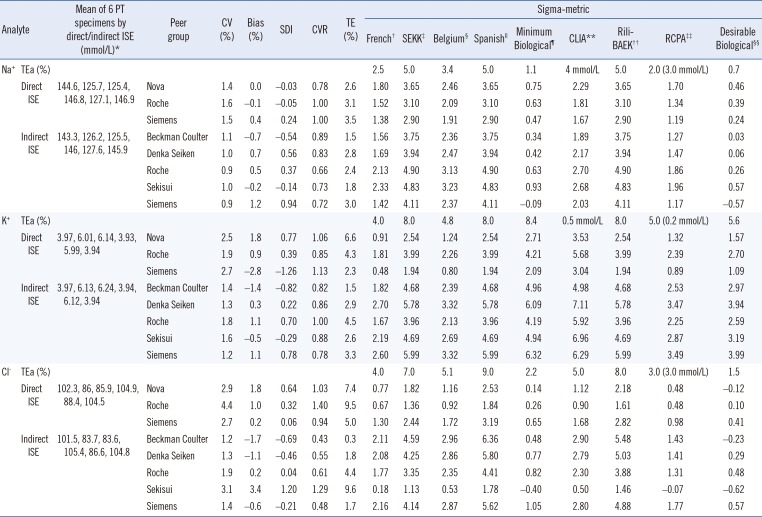
Data from PT summary reports of electrolyte tests for six PT samples in the 1st and 2nd episodes of 2016 (CC-16-01 to CC-16-06) were evaluated. A peer group was included if it had two events in common and a sufficient number of participants for the PT provider to report groups statistics in the summary report. Three direct and five indirect ISE peer groups were evaluated in this study (
Table 1). Bias, SD index (SDI), CV ratio (CVR), and total analytical error (TE) for each peer group were calculated for each specimen in each episode using the following equations:
Because the quality requirement for the PT was not specified by the KAQACL (
Table 1), nine types of sigma-metrics were calculated by using the corresponding allowable total error (TEa) for each specimen in each episode as follows:
Mean values from all direct or indirect ISE methods were assumed to be true values in the calculations for the corresponding peer group.
If either the SD or CV was zero in the PT summary report, because of a value lower than a significance threshold, it was excluded from the analysis. To develop the “Sigma Proficiency Assessment Chart” [
23], we arbitrarily chose the quality requirements from the Rili-BAEK guidelines [
4]. Among the nine types of sigma-metrics available; 5.0%, 8.0%, and 8.0% were used as the tolerance limits in calculating the sigma-metric for Na
+, K
+, and Cl
−, respectively. In addition to the merits of Rili-BAEK described by Orth [
5], because of its larger TEa, the sigma-metric would be more widely distributed and is more suitable for conducting a relative comparison among peer groups (
Table 1). This study was exempted from being approved by the Institutional Review Board (IRB) of the Catholic Medical Center at the Catholic University of Korea (HC16ENSI0095).
The peer group-specific median TE values of Na
+, K
+, and Cl
− across six PT specimens were 1.5–3.5%, 1.5–6.6%, and 0.3–9.6%, respectively. The sigma-metric varied depending on the adopted TEa (
Table 1). Overall, indirect ISE gave a lower TE and higher sigma-metric compared with direct ISE. The peer groups showing higher sigma-metrics for Na
+, K
+, and Cl
− were Roche and Sekisui, Siemens and Denka Seiken, and Beckman Coulter and Denka Seiken indirect ISE, respectively. Beckman Coulter indirect ISE for Na
+ (1.5%), Beckman Coulter indirect ISE (1.5%) and Siemens direct ISE (2.3%) for K
+, and Siemens indirect ISE for Cl
− (1.7%) also showed lower TE values. When using Rili-BAEK as a TEa, the following test systems showed a sigma-metric higher than four in all six PT samples: Sekisui indirect ISE for Na
+ (4.10–7.88 sigma); Sekisui indirect ISE for K
+ (4.51–6.27 sigma); and Beckman Coulter (4.53–6.56 sigma), Denka Seiken (4.37–7.16 sigma), and Siemens (4.31–8.00 sigma) indirect ISE for Cl
− (
Fig. 1). Westgard [
6] reported manufacturer-instrument groups showing sigma-metrics higher than five in five PT programs, in which the sigma-metric was calculated by using the CV but without bias, because the type of consensus mean differed among the PT programs. In addition, because the SD was estimated from more specific manufacturer-instrument groups than manufacturer groups as in the present study, the sigma-metrics reported by Westgard [
6] were higher than the values obtained herein. Moreover, the sigma-metric itself may not be meaningful when determined from PT. This is because the sigma-metric from PT is not used to optimize the QC design in a laboratory and varies depending on the TEa used for its calculation. Instead, the relative rank would be a more useful metric. Regular analysis of the PT summary report may be a valuable resource for clinical laboratories in choosing a test system and for regional offices of the manufacturers engaged in customer service.
Acknowledgments
This research was supported by a grant (16172MFDS356) from the Ministry of Food and Drug Safety in 2016.
References
1. Korean Association of Quality Assurance for Clinical Laboratory. New Generation Proficiency Testing Program. Updated on May 2016.
http://eqas.keqas.org/.
2. Westgard JO, Westgard SA. Assessing quality on the Sigma scale from proficiency testing and external quality assessment surveys. Clin Chem Lab Med. 2015; 53:1531–1535. PMID:
25719323.
3. Westgard JO, Westgard SA. Quality control review: implementing a scientifically based quality control system. Ann Clin Biochem. 2016; 53:32–50. PMID:
26150675.
4. Revision of the “Guideline of the German Medical Association on Quality Assurance in Medical Laboratory Examinations-Rili-BAEK” (unauthorized translation). J Lab Med. 2015; 39:26–69.
5. Orth M. Are regulation-driven performance criteria still acceptable? - The German point of view. Clin Chem Lab Med. 2015; 53:893–898. PMID:
25849796.
6. Westgard SA. Utilizing global data to estimate analytical performance on the Sigma scale: A global comparative analysis of methods, instruments, and manufacturers through external quality assurance and proficiency testing programs. Clin Biochem. 2016; 49:699–707. PMID:
26948097.
Fig. 1
Sigma Proficiency Assessment Chart of the Korean Association of Quality Assurance for Clinical Laboratory (KAQACL) proficiency testing (PT) in 2016 for Na+ (A), K+ (B), and Cl− (C). Allowable total error (TEa) values for Na+, K+, and Cl− were 5.0%, 8.0%, and 8.0%, respectively, which were from Rili-BAEK German guidelines for quality. Six points in the same color belong to one of eight peer groups and are from each of six specimens (CC-16-01-CC-16-06). Point size is proportional to the size of the peer group.
Abbreviation: ISE, ion-selective electrode.
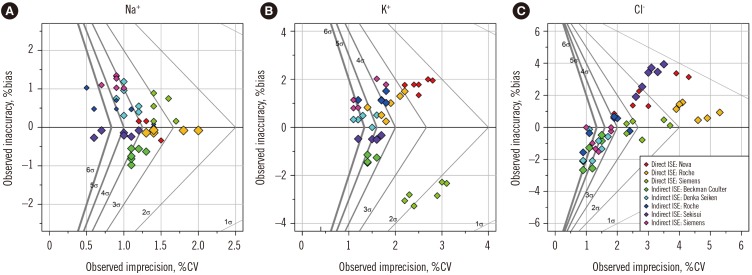
Table 1
The analytical performance of electrolyte analyzers according to peer group for six specimens (CC-16-01-CC-16-06) in two episodes of proficiency testing by the Korean Association of Quality Assurance for Clinical Laboratory (KAQACL) in 2016
|
Analyte |
Mean of 6 PT specimens by direct/indirect ISE (mmol/L)*
|
Peer group |
CV (%) |
Bias (%) |
SDI |
CVR |
TE (%) |
Sigma-metric |
|
French†
|
SEKK‡
|
Belgium§
|
Spanish∥
|
Minimum Biological¶
|
CLIA**
|
Rili-BAEK††
|
RCPA‡‡
|
Desirable Biological§§
|
|
Na+
|
TEa (%) |
|
|
|
|
|
|
|
2.5 |
5.0 |
3.4 |
5.0 |
1.1 |
4 mmol/L |
5.0 |
2.0 (3.0 mmol/L) |
0.7 |
|
Direct ISE |
144.6, 125.7, 125.4, 146.8, 127.1, 146.9 |
Nova |
1.4 |
0.0 |
−0.03 |
0.78 |
2.6 |
1.80 |
3.65 |
2.46 |
3.65 |
0.75 |
2.29 |
3.65 |
1.70 |
0.46 |
|
Roche |
1.6 |
−0.1 |
−0.05 |
1.00 |
3.1 |
1.52 |
3.10 |
2.09 |
3.10 |
0.63 |
1.81 |
3.10 |
1.34 |
0.39 |
|
Siemens |
1.5 |
0.4 |
0.24 |
1.00 |
3.5 |
1.38 |
2.90 |
1.91 |
2.90 |
0.47 |
1.67 |
2.90 |
1.19 |
0.24 |
|
Indirect ISE |
143.3, 126.2, 125.5, 146, 127.6, 145.9 |
Beckman Coulter |
1.1 |
−0.7 |
−0.54 |
0.89 |
1.5 |
1.56 |
3.75 |
2.36 |
3.75 |
0.34 |
1.89 |
3.75 |
1.27 |
0.03 |
|
Denka Seiken |
1.0 |
0.7 |
0.56 |
0.83 |
2.8 |
1.69 |
3.94 |
2.47 |
3.94 |
0.42 |
2.17 |
3.94 |
1.47 |
0.06 |
|
Roche |
0.9 |
0.5 |
0.37 |
0.66 |
2.4 |
2.13 |
4.90 |
3.13 |
4.90 |
0.63 |
2.70 |
4.90 |
1.86 |
0.26 |
|
Sekisui |
1.0 |
−0.2 |
−0.14 |
0.73 |
1.8 |
2.33 |
4.83 |
3.23 |
4.83 |
0.93 |
2.68 |
4.83 |
1.96 |
0.57 |
|
Siemens |
0.9 |
1.2 |
0.94 |
0.72 |
3.0 |
1.42 |
4.11 |
2.37 |
4.11 |
−0.09 |
2.03 |
4.11 |
1.17 |
−0.57 |
|
K+
|
TEa (%) |
|
|
|
|
|
|
|
4.0 |
8.0 |
4.8 |
8.0 |
8.4 |
0.5 mmol/L |
8.0 |
5.0 (0.2 mmol/L) |
5.6 |
|
Direct ISE |
3.97, 6.01, 6.14, 3.93, 5.99, 3.94 |
Nova |
2.5 |
1.8 |
0.77 |
1.06 |
6.6 |
0.91 |
2.54 |
1.24 |
2.54 |
2.71 |
3.53 |
2.54 |
1.32 |
1.57 |
|
Roche |
1.9 |
0.9 |
0.39 |
0.85 |
4.3 |
1.81 |
3.99 |
2.26 |
3.99 |
4.21 |
5.68 |
3.99 |
2.39 |
2.70 |
|
Siemens |
2.7 |
−2.8 |
−1.26 |
1.13 |
2.3 |
0.48 |
1.94 |
0.80 |
1.94 |
2.09 |
3.04 |
1.94 |
0.89 |
1.09 |
|
Indirect ISE |
3.97, 6.13, 6.24, 3.94, 6.12, 3.94 |
Beckman Coulter |
1.4 |
−1.4 |
−0.82 |
0.82 |
1.5 |
1.82 |
4.68 |
2.39 |
4.68 |
4.96 |
4.98 |
4.68 |
2.53 |
2.97 |
|
Denka Seiken |
1.3 |
0.3 |
0.22 |
0.86 |
2.9 |
2.70 |
5.78 |
3.32 |
5.78 |
6.09 |
7.11 |
5.78 |
3.47 |
3.94 |
|
Roche |
1.8 |
1.1 |
0.70 |
1.00 |
4.5 |
1.67 |
3.96 |
2.13 |
3.96 |
4.19 |
5.92 |
3.96 |
2.25 |
2.59 |
|
Sekisui |
1.6 |
−0.5 |
−0.29 |
0.88 |
2.6 |
2.19 |
4.69 |
2.69 |
4.69 |
4.94 |
6.96 |
4.69 |
2.87 |
3.19 |
|
Siemens |
1.2 |
1.1 |
0.78 |
0.78 |
3.3 |
2.60 |
5.99 |
3.32 |
5.99 |
6.32 |
6.29 |
5.99 |
3.49 |
3.99 |
|
Cl−
|
TEa (%) |
|
|
|
|
|
|
|
4.0 |
7.0 |
5.1 |
9.0 |
2.2 |
5.0 |
8.0 |
3.0 (3.0 mmol/L) |
1.5 |
|
Direct ISE |
102.3, 86, 85.9, 104.9, 88.4, 104.5 |
Nova |
2.9 |
1.8 |
0.64 |
1.03 |
7.4 |
0.77 |
1.82 |
1.16 |
2.53 |
0.14 |
1.12 |
2.18 |
0.48 |
−0.12 |
|
Roche |
4.4 |
1.0 |
0.32 |
1.40 |
9.5 |
0.67 |
1.36 |
0.92 |
1.84 |
0.26 |
0.90 |
1.61 |
0.48 |
0.10 |
|
Siemens |
2.7 |
0.2 |
0.06 |
0.94 |
5.0 |
1.30 |
2.44 |
1.72 |
3.19 |
0.65 |
1.68 |
2.82 |
0.98 |
0.41 |
|
Indirect ISE |
101.5, 83.7, 83.6, 105.4, 86.6, 104.8 |
Beckman Coulter |
1.2 |
−1.7 |
−0.69 |
0.43 |
0.3 |
2.11 |
4.59 |
2.96 |
6.36 |
0.48 |
2.90 |
5.48 |
1.43 |
−0.23 |
|
Denka Seiken |
1.3 |
−1.1 |
−0.46 |
0.55 |
1.8 |
2.08 |
4.25 |
2.86 |
5.80 |
0.77 |
2.79 |
5.03 |
1.41 |
0.29 |
|
Roche |
1.9 |
0.2 |
0.04 |
0.61 |
4.4 |
1.77 |
3.35 |
2.35 |
4.41 |
0.82 |
2.30 |
3.88 |
1.31 |
0.48 |
|
Sekisui |
3.1 |
3.4 |
1.20 |
1.29 |
9.6 |
0.18 |
1.13 |
0.53 |
1.78 |
−0.40 |
0.50 |
1.46 |
−0.07 |
−0.62 |
|
Siemens |
1.4 |
−0.6 |
−0.21 |
0.48 |
1.7 |
2.16 |
4.14 |
2.87 |
5.62 |
1.05 |
2.80 |
4.88 |
1.77 |
0.57 |


 PDF
PDF ePub
ePub Citation
 Print
Print


 XML Download