

 PDF
PDF ePub
ePub Citation
 Print
Print


Glaucoma is a progressive optic neuropathy characterized by the loss of retinal ganglion cells and optic nerve fibers, eventually leading to vision loss [12]. Glaucoma is diagnosed by detecting characteristic changes in the optic disc, nerve fiber layers, and visual field (VF). However, because structural changes usually precede VF variations [3], examining the nerve fiber and the ganglion cell layers (GCLs) is important for the early detection of glaucoma and monitoring its progression.
Optical coherence tomography (OCT) has been used to evaluate the structural changes caused by glaucoma [45678910]. The quantitative analysis of the peripapillary retinal nerve fiber layer (RNFL) using OCT is performed widely for the diagnosis and monitoring of glaucoma, and recent studies have shown that analysis of the GCL or ganglion cell-inner plexiform layer (GCIPL) of the macula can be examined for structural changes in glaucomatous eyes [1112131415]. Although GCIPL evaluation may not completely replace peripapillary RNFL evaluation (as only 50% of the GCL can be detected), changes in the macular GCIPL have been reported to precede those in the peripapillary RNFL in early glaucoma [16]. However, the relationship between the changes in peripapillary RNFL and macular GCIPL in glaucomatous eyes is still unclear.
Clustering refers to the unsupervised learning task of partitioning observations into clusters, to uncover subpopulation structures in a dataset. As an unsupervised learning task, cluster analysis makes no use of label or outcome data. Many methods have been proposed for clustering, including hierarchical approaches [1718] as well as non-nested approaches, such as K-means clustering [19]. While non-nested clustering algorithms typically require pre-specifying the number of clusters of interest, hierarchical algorithms do not. As a result, hierarchical clustering provides an intuitive way to study relationships among clusters that is not possible using non-nested approaches.
To investigate the relationship between macular GCL and peripapillary RNFL changes, and to reduce subjective bias, the present study categorized the structural progression patterns of glaucoma based on the results of OCT guided progression analysis (GPA) for peripapillary RNFL and macular GCIPL, using hierarchical cluster analysis. Subsequently, we compared the clinical parameters, patterns of structural progression, and VF progression in order to characterize the resulting groups.
Materials and Methods
Subjects
This study was approved by the institutional review board of Yonsei University College of of Medicine and adhered to the recommendations of the Declaration of Helsinki (4-2017-1172). We retrospectively reviewed the medical records of all the subjects who visited the glaucoma center in our institution from November 2009 to January 2018. The requirement for informed consent was waived because of the retrospective nature of the study, and the analysis used anonymized clinical data.
All subjects underwent complete ophthalmic examinations including best-corrected visual acuity, intraocular pressure (IOP) assessment using the Goldmann applanation tonometer, autorefraction/keratometry (RK-3; Canon USA, Lake Success, NY, USA), slit-lamp biomicroscopy, dilated fundus examination, color disc photography (Carl Zeiss Meditec, Jena, Germany), red-free RNFL photography (Carl Zeiss Meditec), spectral domain (SD) OCT (Cirrus HD-OCT, Carl Zeiss Meditec), axial length (AL) measurement using IOL Master (Carl Zeiss Meditec), and the VF test (Humphrey Field Analyzer II, Carl Zeiss Meditec). These tests were repeated at an interval of 6 to 18 months, as needed.
The inclusion criteria for participants were best-corrected visual acuity of 20 / 40 or better, and an open angle on gonioscopic examinations. Glaucomatous eyes were defined by the presence of glaucomatous-appearing optic discs (neuroretinal rim thinning and excavation) and peripapillary RNFL defect, regardless of the presence or absence of glaucomatous VF defects. Individuals with the following conditions were excluded (1) secondary causes of glaucomatous optic neuropathy, (2) history of glaucoma (including glaucoma filtration surgery) or refractive surgery, and (3) neurologic or systemic diseases with potential consequences on the VF. If both eyes were eligible for inclusion, one of the subject's eyes was selected randomly.
SD-OCT assessment
The SD-OCT images of the peripapillary RNFL and macular GCIPL were obtained by optic disc cube and macular scan, respectively, using a Cirrus HD-OCT. The optic disc cube scan produced an RNFL thickness map for a 6 × 6 mm2 area (200 × 200 pixels) centered on the optic nerve head. The peripapillary RNFL thickness was measured using circular scans with a diameter of 3.46 mm. The macular cube scan generated a GCIPL thickness map for a 6 × 6 mm2 area (512 × 128 pixels) centered on the fovea. The macular GCIPL t hickness was measured in the annulus with inner vertical and horizontal diameters of 1 and 1.2 mm, respectively, and outer vertical and horizontal diameters of 4 and 4.8 mm, respectively. In addition, the baseline rim area, disc area, vertical cup/disc ratio, average cup/disc ratio, and cup volume were measured. At least five reliable OCT examination results from separate visits were required for inclusion in the study. All OCT scans had a signal strength of six or more, and scans with motion artifacts, poor centration, or missing data were excluded.
GPA of the GCIPL and RNFL
The Cirrus HD-OCT GPA (Carl Zeiss Meditec, software ver. 9.5) provides event and trend analyses to detect progressive thinning of the peripapillary RNFL and macular GCIPL. The event analysis compares the differences in the peripapillary RNFL or macular GCIPL between two baseline and follow-up examinations on a 6 × 6 mm2 map (50 × 50 superpixels). For differences outside the range of the test variability, the thickness grading maps and the summary parameters (described below) for peripapillary RNFL or macular GCIPL were categorized as “possible loss” with a yellow code a nd as “likely loss” with a red code. Changes in at least 20 contiguous superpixels were required in the peripapillary RNFL or macular GCIPL thickness maps for them to be classified as important. The trend analysis used linear regression to determine the rates of change in the peripapillary RNFL and macular GCIPL thickness over time (years). Three summary parameters of the peripapillary RNFL or macular GCIPL (average, superior, and inferior thicknesses) were employed to detect their progressive thinning. In this study, progressive peripapillary RNFL and macular GCIPL thinning were defined as a likely loss in the event analysis during the study follow-up, with the same changes being observed in the latest follow-up visit [20].
Evaluation of topographic characteristics of OCT GPA maps
The topographic feature of the progressive peripapillary RNFL thinning was classified according to its location. The location of the progressive peripapillary RNFL thinning was classified as temporal (−30° to 30°), superotemporal (30° to 90°), superonasal (90° to 150°), nasal (150° to 210°), inferonasal (210° to 270°), and inferotemporal (270° to 330°). The respective angles were measured clockwise for the right eye, counterclockwise for the left eye, and the temporal equator was set at 0°. We classified the location by 30° increments (12 clock-hour sectors). The results for all eyes were normalized to those of the right eye when expressed in clock hours. If the progression was located between two areas across the boundary, the location was determined by the larger part, using ImageJ ver. 1.80 (http://imagej.nih.gov/ij/; provided in the public domain by the National Institutes of Health, Bethesda, MD, USA). When multiple progressions were found, their locations and the time taken to detect the progression (herein referred to as detection duration) were evaluated for each component. Two observers (KL and HWB) categorized all the features. A third examiner (CYK) made the final decision for observer-specific differences in opinions.
Perimetry
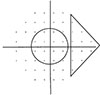
Standard automated perimetry was performed using the Swedish interactive threshold algorithm standard 24-2 program in the Humphrey Field Analyzer II. Only reliable VF test results (i.e., false-positive errors <15%, false-negative errors <15%, and fixation loss <20%) were included in the study. At least five reliable VF test results from separate visits were required for inclusion in the study. The VF progression was analyzed based on two different approaches. First, we calculated the mean deviation (MD) slope by linear regression analysis between MD and age (years), and a statistically significant (p < 0.05) negative slope was defined as VF progression. Second, we evaluated VF progression with reference to the Early Manifest Glaucoma Trial [21]. For the second criterion, significant progression was defined using the pattern deviation probability maps if at least three VF locations deteriorated significantly (at p < 0.05) on three consecutive follow-up tests. An experienced glaucoma specialist (KL) categorized the localization of the progression into parafoveal scotoma (PFS), peripheral nasal step (PNS), both PFS and PNS, and other areas. The criterion for PFS defect was the presence of three or more points with a p-value <5%, one of which had a p-value <1%, within 12 points of a central 10° radius. The criterion for PNS defect was the presence of the aforementioned signs within 12 nasal peripheral points in one hemifield (Fig. 1).
Statistical analyses
Statistical analysis was performed using R software ver. 3.4.3 (R Foundation for Statistical Computing, Vienna, Austria). After standardizing the variables, we performed hierarchical cluster analysis using Ward's method and Euclidean distance. Ward's method has the advantage of minimizing the distribution within the entire cluster [22]. The four variables used for clustering were the results of the event GPA for the peripapillary RNFL and macular GCIPL and the rate of change of average peripapillary RNFL and macular GCIPL thicknesses. We used R software's NbClust package for hierarchical clustering [23], and the pseudoT2 method was used to determine the optimal number of clusters. In this method, the optimal number of clusters was determined using the smallest number of clusters such that the index was smaller than the critical value [24]. After determining the optimal number of clusters, the aforementioned clinical parameters were compared among the clusters. One-way analysis of variance and the Student's t-test were used to compare the continuous variables. When there was a significant difference in analysis of variance results, we applied Tukey's honest significant difference post-hoc test between the groups. Categorical variables were compared using chi-square or Fisher's exact tests. To investigate the relationship between glaucoma stage and the structural progression, we grouped the participants based on the perimetric MD intervals presented in the Hodapp-Parrish-Anderson Glaucoma Grading Scale [25]. The studied e yes were c ategorized a s having early (MD ≥−6 dB), moderate (−12 dB ≤ MD < −6 dB), or advanced (MD <−12 dB) glaucoma. Thereafter, a one-way analysis of variance and chi-square test were applied to analyze the relationship between the variables. All reported p-values are bilateral and those less than 0.05 were considered statistically significant.
Results
Demographics of participants
A total of 164 eyes from 164 subjects were enrolled in this study. The baseline mean age, refractive error, AL, and IOP were 54.1 ± 14.1 years, −2.70 ± 3.90 diopters (D), 24.80 ± 1.80 mm, and 18.9 ± 4.6 mmHg, respectively. There are 114 eyes (69.5%) with baseline IOP under 21. The baseline peripapillary RNFL thickness, macular GCIPL thickness, and MD were 75.0 ± 12.8 µm, 70.8 ± 8.8 µm, and −6.00 ± 6.00 dB, respectively. The mean follow-up period of all subjects was 85.4 ± 9.43 months.
Characteristics of each cluster
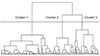
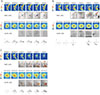
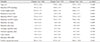
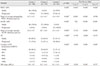
All subjects were categorized using hierarchical cluster analysis with four parameters, as previously described, and the best number of clusters, as determined by the pseudoT2 method, was three (Fig. 2 and Supplemental Table 1). Clinical parameters, such as patient age, baseline IOP, AL, baseline peripapillary RNFL thickness, baseline macular GCIPL thickness, baseline MD, follow-up period, as well as other OCT parameters including rim area, disc area, average cup/disc ratio, vertical cup/disc ratio, and cup volume were not significantly different among the three clusters (Table 1). Table 2 shows the results of OCT and VF examinations. Cluster 1 was characterized by detection of no definite structural progression estimated by OCT (Fig. 3A). All the subjects in cluster 2 showed progression in the RNFL GPA, but not in the GCIPL GPA (Fig. 3B). The rate of average RNFL change in cluster 2 was significantly faster than that of cluster 1 (p < 0.001). The MD slope of cluster 2 was significantly different from that of cluster 1 (p = 0.020), but the VF progression was not (p = 0.192). The VF progression at PNS area was more common for cluster 2 than for cluster 3 (p = 0.001). Cluster 3 was characterized by rapid decrease in both RNFL and GCIPL thicknesses (Fig. 3C). The rate of average RNFL change was significantly faster for cluster 3 than for cluster 1 (p < 0.001). The rate of average GCIPL change was faster for cluster 3 than that for clusters 1 and 2 (p < 0.001 and p < 0.001, respectively). All the subjects in cluster 3 showed progression of GCIPL GPA, and there were statistically significant differences in VF progression and MD slope compared with cluster 1 (p = 0.002 and p < 0.001, respectively). The VF progression at PFS area was more common for cluster 3 than for clusters 1 and 2 (p = 0.001 and p = 0.007, respectively). In cluster 3, there were 16 eyes with only progressive macular GCIPL thinning without progressive peripapillary RNFL thinning. Statistical comparison showed that eyes with only progressive macular GCIPL thinning had thinner baseline peripapillary RNFL thickness (p = 0.024) and thinner baseline macular GCIPL thickness (p < 0.001) than eyes with both progressive macular GCIPL thinning and peripapillary RNFL thinning. There were no statistically significant differences in MD, age, AL, or refractive error (p = 0.255, p = 0.584, p = 0.291, and p = 0.214, respectively).
Topographic features and detection duration of each cluster
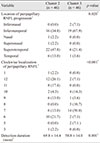
Table 3 shows the topographic features of clusters 2 and 3. In cluster 3 (both peripapillary RNFL and macular GCIPL progression groups), 7 o'clock RNFL thinning progression was the most common. Conversely, progressive peripapillary RNFL thinning at the 12 and 6 o'clock areas were most frequently detected in cluster 2 (p < 0.001). In addition, detection duration was significantly shorter in cluster 3 (p = 0.001). When there were both progressive peripapillary RNFL thinning and progressive macular GCIPL thinning, detection duration of progressive peripapillary RNFL thinning was 68.3 ± 14.3 months, which was longer than that of progressive macular GCIPL thinning, 57.2 ± 9.8 months (p = 0.007)
With respect to location of progression, 24 cases exhibited inferior macular GCIPL thinning progression and 19 cases exhibited superior macular GCIPL thinning progression among 43 eyes with GCIPL thinning progression. Out of the 24 eyes with inferior macular GCIPL thinning progression, 18 (75%) showed progressive peripapillary RNFL thinning in the inferior area, and 7 o'clock RNFL thinning was the most common (13 cases, 72.2%). In contrast, only four cases (21.1%) among the eyes with superior GCIPL thinning progression showed progressive peripapillary RNFL thinning in the superior area. All four cases with progressive peripapillary RNFL thinning were located at the 10 o'clock area.
Analysis by stage of glaucoma
We analyzed the relationship between the stage of glaucoma and the result of OCT GPA. The prevalence of progressive peripapillary RNFL thinning or progressive macular GCIPL thinning was not statistically different among early, moderate, and advanced glaucoma patients (Supplemental Table 2). The rate of peripapillary RNFL change was the fastest in early glaucoma cases (p = 0.013). The rate of macular GCIPL change was not statistically different among early, moderate, and advanced glaucoma cases (p = 0.071). The prevalence of progressive peripapillary RNFL thinning was higher than that of progressive macular GCIPL thinning (p = 0.011) in early glaucoma. There was no significant difference of prevalence between progressive peripapillary RNFL thinning and progressive macular GCIPL thinning in moderate glaucoma (p = 0.266) and advanced glaucoma (p = 0.068).
Discussion
In this study, we categorized the structural progression patterns of glaucoma, as detected by OCT GPA, into three clusters using hierarchical analysis. The three clusters were characterized into stable, progressive peripapillary RNFL thinning without macular GCIPL involvement, and progressive peripapillary RNFL and macular GCIPL thinning. In addition, the progressive peripapillary RNFL and macular GCIPL thinning group showed more peripapillary RNFL progression at the inferotemporal area and VF progression at the central area.
We also showed that the VF progression differed between the progressive peripapillary RNFL thinning without macular GCIPL involvement group and the progressive peripapillary RNFL and macular GCIPL thinning group. The PNS is the most common area of VF progression in the eyes exhibiting progressive peripapillary RNFL thinning without macular GCIPL involvement; conversely, the PFS is the most common area of VF progression in the eyes exhibiting both progressive peripapillary RNFL and macular GCIPL thinning. In the progressive peripapillary RNFL and macular GCIPL thinning group, the structural damage occurring in the macula may be more closely related to central VF progression. On the contrary, relatively more peripheral regions of the macula may be impaired in the case of only progressive RNFL thinning, which may result in no definite change in the VF or peripheral VF progression. Similar to our results, Shin et al. [26] reported that GCIPL thickness is more useful for detecting glaucoma in parafoveal VF defects and that peripapillary RNFL thickness is superior to macular GCIPL thickness in identifying patients with glaucoma exhibiting peripheral VF defects. This result indicates that macular GCIPL thickness measurement for detecting glaucoma progression is useful for determining central VF progression, but may be inadequate for detecting peripheral VF progression.
Moreover, our results showed that there are two rates of change in glaucomatous eyes: slow and fast. In the stable group, the rate of peripapillary RNFL change was −0.3 ± 0.5 µm/yr, and that of macular GCIPL was −0.3 ± 0.4 µm/yr, which was similar to the rate of macular GCIPL change in the peripapillary RNFL progression without macular GCIPL involvement group (−0.4 ± 0.4 µm/yr). However, the rates of peripapillary RNFL and macular GCIPL changes in the progressive peripapillary RNFL and macular GCIPL thinning group were −0.9 ± 0.9 µm/yr and −1.0 ± 0.5 µm/yr, respectively. The rate of change of peripapillary RNFL thickness in the progressive peripapillary RNFL thinning without macular GCIPL involvement group was −1.0 ± 0.7 µm/yr, which was similar to that of the progressive peripapillary RNFL and macular GCIPL thinning group. These results are consistent with those of previous studies. Shin et al. [20] reported the rate of peripapillary RNFL change in the progressive group to be −0.93 ± 1.35 µm/yr, and that of macular GCIPL thickness to be −0.92 ± 0.84 µm/yr. Thus, the rate of change in the stable group may be age-related. According to Alamouti and Funk [27], the reduction in peripapillary RNFL thickness in normal subjects was −0.44 µm/yr. Lee et al. [28] reported that the rate of change in thickness in non-progressive RNFL thinning was −0.34 ± 1.41 µm/yr. Previously reported results on changes in GCIPL thickness in normal subjects are also similar. Leung et al. [29] reported that the mean reduction in GCIPL thickness was −0.318 µm/yr; Shin et al. [20] reported similar results (−0.40 ± 0.52 µm/yr).
Progressive macular GCIPL thinning is usually coupled with corresponding progressive peripapillary RNFL thinning during long follow-up periods, especially when the damaged area is located at the inferotemporal retina. However, some retinal nerve fibers located far from the fovea, such as the infero-inferior or supero-superior area, may undergo thinning without detectable macular GCIPL thinning. In a study focusing on the inferior retina in eyes with early glaucoma, Kim et al. [16] and Kim et al. [30] reported that inferotemporal RNFL thinning is usually detected along with corresponding inferior macular GCIPL thinning, but the infero-inferior RNFL change can be detected without any change in the inferior GCIPL thickness. Another study showed that when the angle difference between the fovea and peripapillary RNFL defect increases, abnormal findings are not likely in the macular GCIPL analysis [31]. These findings are consistent with our results that progressive peripapillary RNFL thinning at the 10 and 7 o'clock areas is more strongly related to progressive macular GCIPL thinning than progressive peripapillary RNFL thinning at the 12 and 6 o'clock areas.
Moreover, when structural progression involves the macula, detection duration appears to be shorter. Our statistical analysis showed that detection duration of progressive macular GCIPL thinning was shorter than that of progressive peripapillary RNFL thinning when both progressions were detected. This could explain the difference in detection duration we observed between cluster 2 and cluster 3. In cluster 3, the determining factor may be detection duration of progressive macular GCIPL thinning, which is usually shorter than that of progressive peripapillary RNFL thinning. In cluster 2, however, detection duration is determined by progressive peripapillary RNFL thinning only. A recent study showed that when structural progression exists in the inferior retina, progressive thinning of the inferior macular GCIPL precedes progressive thinning of the corresponding inferior peripapillary RNFL [16], which supports our results.
When comparing the prevalence of structural progression to the stage of glaucoma, the prevalence of progressive peripapillary RNFL thinning was higher than that of progressive macular GCIPL thinning in early glaucoma. This result implies that progressive peripapillary RNFL thinning can occur in the absence of detection of progressive macular GCIPL thinning, particularly in early glaucoma. Therefore, analyses of macular GCIPL, rather than peripapillary RNFL, may facilitate earlier detection of the structural changes that occur as a result of glaucoma progression. However, it may also fail to detect some of the structural changes that peripapillary RNFL analysis can detect.
There are some limitations to this study. First, we analyzed the results of OCT GPA by a pplying topographic criteria. This method has been used in previous studies [28323334], but its efficiency may be limited, especially when progression is detected at the border or in multiple areas. Second, we used linear regression analysis and the Early Manifest Glaucoma Trial guidelines to evaluate the progression of VF. Had we evaluated VF progression using other methods, such as pointwise linear regression analysis, we might have found more VF progressions and performed more elaborate analysis. Third, the retrospective design of this study may have caused some bias. This also prevented us from analyzing the relationship between vessel density and glaucoma progression, which has been getting more attention due to the emergence of OCT angiography as a non-invasive technique for imaging retinal blood vessels [35]. Fourth, although the total number of participants is not small, the number of participants per group may be insufficient for statistical analyses of the stage of glaucoma or of individual clusters. Finally, as we defined glaucomatous eyes by the appearance of optic discs and RNFL defect, there might be an innate bias favoring RNFL parameters.
In conclusion, using hierarchical cluster analysis, we categorized the structural progression of glaucoma into three groups: stable, progressive peripapillary RNFL thinning without macular GCIPL involvement, and progressive peripapillary RNFL and macular GCIPL thinning. In the progressive peripapillary RNFL and macular GCIPL thinning group, inferotemporal RNFL defects and central VF progression were observed more frequently. Our study suggests that when analyzing structural progression using OCT GPA, performing only macular GCIPL analysis may not be sufficient for detecting progression.
 XML Download