

 PDF
PDF ePub
ePub Citation
 Print
Print


Nystagmus is primarily an oculomotor disorder involving involuntary oscillation of the eyes, often leading to reduced visual acuity due to the excessive motion of images on the retina or the movement of images away from the fovea. Nystagmus is divided into infantile nystagmus (IN), which is usually seen in the first 3 to 6 months of life, and acquired nystagmus. IN may be idiopathic (previously described as congenital motor nystagmus) or associated with retinal or optic nerve maldevelopment (sensory nystagmus). Disorders commonly associated with IN include albinism, retinal dystrophies, aniridia, achromatopsia, congenital cataracts and optic nerve hypoplasia [123]. The prevalence of IN is estimated to be 14 per 10,000 [4]. The mechanisms underlying IN are not yet understood in detail. Some hypotheses and models have been proposed, with emphasis on the ocular motor circuitry [5].
Amblyopia is another disease that results in childhood visual deficits. It is defined as a best spectacle-corrected visual acuity less than 6 / 9 on the Snellen chart or at least a two-line difference in logarithm of the minimum angle of resolution between the two eyes of an individual. This measured deficit may not be directly related to structural abnormalities of the eye and cannot be improved solely by correcting refractive error. It usually affects one eye, but it can sometimes be bilateral. Anisometropia, high refractive errors, strabismus, media opacities or their combinations are common causes of amblyopia. The prevalence of amblyopia is 2% to 4% [67]. Amblyopia is attributed to either abnormal binocular interactions or visual deprivation. It is thought that this condition develops during the time of neuronal development of the retina and the cerebral cortex. The areas involved in amblyopia are under investigation [8].
The human central nervous system contains high concentrations of N-acetyl aspartate (NAA), particularly within neurons. NAA is thought of as a sign of neuronal and axonal integrity, although the exact physiologic role of NAA is undetermined [910]. A decrease in NAA level is usually thought of as a marker of neuronal loss or dysfunction [1112]. Its decrease mostly occurs during disease progression. Creatine (Cr) is a marker for energy metabolism in the brain. It is usually used as an internal standard due to its stable concentration throughout the brain and because it is resistant to change in some degenerative brain diseases [9131415]. Choline (Cho) reflects the total Cho-containing compounds in brain tissue, including phosphocholine, glycerophosphocholine and phosphatidylcholine. Cho is important in the synthesis and degradation of cell membranes, so it is considered a sign of membrane turnover. Higher levels of Cho occur in disease states with increased cell number, increased membrane synthesis or increased membrane breakdown. This membrane turnover in adulthood usually occurs in pathological conditions, such as demyelination and malignant tumours [91617].
Magnetic resonance spectroscopy (MRS) is increasingly being used to diagnose brain diseases. It is a non-invasive method that measures the values of certain biochemical compounds in brain tissue, such as NAA, Cr, Cho and lipids [131819]. Behar et al. [20] obtained the first spectroscopy results of the brain in 1983 at Yale University. In 1994, in the first study of MRS in ophthalmology, Berkowitz et al. [21] researched lactate concentrations in the vitreous of rabbits. Later, in 2003, Rucker et al. [22] researched lactate concentrations in the vitreous of four healthy individuals and a patient with optic neuropathy using MRS.
The main aim of our study was to determine whether there is any change in the amount of some metabolites in the occipital cortex of patients with idiopathic IN using MRS. We found a significantly higher Cho/Cr ratio in the occipital cortex of patients with idiopathic IN compared to normal individuals. We also studied patients with bilateral ametropic amblyopia, which causes visual deficits in both eyes such as nystagmus, to determine whether increased Cho in the occipital cortex is due to visual deficits or other causes in patients with idiopathic IN.
Materials and Methods
This prospective study included 11 patients with idiopathic IN, 10 patients with bilateral ametropic amblyopia and nine healthy children who came to our clinic for refraction examination. All participants were enrolled from a single center. The patients with idiopathic IN were classified as group 1, and their ages ranged from 4 to 16 years. The patients with bilateral ametropic amblyopia were classified as group 2, and their ages were between 4 and 17 years. The healthy children were defined as group 3, and their ages were between 5 and 13 years. The total study period was 6 months. Before the study, written informed consents were obtained from the parents of each child for both the study and publication of the images. The study protocol was approved by the institutional review board at Inonu University (approval no. 2007/68), and the study was conducted according to the ethical standards outlined in the Declaration of Helsinki.
Patients with nystagmus were evaluated by the department of pediatrics to exclude a possible secondary cause of nystagmus. Two children with nystagmus were not included in the study due to central nervous system pathologies (one was suspected of having a brain tumor and the other had a suspected vascular lesion). The primary inclusion criterion for patients in group 1 was the presence of idiopathic IN (motor nystagmus). Idiopathic IN was defined as nystagmus that appeared in the first 3 to 6 months of life and was not associated with any other ocular, systemic or neurological diseases. The principal inclusion criterion for patients included in group 2 was the presence of bilateral ametropic amblyopia. The diagnosis of bilateral ametropic amblyopia was based on the following criteria: (1) no difference in refractive status between the two eyes; (2) <2 Snellen visual acuity lines difference in best-corrected visual acuity (BCVA) between the two eyes; (3) distance BCVA ≤20 / 30 in each eye and with any of the following refraction errors: hyperopia ≥3.00 diopters (D), astigmatism ≥2.00 D or myopia ≥6.00 D; and (4) no history of strabismus. Group 3 included children with no ocular pathology. The exclusion criteria included individuals with at least one of the following conditions: previous ocular surgery or trauma history, corneal and lens pathologies preventing ocular fundus examination, strabismus, posterior segment pathologies, a history of preterm birth and systemic or neurological diseases.
A complete ophthalmic examination was performed for all participants. It included uncorrected and best spectacle- corrected visual acuity by the Snellen chart, cycloplegic refraction, slit lamp examination and fundus inspection. The BCVAs of all children were assessed using a Snellen E letter acuity chart. Magnetic resonance imaging examinations were performed under sedation in children who were under 6 years of age.
MRS technique
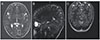
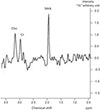
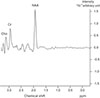
Before MRS, routine conventional magnetic resonance images were obtained for each individual (Gyroscan Intera Master; Philips, Best, The Netherlands). Axial T1A (TR 450 ms, TE: 10 ms), axial T2A (TR 4366 ms, TE: 120 ms), coronal FLAIR (fluid-attenuated inversion recovery) (TR 6000 ms, TE: 110 ms, TI: 2000) and sagittal T2A (TR 4366 ms, TE: 120 ms) views were obtained. The thickness of sections was 4 mm, and there were three signal averages. A single-voxel MRS examination was performed by placing a region of interest on the occipital cortex (Fig. 1). When placing the region of interest, attention was paid to ensure there was no contact with bone, vessels, air or fat. Single-voxel MRS was performed in all individuals using the PRESS (point resolved surface coil spectroscopy) method. Shimming was performed prior to MRS to optimize field homogeneity. The water signal was suppressed with a chemical-shift selective saturation pulse. A spectral sweep width of 1,000 Hz was used, with a data size of 1,024 points. After the spectral pattern was obtained, baseline and phase correction processes were applied in all cases. A spectrum obtained from the occipital cortex of a patient with idiopathic IN is shown in Fig. 2, and a spectrum obtained from the occipital cortex of a patient with bilateral ametropic amblyopia is shown in Fig. 3.
Data assessment
After completion of the MRS process, the spectrum was evaluated by two radiologists based on the agreement principle. Resonance peaks in the spectrum were determined as follows: NAA, 2.0 parts per million (ppm), Cr, 3.02 ppm and Cho, 3.2 ppm. The area under the peaks was measured automatically by marking the lower borders of the peaks. The amounts of NAA, Cr and Cho were measured in the occipital cortex of all participants. Then, NAA/Cr and Cho/Cr ratios were calculated in all participants.
Statistical analysis
Statistical assessment was performed with IBM SPSS Statistics ver. 20.0 (IBM Corp., Armonk, NY, USA). Measurable data were calculated as mean ± standard deviation. The measurable data did not have a normal distribution according to the results of the Shapiro-Wilk test. Therefore, the Kruskal-Wallis test, Mann-Whitney U-test, and chi-square test were used to compare the data. A p-value less than 0.05 was considered significant.
Results
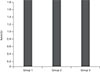
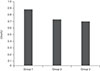
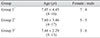
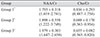
This study included 11 children with idiopathic IN, 10 children with bilateral ametropic amblyopia and nine normal children. The demographic characteristics of groups 1, 2 and 3 are summarized in Table 1. There were no statistically significant differences in mean age or sex between the three groups (p = 0.92, p = 0.40, respectively). The mean NAA/Cr and Cho/Cr ratios of the occipital cortex in groups 1, 2 and 3 are presented in Table 2. The mean NAA/Cr a nd Cho/Cr ratios of the three groups a re also shown diagrammatically in Fig. 4 and 5, respectively.
There was no statistically significant difference in the NAA/Cr ratio between groups 1 and 3 (p = 0.07), but there was a statistically significant difference between these groups when the Cho/Cr ratios were compared (p = 0.008); the ratio was higher in group 1. There was no statistically significant difference in the NAA/Cr ratio between groups 1 and 2 (p = 0.706). There was also no statistically significant difference in the Cho/Cr ratio between these groups (p = 0.174). We found no statistically significant differences in NAA/Cr or Cho/Cr ratios between groups 2 and 3. The p-values were 0.303 and 0.167, respectively.
Discussion
The pathogenesis of idiopathic IN has not been clearly explained. Many authors think that the disease arises from abnormal control by the part of the brain responsible for ocular motor systems, although there is very limited evidence to support this idea. There is no curative treatment for idiopathic IN [2324].
Amblyopia is a neurological disorder of vision which is thought to result from abnormal binocular interaction or visual deprivation during the first 2 to 3 years of childhood. Although some early reports suggested that the retina may be the primary site of pathology in amblyopia, later reports stated that the primary site of neural loss in amblyopia appears to be in the primary and secondary visual cortices [2526].
Boucard et al. [13] showed that NAA levels in the occipital cortex of patients with progressive visual field defects (age-related macular degeneration and glaucoma) were similar to the NAA levels in a control group. They concluded that the progressive retinal visual field defects did not cause any difference in NAA metabolite concentration in the occipital cortex. They attributed the absence of a reduction in NAA concentration to there being no ongoing degeneration in the occipital cortex of patients with age-related macular degeneration and glaucoma or the slow progression of both diseases, which may prevent detectable changes. They found no significant differences in Cr and Cho concentrations between the groups. Zhang et al. [16] reported that both the NAA/Cr and Cho/Cr ratios were decreased in both the geniculocalcarine and striate areas in patients with glaucoma compared with a control group. They concluded that primary glaucoma affects the concentrations of metabolites in both the geniculocalcarine and striate areas, suggesting an ongoing neurodegenerative process. In another study, Weaver et al. [17] found no significant differences in NAA concentrations in the occipital cortex between early blind and sighted individuals. Mangia et al. [27] reported that long-standing type 1 diabetes mellitus likely does not substantially affect the brain neurochemical profile in either white matter or grey matter as measured by MRS. They found lower NAA and glutamate concentrations in the occipital grey matter of patients with type 1 diabetes mellitus, and they thought that this may represent partial neuronal loss or dysfunction as a consequence of long-term type 1 diabetes mellitus.
In the present study, the NAA/Cr ratios in the occipital cortex were lower in both patients with idiopathic IN and patients with bilateral ametropic amblyopia than in normal subjects, but these differences were not statistically significant. If the sample sizes of our groups were larger, these differences may have been statistically significant.
Boucard et al. [13] found no changes in Cho concentration in the occipital cortex of patients with progressive visual field defects (age-related macular degeneration and glaucoma) when compared with controls. They concluded that visual field defects do not cause cortical metabolic changes. Zhang et al. [16] reported that the Cho/Cr ratio was reduced in both the geniculocalcarine and striate areas of glaucoma patients when compared with a control group. They thought this decrease was associated with the ongoing neurodegenerative process in glaucoma. Weaver et al. [17] showed that early blind subjects had significantly higher concentrations of both Cho and Cr within the occipital cortex when compared with sighted subjects, but this resulted in no significant change in the ratio because of higher measured levels for both metabolites. In another study, Coullon et al. [28] found an elevated Cho level in the pericalcarine cortex in patients with bilateral anophthalmia and explained this increase by altered cholinergic pathway activity and an increase in the number of cells (or an increase in the grey matter proportion) in anophthalmic subjects.
In the present study, we found a statistically significant difference between patients with idiopathic IN and normal children when the Cho/Cr ratios of the occipital cortex were compared; the ratio was higher in the idiopathic IN group. In the brain, the resonance peak for Cho occurs at 3.2 ppm and represents the total Cho-containing compounds, including phosphocholine, glycerophosphocholine and phosphatidylcholine [29]. Cho is a component of phospholipid metabolism of cell membranes and a marker for membrane turnover. Increases in Cho concentrations probably indicate increased membrane synthesis and/or an increased number of cells [2930]. Our literature review did not identify any studies evaluating the amount of Cho in the occipital cortex in patients with idiopathic IN. Hufner et al. [31] found an increase in grey matter volume in congenital nystagmus. Therefore, we think that the increased Cho level in the occipital cortex may be due to an increase in the volume of grey matter (or an increase in the number of cells) in patients with idiopathic IN. However, this hypothesis needs to be supported by volumetric measurements.
The present study has some limitations. First, the number of participants included in each group was small. Second, we studied only three biomarkers, specifically metabolites, whereas MRS studies of the brain in the literature often studied the glial metabolite, myo-inositol, the neurotransmitters, glutamate and gamma-aminobutyric acid, or the antioxidants, glutathione and ascorbate. Third, the lack of subsequent control MRS examinations in each individual to monitor changes in the metabolite concentrations over time is another limitation, especially in patients with bilateral ametropic amblyopia that often improves if it is diagnosed early enough and optically corrected. Therefore, it would seem that one should expect subsequent MRS in children with bilateral ametropic amblyopia to be similar to that in normal children. Finally, we did not measure the volume of the area evaluated for its metabolite concentrations. If we had performed these volumetric measurements, we may have gained data to support our hypothesis regarding elevated Cho levels in patients with idiopathic IN.
In conclusion, our results suggest that bilateral ametropic amblyopia does not have a profound effect on the neurochemical profile of the occipital cortex, but the neurochemical change we described in idiopathic IN may suggest structural changes in the occipital cortex. Further studies with a greater number of individuals will be needed to explain the relationship between this neurochemical difference and structural changes in the occipital cortex of patients with idiopathic IN. It would also be interesting for future studies to examine the lateral geniculate nucleus and the cerebellum, which is thought of as the most important part of the brain in ocular motor control.
 XML Download