

 PDF
PDF ePub
ePub Citation
 Print
Print


Glaucoma is an optic neuropathy characterized by visual field loss and optic nerve damage resulting from retinal ganglion cell death. Because visual field loss and optic nerve damage is often asymptomatic in the early stages of glaucoma, detecting the damage as early as possible is important to prevent the progression of the disease. For this reason, numerous functional and structural tests have been used to detect glaucoma.
One of the most sensitive parameters in detecting glaucomatous optic neuropathy is the observation of a defect in the retinal nerve fiber layer (RNFL), which is largely composed of axonal fibers of the retinal ganglion cells [12345]. In early stage glaucoma, structural changes in the RNFL often precede visual field loss when measured with standard achromatic perimetry [67], and serial RNFL examinations are known to be more sensitive than a visual field test in detecting progression of glaucomatous optic neuropathy. Recently, RNFL imaging techniques such as scanning laser polarimetry, confocal scanning laser ophthalmoscopy (CSLO), and optical coherence tomography (OCT) have been increasingly used in clinical practice and are rapidly evolving [8]; however, red-free photographs using flash fundus cameras with green filters remain a useful tool for detecting glaucoma.
In this study, we obtained high-quality imaging using an F-10 CSLO machine (Nidek, Gamagori, Japan). The F-10 is commercially available and can produce digital, high-resolution fundus reflectance images. Because this machine is equipped with four different laser sources, including blue (490 nm) and green (532 nm) lasers, we could perform both blue and green CSLO imaging. The purpose of this study was to detect RNFL defects with CSLO imaging using both blue and green laser sources and to compare the image qualities between laser wavelengths.
Materials and Methods
Study design and participants
We retrospectively reviewed 181 eyes of 91 patients referred to Hanyang University Hospital with suspected glaucoma from August 2009 through September 2011 (one eye could not be examined due to severe trauma-induced corneal opacity). On their first visit, each patient underwent a complete ophthalmic examination for the presence of glaucoma. The exam included obtaining a stereoscopic optic disc photograph, CSLO imaging using both blue and green laser sources, time-domain OCT (TD-OCT), spectral-domain OCT (SD-OCT), and a Humphrey Visual Field (Carl Zeiss Meditec, Dublin, CA, USA) examination with the Swedish Interactive Threshold Algorithm 30-2 protocol.
TD-OCT was performed using a Stratus OCT (Carl Zeiss Meditec, Dublin, CA, USA), and SD-OCT was performed using a 3D OCT-2000 (Topcon, Tokyo, Japan). During the Stratus OCT image acquisition process, the Fast RNFL thickness acquisition protocol (three consecutive circumferential scans with a diameter of 3.4 mm centered on the optic disc) was used. During the 3D OCT-2000 image acquisition process, the 3D disc scan protocol was used (6.0 × 6.0 mm scan centered on the optic disc, circumpapillary RNFL thickness measured on a 3.4-mm diameter circle, and averages computed for 4, 12, and 36 sectors).
The diagnosis of glaucoma was based on the presence of glaucomatous visual field loss as measured by the Humphrey Visual Field examination and the presence of typical glaucomatous optic disc damage or RNFL defects as judged by stereoscopic optic disc photographs (i.e., localized or diffuse neuroretinal rim thinning, increased cupping or a cup-to-disc ratio difference >0.2 between the eyes) and red-free fundus imaging examined by a glaucoma specialist. The glaucoma specialist also used RNFL thickness maps from TD-OCT and SD-OCT as supportive tools to aid in glaucoma diagnoses. The RNFL defects on SD-OCT images were defined as ≤1 sector at <5% of the normal circumpapillary RNFL thickness.
A normal visual field was defined as having a mean deviation and pattern standard deviation within 95% confidence limits and a glaucoma hemifield test result within normal limits. Glaucomatous visual field defects were defined as those with a cluster of three points with probabilities of <5% on the pattern deviation map in at least one hemifield, including at least one point with a probability of <1%; or a cluster of two points with a probability of <1%, and a glaucoma hemifield test result outside 99% of age-specific normal limits or a pattern standard deviation outside 95% of normal limits.
This study was approved by the institutional review board of Hanyang University Medical Center (2019-03-020). and followed the tenets of the Declaration of Helsinki. Informed consent was waived due to the retrospective nature of the study.
Interpretation of CSLO imaging
CSLO imaging was taken with a commercially available CSLO, the F-10. We used blue (490 nm) and green (532 nm) laser sources to obtain two consecutive CSLO images. The size of the scanning field was wide-angle 60 degrees.
All three authors interpreted the CSLO images and decided whether the RNFL defect was better detected with the blue images or green images. Because we focused on image quality, the quantitative features of the RNFL defect were ignored and only the presence or absence of a defect was evaluated. If an RNFL defect was suspected on an image but was unclear, it was classified as being present. After defects were identified, observers decided which imaging source provided better visibility of the RNFL defect or if there was no difference in image quality. If the authors' results differed, the majority of authors' results were applied. The examiners were masked to the type of laser and to the results of other examiners. We performed image examinations in a fully masked fashion.
After the images were interpreted, we compared patient characteristics between the blue better (B-better) and green better (G-better) groups. Best-corrected visual acuities were obtained using the Snellen eye chart and then converted to the logarithm of the minimum angle of resolution scale. To determine cataract severity, we classified lens status into four groups based on the Lens Opacity Classification System, version III (LOCS III). Cataracts were classified as follows: pseudophakic or clear lens, mild, moderate, and severe. All ophthalmic examinations including LOCS III cataract classification were performed during the initial visit. The signal strength of the Stratus OCT and the image quality factor of the 3D OCT-2000, which represent image qualities, were compared between the two groups.
Statistical methods
To determine the discrimination power of blue and green CSLO imaging for detecting RNFL defects, areas under the receiver operating characteristic curve (AUCs) were calculated. Significant differences between AUCs were assessed using the method described by DeLong et al. [9]. Reproducibility of CSLO imaging interpretation was assessed by calculating the kappa value. Kappa values were calculated between each of two graders. Statistical significance between groups was tested using the Kruskal-Wallis test for continuous variables and chi-square test for categorical variables. Post-hoc analysis was performed using a Mann-Whitney U-test for continuous variables and chisquare test for categorical variables. A p-value of <0.05 was considered statistically significant in all analyses. We used PASW Statistics ver. 18.0 (SPSS Inc., Chicago, IL, USA) and Medcalc ver. 14.8.1 (Medcalc, Mariakerke, Belgium) to perform statistical analyses.
Results
Of the 181 eyes that were analyzed, 73 were diagnosed with glaucoma (either primary open angle glaucoma or normal tension glaucoma), and had RNFL defects that were confirmed with SD-OCT. Of those 73 eyes, RNFL defects were detected in 55 using blue or green CSLO imaging. Patients with unclear RNFL defects were excluded. Definite localized RNFL defects were detected in 55 eyes (75.3%) with blue CSLO imaging and 53 eyes (69.9%) with green CSLO imaging. Between-grader agreement is presented in the Supplemental Table 1 as kappa values.
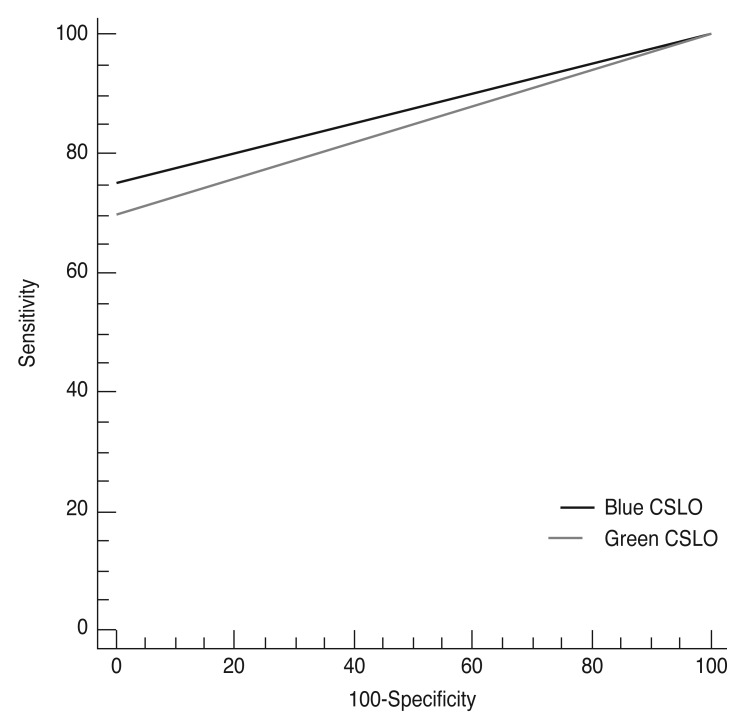
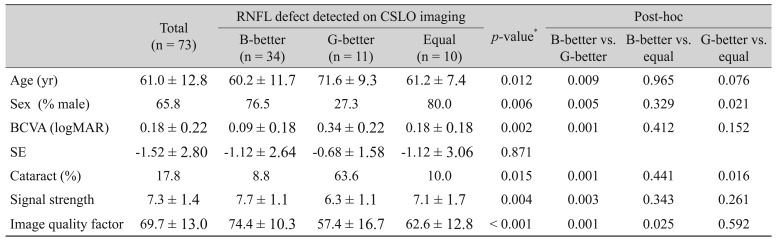
Values for AUC, sensitivity, and specificity for discriminating between non-glaucoma controls and eyes with RNFL defects using blue or green CSLO imaging are documented in Table 1. Both blue and green CSLO imaging showed high discriminating ability for RNFL defects (blue CSLO: AUC 0.877, sensitivity 75.3%, specificity 100.0%; green CSLO: AUC 0.849, sensitivity 69.9%, specificity 100.0%). The ability of blue CSLO to discriminate RNFL defects was significantly superior than that of green CSLO (p = 0.004) (Fig. 1).
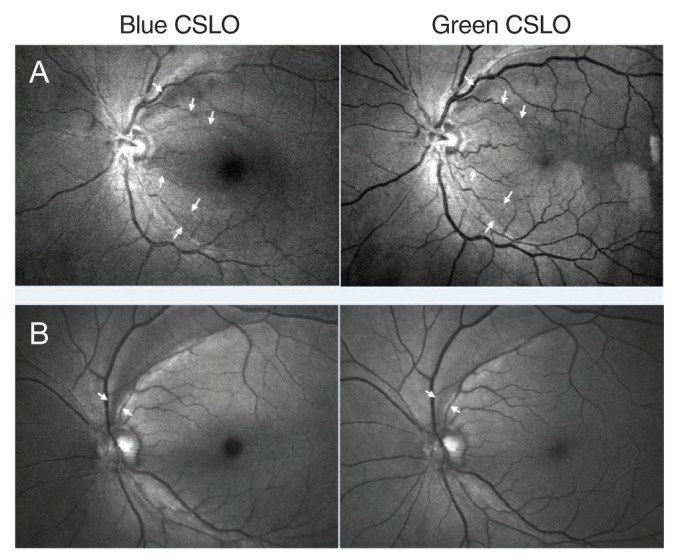
Among the 55 eyes with definite localized RNFL defects, the defect was better visualized with blue imaging (B-better group) in 34 eyes (61.8%), and was better visualized with green imaging (G-better group) in 11 eyes (20%). The RNFL defect was equally visualized with both CSLO imaging sources in 10 eyes (18.2%). Representative cases of the B-better group and G-better group are shown in Fig. 2A, 2B and 3A, 3B, respectively. Demographic data and image quality indices of OCT for all enrolled eyes, the B-better group, the G-better group, and the equal group are shown in Table 2. Statistical comparisons and p-values for the B-better and G-better groups are shown in Table 2. Age, gender, best-corrected visual acuity, the proportion of severe cataracts, signal strength of TD-OCT, and the image quality factor of SD-OCT were significantly different between groups (p = 0.009, 0.005, 0,001, 0.001, 0.003, and 0.001, respectively).
Discussion
Red-free light ophthalmoscopy of the RNFL was first reported by Vogt in 1913, and red-free imaging of the RNFL was first introduced in 1965 [101112]. The detailed pattern of the RNFL is difficult to observe by conventional photography due to its transparency [112], and many investigators have attempted to increase its visibility by improving photographic procedures using different films, filters, cameras or processing procedures [15101112131415161718]. The visibility of the RNFL depends on two major factors: the degree of background pigmentation and the remaining RNFL thickness [18]. Using the conventional red-free imaging technique, the filter highlights the reflectance from the RNFL and minimizes reflectance from the deeper retinal structures [1718]. Many studies have investigated the best wavelength with which to illuminate the RNFL, and wavelengths ranging from 400 to 580 nm are preferred [1112131415]. Historically, red-free imaging using a flash fundus camera with a green filter has been widely used for glaucoma examinations.
More recently, some researchers have attempted to replace the conventional red-free imaging technique. Han and Park [19] reported digitally converted, non-mydriatic, red-free imaging to be an effective alternative to conventional red-free fundus photographs, and Hong et al. [20] and Hong et al. [21] evaluated RNFL defects using CSLO photographs (Heidelberg Retina Angiograph [HRA] 1 with a 488-nm light source [Heidelberg Engineering, Heidelberg, Germany]). The CSLO technique is now widely used in the glaucoma field for topographic mapping of the retinal surface, especially to map the optic nerve head (ONH) and to estimate the RNFL thickness around the ONH using the Heidelberg Retina Tomograph (HRT, Heidelberg Engineering) [822]. However, there have been few studies investigating the use of CSLO with RNFL imaging [2223].
For this study, we used a commercially available CSLO that could provide both blue (490 nm) and green (532 nm) imaging. Previous studies have compared RNFL image qualities with different filters on a conventional flash fundus camera [111224]; however, only one previous report compared blue and green CSLO RNFL imaging, and that article was in German [25]. Both blue and green CSLO imaging were sufficient in detecting the RNFL defect (Table 1), and the blue CSLO imaging source was significantly better than the green source at detecting the RNFL defect (p = 0.004) (Fig. 1). The CSLO illuminates only a small area of the retina using a laser beam, and by positioning the confocal apertures in front of the detector, scattered light can be reduced [262728]. It is well known that the CSLO imaging is superior to conventional photographs in detecting glaucoma, even in eyes with cataracts, because of the CSLO's high laser beam collimation and scanning illumination of the retina [26]. Our results are consistent with this evidence and revealed that CSLO imaging with both blue and green lasers can provide high-quality imaging of RNFL defects.
Among the 55 eyes in which an RNFL defect was detected via CSLO imaging, the defect was found using blue imaging in all 55 eyes, but not all defects were found using green imaging. Furthermore, among the 55 RNFL defect-detected eyes, 34 (61.8%) were included in the B-better group (Fig. 2). These results indicate that blue CSLO imaging is superior to green CSLO imaging for the visualization of RNFL defects. The wavelength of the blue laser (490 nm) is shorter than that of the green laser (532 nm), and short wavelengths can reveal more superficial layers of the retina. The shorter wavelength of the blue laser penetrates only the inner half of the sensory retina, and is suitable for observing RNFLs. The longer wavelength of the green laser also penetrates the sensory retina, but the retinal pigment epithelium can be a barrier to light, making the green laser more suitable for the observation of retinal vasculatures found deeper than the RNFL [10]. Notably, these results are consistent with those found in a previous report performed with conventional red-free imaging using various filters [12].
In the G-better group, the quality of blue CSLO imaging was low due to noise, which made green imaging relatively better (Fig. 3). We compared demographics and image quality indices of OCT between the two groups. Best-corrected visual acuity was significantly worse, and the proportion of severe cataracts was significantly higher in the G-better group compared with the B-better group. Also, image quality indices were significantly lower for both TD-OCT and SD-OCT in the G-better group which could be explained by the higher media opacity in the G-better group compared with the B-better group. However, low image quality indices on OCT cannot be directly associated with the degree of media opacity. Some eyes with severe cataracts or corneal opacity were included in the G-better group (Fig. 3). Hazy media from corneal opacity, cataracts, or the vitreous humor could cause more scatter of the blue laser compared with the green laser because shorter wavelengths naturally tend to scatter more [12]. In addition, the mean patient age was significantly higher in the G-better group, and our results could therefore be explained by the fact that media opacities, including cataracts, progress as a normal part of the aging process. Another possible explanation is that blue laser reflection from the RNFL can be attenuated due to generalized age-related RNFL thinning [29]. The proportion of males was significantly lower in the G-better group, but because no gender differences in RNFL thickness have been previously reported, other factors to explain the differences between the B-better and G-better groups must be considered in future studies [30]. Also, differences between the B-better and G-better groups could not be generalized due to small sample sizes, especially for the G-better group.
In addition to using the F-10, we also attempted to detect RNFL defects with CSLO imaging using the HRA2 Spectralis with a 488-nm wavelength source (Heidelberg Engineering). The HRA2 showed RNFL defects as well as the F-10, but the light reflex shown in the red-free mode was enlarged in wide-angle mode and made interpretation difficult. The red-free mode of the HRA2 was also influenced by tearing status, which produced lace-like lines on the image. In addition to considering the HRA2, we also considered the HRT as an RNFL imaging source. Of the CSLOs widely used in the glaucoma field, the HRT is primarily focused on topographic mapping of the retinal surface and is generally used to map the ONH with a 670-nm wavelength. The key limitation of the HRT as a RNFL imaging source is that the scanning field is relatively small (15 degrees), and the clarity of the reflectance image also depends on the scan centration. Recently, Ye et al. [22] reported poor agreement of the RNFL defect measurements from CSLO RNFL imaging between the HRT3 and OCT. Importantly, the F-10 used in our study did not have a light reflex in the red-free mode in the large, 60-degree scanning field, and the F-10 was not affected by tearing status. Future studies comparing the red-free modes of different CSLO devices are necessary.
There are several limitations of the current study. First, our study only focused on image quality, and we did not evaluate quantitative aspects of the RNFL defects. Detection capacity as a diagnostic tool must be evaluated and compared with other established diagnostics by statistical analyses, but we only evaluated RNFL defects among eyes with glaucoma and compared detection rates between blue and green CSLO imaging. Second, we did not compare CSLO imaging with conventional red-free imaging using a flash fundus camera and green filter. This comparison could determine which imaging technique is superior for detecting RNFL defects. Third, all enrolled patients were Asian, so applying these results to other ethnicities may not be appropriate. Because Asians have thick RNFLs and hyperpigmented retinas, red-free imaging shows RNFL defects well. Reflection from the thicker RNFL is prominent, and reflection from the deeper hyperpigmented retina is less visible [18]. Further studies to supplement the results of the current study are needed.
In conclusion, both blue and green CSLO imaging was useful in the detection of RNFL defects. Blue CSLO imaging was superior to green in visualizing RNFL defects in most of the patients with clear media, but green was valuable in some patients whose media was more opaque. Combined use of both imaging techniques could be valuable in a clinical setting.

 XML Download