

 PDF
PDF ePub
ePub Citation
 Print
Print


Macular holes, which are characterized by defects of the neurosensory retina and cystic changes in the macula, cause central visual disturbances [1]. Knapp [2] reported the first macular hole in 1869. More than 100 years later, Gass [3] revealed that the cause of idiopathic macular holes is vitreomacular traction on the fovea in a tangential direction. Gaudric et al. [4] and Hee et al. [5] proposed the use of vitrectomy, which removes vitreomacular traction, as a successful treatment of macular holes.
Optical coherence tomography (OCT) is widely used to study macular disease because it displays the cross-sectional image of the retina at a high resolution and enables the quantitative evaluation of macular thickness. OCT recently evolved from the time domain to the spectral domain. Spectral-domain OCT (SD-OCT) results in images using Fourier transformation after the spectrum of the light through the interferometer is accepted by the spectrometer. This procedure can obtain more images in a shorter time as compared with time-domain OCT. In addition, with advanced image processing techniques, accurate analysis has been made possible by autosegmentation of each layer of the macula. According to the results of some investigations completed using autosegmentation, macular hole geometry and the extent of ellipsoid zone band defects are associated with postoperative visual acuity [6,7].
SD-OCT exhibits high repeatability and reproducibility in measuring the thickness of macular and peripapillary retinal nerve fiber layers (RNFLs) [8]. Quantitative measurement of the macular ganglion cell and inner plexiform layer (GCIPL) was recently made possible. The measurement of GCIPL autosegmentation is broadly used in various fields of ophthalmology. Mwanza et al. [9] and Mwanza et al. [10] found that the thickness of the GCIPL is useful for the evaluation of structural changes in the retina and provides critical information for the early diagnosis of glaucoma. In addition, Moon et al. [11] evaluated changes in the thickness of the GCIPL caused by various types of brain lesion in patients with visual impairment.
Mwanza et al. [10] and Francoz et al. [12] reported that automated measurement of the thickness of the GCIPL in normal and glaucomatous eyes exhibits a high level of repeatability; thus, the thickness of the GCIPL is useful for examining the progress of glaucoma. Furthermore, retinal changes can affect measurement repeatability; in particular, the thickness of the GCIPL as measured through the segmentations of the retina may be measured inaccurately. Some studies have shown that autosegmented measurements exhibit a high tendency to be erroneous in nonhealthy patients [6,7,13].
However, to our knowledge, no studies to date have examined the measurement repeatability of the GCIPL thickness in eyes with macular hole. Since macular hole shows structural abnormality only in the macula, it is thought to be adequate for studies on the effects of macular disease on GCIPL measurement. We assumed that GCIPL measurement would be different according to macular defect by hole size.
Therefore, using SD-OCT, we evaluated the measurement repeatability of the central macular thickness, peripapillary RNFL thickness, and GCIPL thickness in patients with idiopathic full-thickness macular holes. We compared these findings with those of normal eyes.
Materials and Methods
This prospective cohort study was approved by the institutional review board of Chungnam National University Hospital. The procedures used adhered to the tenets of the Declaration of Helsinki. The institutional review board of Chungnam National University Hospital also approved the prospective collection of data from the medical charts of patients with and without retinal diseases (2012-05-007). Prior to macular hole surgery, written informed consent was obtained not only for the surgery but also for the use of patients' data for future research studies.
Materials
The present study was carried out from June 2012 to October 2014. Patients who visited the retina clinic of Chungnam National University Hospital and who were diagnosed with unilateral idiopathic macular holes without participating ophthalmic history were included in this study. A detailed medical history as well as uncorrected visual acuity, best-corrected visual acuity, intraocular pressure using noncontact tonometry, funduscopy, fundus photography, and OCT findings were obtained from all of the patients (85 patients). Patients with axial lengths shorter than 23.60 mm and longer than 25.55 mm were excluded because these patients require the adjustment of measurements by SD-OCT [14]. Patients with a history of intraocular surgery, ocular trauma, diagnosis of other ophthalmic diseases in addition to macular holes (including retinal disease, glaucoma, and optic nerve disease), and those with OCT signal strength under 5 were excluded from this study [15].
OCT measurement
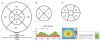
A macular cube 512 × 128 combination scan mode and an optic disc cube 200 × 200 scan mode were performed by an experienced examiner using SD-OCT (Cirrus HD-OCT; Carl Zeiss Meditec, Jena, Germany). Full-thickness and GCIPL were analyzed in the macular cube scans, while RNFL was analyzed in the optic disk cube scans. The measurement was repeated twice in five-minute intervals to examine the measurement repeatability. The macular cube 512 × 128 combination scan mode was analyzed after dividing it into a central circle, inner ring, and outer ring with diameters of 1, 3, and 6 mm, respectively, based on the center of the macula using a retinal map automated analysis system from the Cirrus HD-OCT software ver. 6.0.1. The scan was divided into the nine Early Treatment Diabetic Retinopathy Study subfields—specifically, the central macular subfield and the inner and outer superior, temporal, inferior, and nasal subfields (Fig. 1A) [16]. The RNFL was analyzed with respect to its average thickness and four areas obtained from the optic disc cube 200 × 200 scan mode (i.e., superior, temporal, inferior, nasal) (Fig. 1B).
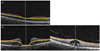
The thickness of the GCIPL was measured using a ganglion cell analysis algorithm, which is a software system within the Cirrus HD-OCT ver. 6.0.1. Based on the three-dimensional information obtained from the macular cube scan, the thickness of the GCIPL was measured by detecting the boundaries of the outer boundary of the nerve fiber layer and the outer boundary of the inner plexiform layer (Fig. 1C, 2A, 2B). All measurements were determined automatically on a pixel-by-pixel basis for all of the SD-OCT images using an intraretinal layer automated segmentation method. Focusing on the fovea and after excluding internal ovals with a horizontal diameter of 1.2 mm and a vertical diameter of 1.0 mm, the average, minimum value, and six sectors (i.e., the superior, superotemporal, superonasal, inferior, inferonasal, and inferotemporal areas) were measured in the annulus with a horizontal diameter of 4.8 mm and a vertical diameter of 4.0 mm (Fig. 1C).
Each patient's affected eye was compared with their opposite normal eye. The affected eyes were divided into two groups according to the size of the macular hole. The areas with macular hole measuring <400 and ≥400 µm were classified into groups A and B, respectively, to analyze the influence of hole size on measurement. The size of the macular hole was defined as the base diameter from the retinal pigment epithelium, and the measurement was performed on both vertical and horizontal tomography, crossing the center of the macular hole on SD-OCT. The average measurements of the maximum horizontal and vertical diameters were used for analysis.
Statistical analysis
Analyses were performed with the PASW Statistics ver. 18.0 (SPSS Inc., Chicago, IL, USA). When comparing the affected eye and the normal fellow eye, Student's t-tests were used. In the comparison between groups A and B, Pearson's chi-squared test and Student's t-test were used. We employed the average measurement in the comparison. The intraclass correlation coefficient (ICC), coefficient of variation (COV), and test-retest variability (TRV) were calculated to determine the repeatability of consecutively measured thicknesses of the central macula, RNFL, and GCIPL. ICC is the correlation between two variables measured at different time points (t) with values ranging from 0 to 1. As the ICC value approaches 1, the repeatability of the measurement increases proportionally [17]. COV is the ratio of the standard deviation and the mean expressed as a percentage; the closer the value is to 0, the higher the repeatability is. TRV (µm), as indicated by the coefficient of repeatability, was calculated by multiplying the standard deviation of the difference between the measurements by 2. High repeatability was indicated by the existence of TRV values close to 0. The agreement between the two measurements was assessed using Bland-Altman plots, and p-values of <0.05 were deemed to indicate statistical significance [18].
Results
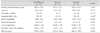
This study included 85 patients (29 males and 53 females). Groups A and B included 25 eyes and 57 eyes, respectively. There were no significant differences in terms of age, sex, laterality, best-corrected visual acuity, intraocular pressure, or refractive power among the two groups (Table 1).
OCT measurement with automated analysis
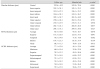
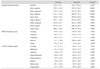
The thickness of the central macula, average thickness of the RNFL, and average thickness of the GCIPL among all patients were 252.6 ± 62.3, 92.4 ± 10.0, and 77.1 ± 12.8 µm, respectively, in normal fellow eyes and 343.8 ± 78.6, 95.5 ± 10.7, and 56.1 ± 23.4 µm, respectively, in eyes with macular holes. The thickness of the central macula was significantly thicker in affected eyes than in normal eyes (p < 0.001), while the thickness of the average GCLIPL was thinner in affected eyes than in normal eyes; it was also low in each sector (p < 0.001). There was no significant difference in the thickness of the RNFL (p = 0.070) (Table 2).
The analysis according to macular hole size showed that the average thicknesses of the central macula, RNFL, and GCIPL were 323.3 ± 47.1, 94.8 ± 12.1, and 53.7 ± 22.5 µm, respectively, in group A and 352.2 ± 83.6, 95.8 ± 10.5, and 58.3 ± 23.3 µm, respectively, in group B. The thickness of the central macula, RNFL, and GCIPL were not significantly different among the two groups (Table 1, 3).
Measurement repeatability
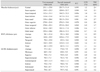
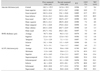
The ICCs of the thicknesses of the central macula, RNFL, and GCIPL for healthy fellow eyes were 0.995, 0.966, and 0.998, respectively, whereas those for affected eyes were 0.994, 0.974, and 0.700. Both eye types exhibited an ICC of ≥0.950 for the central macula and RNFL, and they showed similar results to the measurements of each area of the central macula and RNFL. The ICC for the GCIPL of the affected eye was 0.700, which was lower than that for the RNFL and central macula; it was also low in each sector. The other markers of repeatability (i.e., COV and TRV) yielded similar results (Table 4, 5). We assessed the same data using Bland-Altman plots (Fig. 3A–3C).
Discussion
The vitreoretinal interface is a complex structure of connective tissue that connects the vitreous cortex and inner retina. The posterior vitreous contains a high concentration of collagen fibers; laminin, fibronectin, and chondroitin are attached to the surface of the limiting membrane of the retina [19]. The close relationship between the vitreous cortex and the retina can lead to various vitreoretinal interface disorders, including idiopathic macular holes. Gass [3] reported the mechanism of macular holes as involving tangential traction around the fovea. Studies using OCT have revealed that foveal cysts are created in the sensory retina by vitreous traction and develop into full-thickness macular holes as the internal and external walls are disrupted [3,20]. de Sisternes et al. [6] stated that the extent of ellipsoid zone band defects in the foveal and parafoveal regions was a good predictor of postoperative visual acuity recovery. Xu et al. [7] reported that macular hole geometry was related to pre- and postoperative visual acuity.
Measurements of the thickness of the macula and RNFL using SD-OCT in healthy eyes and glaucoma patients exhibit high levels of repeatability and reproducibility [21,22]. Pinilla et al. [23], who included normal fellow eyes in their study, reported that both time-domain OCT and SD-OCT showed highly reliable repeatability in the measurement of macular thickness.
Many studies on the thickness of the GCIPL are currently ongoing in various ophthalmic fields. Park et al. [24] stated that the GCIPL of amblyopic eyes is thinner than that of normal eyes, while Kim et al. [25] highlighted an increased thickness of the GCIPL in patients with nonproliferative diabetic retinopathy after panretinal photocoagulation. In addition, some studies have reported a high reproducibility of GCIPL measurements using SD-OCT in patients with glaucoma [24,26]. Conversely, other studies have shown that autosegmented measurements demonstrate a high tendency to be erroneous in nonhealthy patients. Lee et al. [13] reported that macular contour change with epiretinal membrane results in low repeatability and a tendency to measure thinner GCIPL values using SD-OCT. Xu et al. [7] stated that errors in segmentation occurred predominantly at the edge of the macular hole boundary, where there was greater irregularity of the shape of the segmentation result. However, few studies have evaluated the repeatability of measurement of the GCIPL thickness according to macular defect in patients with retinal disease.
The thicknesses of the GCIPL as measured by automatic segmentation of the retina can be affected by edema or atrophy of the retina. In particular, automatic segmentation algorithm errors frequently occur in patients with macular site defects such as macular holes as well as in patients with changes in the shape of the macula due to cystic alterations.
In the present study, the macula was thicker in the affected eyes than in the healthy ones. Furthermore, a comparison of the affected eyes according to the size of the macular hole showed no significant correlations between the size of the macular hole and the thickness of the macula. This is because the macular hole size is mainly determined by tractional force during the development of the macular hole and because the thickness of the central macula increases as the edge of the macular hole thickens with cystic degeneration [27,28].
The thickness of the GCIPL in affected eyes was 56.1 ± 23.4 µm, which was significantly thinner than the corresponding value in healthy eyes (77.1 ± 12.8 µm). The thicknesses of the GCIPL in groups A and B were 53.7 ± 22.5 and 58.3 ± 23.3 µm, with no significant differences between them. When analyzing the thickness of the GCIPL using the ganglion cell analysis algorithm, oval areas with a horizontal diameter of 1.0 mm and a vertical diameter of 1.2 mm based on the center of the macular area were excluded. Therefore, if the size of the macular hole exceeds 1.2 mm, then the thickness could decrease due to the macular defect; notably, though, the measurement would not be affected by such a defect for a macular hole of ≤400 µm. However, we found no statistically significant differences between them. The degree of GCIPL thinning was considered to be caused by the boundary of the GCIPL, which was erroneously segmented to be thinner than its actual size because of deformation of the macula, rather than secondary to the influence of the macular hole-induced defect (Fig. 2).
The ICCs for the thicknesses of the central macula, RNFL, and GCIPL of the affected eyes were 0.994, 0.974, and 0.700, respectively. Thus, when measuring the thickness of the central macula and RNFL, the ICC was >0.950 with high repeatability; however, when measuring the GCIPL, the repeatability was low (Table 5). This finding likely resulted from the measurement errors of automatic segmentation caused by deformation of the macula in the affected eyes. Another contributing factor may have been difficulties in the repeated measurement of the same part caused by instability of fixation secondary to decreased visual acuity accompanied by the macular hole.
There are several limitations in this study. First, because the purpose of the present study was to evaluate the repeatability of OCT measurement by automated analysis without manual adjustment, there could be some measurement error in the central macula, RNFL, and GCIPL thicknesses. Second, it is difficult to apply this method to short eyes (axial length <23.6 mm) or long eyes (axial length >25.5 mm). Further investigations are needed in patients with various axial lengths. Third, we did not evaluate the characteristics of macular hole morphology and the pattern of autosegmentation error. Additional research should be conducted in order to determine the relationship between GCIPL thickness and the pattern of autosegmentation error.
In conclusion, the central macula, peripapillary RNFL, and GCIPL were thicker, similar, and thinner, respectively, in eyes with macular holes than in the opposite healthy eyes according to SD-OCT evaluation. The repeatability of thickness measurements was lower for the GCIPL than for the central macula and RNFL. Macular contour change with the macular hole results in low repeatability and a tendency to measure thinner GCIPL values using SD-OCT. This may be attributed to unstable fixation with decreased visual acuity and retinal segmentation error due to macular deformation. The impact of changes in the macular shape caused by the presence of macular holes should be taken into consideration when measuring the GCIPL thickness in patients with various eye diseases such as glaucoma and in those with neuro-ophthalmic disorders.

 XML Download