

 PDF
PDF ePub
ePub Citation
 Print
Print


Amblyopia is defined as a decrease in best-corrected visual acuity (BCVA) in one eye caused by abnormal binocular interaction or a decrease in one or both eyes as a result of pattern deprivation during visual immaturity for which no cause can be detected during physical examination of the eyes [1]. It has been reported that amblyopic patients may have abnormalities in the afferent visual system, including shrinkage of cells in the lateral geniculate nucleus and a shift in the visual cortex dominance pattern [234]. However, controversy remains in the literature regarding retinal involvement accompanying amblyopia [567].
Using a rat model, it was suggested that the amblyopic process may slow down the normal postnatal reduction of ganglion cells [8]. We sought to determine whether amblyopia resolution after occlusion therapy enhances functional lamination of ganglion cells. To answer this question, a prospective study was undertaken to determine whether amblyopia resolution induced structural changes in the fovea or macula of amblyopic patients.
The purpose of this study was to compare the thickness of superior, temporal, inferior, and nasal macula and foveal thickness and volume in patients with anisometropic amblyopia prior to and after successful occlusion therapy using optical coherence tomography (OCT) measurements.
Materials and Methods
The study followed the tenets of the Declaration of Helsinki, approved by the institutional review board of Kyungpook National University Hospital. Informed consent was obtained from one of the parents of each participating child. Data were collected prospectively on thirty patients (mean, 5.4 ± 1.7 years; range, 3 to 9 years) who were diagnosed with unilateral anisometropic amblyopia between November 2006 and August 2007. Amblyopia was diagnosed when BCVA showed a difference of ≥2 lines between the eyes. Anisometropia was diagnosed as a refractive error difference of ≥2 diopters (D) spherical equivalent. Exclusion criteria for this study included combined mechanism amblyopia, preexisting ocular structural abnormalities, other systemic disorder or neurological abnormalities, previous history of occlusion therapy, and insufficient cooperation during OCT measurements.
All patients in the study underwent complete ophthalmologic evaluations. The following parameters were recorded and analyzed: age, gender, BCVA, manifest and cycloplegic refraction, duration of occlusion, and OCT measurements. BCVA was measured with the Snellen or ‘E’ chart and converted into the logarithm of the minimum angle of resolution (logMAR) scale. Cycloplegic refraction was performed 30 minutes after administration of 1% cyclopentolate and 0.5% tropicamide. Occlusion therapy was performed by prescribing glasses to fully correct refractive errors and 6 to 8 hours of partial occlusion. Occlusion therapy was completed when the interocular difference in visual acuities between the sound eye and amblyopic eye became less than 0.1 logMAR units.
Measurements using a Stratus OCT (software version 4.0.1; Carl-Zeiss Meditec, Dublin, CA, USA) were made for 30 patients upon diagnosis of amblyopia and for 22 patients at the time of amblyopia resolution after successful occlusion therapy. Measurements of the thickness of the superior, temporal, inferior, and nasal macula and foveal thickness and volume were performed. Throughout scanning, the patient kept each eye constantly fixed on an internal target. To enhance the cooperation of children, OCT measurements were performed on the same day that cycloplegic refraction was analyzed. All scans had signal strength of at least 6 [91011]. Although the Status OCT operation manual recommends a minimum signal strength of 5, a signal strength of 6, as used in previous OCT studies, was chosen as the enrollment criterion for this study [1112].
The fast macula scan protocol consisted of six consecutive 6-mm radial line scans centered on the macula, each containing 128 A-scans taken in a single session lasting 1.92 seconds. A retinal thickness and volume tubular analysis program was used to evaluate the macular scans. This analysis program presents the mean foveal and macular thickness and volume in the inner and outer macula. Data for macular thickness were displayed in three concentric circles. The most central ring was the foveal region, measuring 1 mm in diameter. The inner and outer rings, with diameters of 3 and 6 mm, respectively, were each divided into four quadrants. Average macular thickness and volume were reported for each of the nine regions. Each OCT was performed by the same technician.
Statistical analysis was performed using SPSS ver. 14.0 (SPSS Inc., Chicago, IL, USA). The Wilcoxon signed rank test was used to compare the data measured prior to and after occlusion therapy. Multivariate regression analysis was performed to determine whether any of the various clinical factors had a meaningful correlation with the amount of foveal volume decrease. All p-values were adjusted by the false discovery rate method [13]. Differences were considered significant if the p-value was less than 0.05.
Results
Of 30 patients with unilateral anisometropic amblyopia, 22 patients successfully finished occlusion therapy. Three patients were lost during follow-up, and five patients failed to achieve amblyopia resolution due to poor compliance with the occlusion therapy.
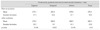
Table 1 shows descriptive data for 22 patients in this study. The mean age of the patients was 5.4 ± 1.7 years (range, 3 to 9 years). Mean BCVA (logMAR) upon diagnosis of unilateral anisometropic amblyopia was 0.40 ± 0.17. Mean refractive error was 3.5 ± 2.1 D in patients with hyperopia (n = 10, spherical equivalent) and -2.2 ± 1.9 D in patients with myopia (n = 12, spherical equivalent). The mean duration of occlusion therapy was 11.6 ± 2.3 months. Mean BCVA (logMAR) upon diagnosis of the fellow eyes was 0.03 ± 0.05, a nd mean refractive error of the fellow eyes was 0.8 ± 1.6 D.
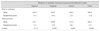
We compared mean foveal thickness and volume of patients with unilateral anisometropic amblyopia prior to and after occlusion therapy (Table 2). There was no significant difference in foveal thickness prior to and after occlusion therapy. However, mean foveal volume decreased from 0.15 to 0.14 mm3 after successful occlusion therapy (p = 0.025).
We compared mean thickness of the superior, temporal, inferior, and nasal quadrants in the inner (3 mm diameter) and outer (6 mm diameter) macula of patients with unilateral anisometropic amblyopia prior to and after occlusion therapy (Table 3, 4). None of the parameters were statistically different after occlusion therapy (p > 0.05).
However, patient's age, refractive error, BCVA increase, and duration of occlusion therapy were not significantly correlated with the amount of foveal volume decrease (p > 0.05).
Discussion
In this study, the thickness and volume of the macula and fovea prior to and after occlusion therapy were evaluated in patients with unilateral anisometropic amblyopia. We found that mean foveal volume significantly decreased from 0.15 to 0.14 mm3 after occlusion therapy (p = 0.025), whereas there was no statistical difference in thickness of the superior, temporal, inferior, and nasal macula prior to and after occlusion therapy (p > 0.05). In addition, there was also no difference in foveal thickness prior to and after occlusion therapy (p > 0.05).
Our results suggest that resolution of amblyopia by occlusion therapy may not induce functional lamination of the retinal ganglion cells of amblyopic eyes because no differences in the thicknesses of the fovea and macula prior to and after occlusion therapy were observed. We speculate that there may be no relationship between increase in visual acuity due to occlusion therapy and loss of retinal ganglion cells in amblyopic eyes.
There are several reports on OCT measurements of the macula and fovea in amblyopic eyes. Altintas et al. reported no difference in macular thickness or volume between the two eyes of patients with unilateral strabismic amblyopia [8]. Dickmann et al. [14] reported no difference in retinal structure between controls and patients with amblyopia in children and young adults by spectral domain OCT. Dickmann et al. [15] reported that macular thickness and foveal volume were slightly but significantly lower in the sound eye than in amblyopic eye in patients with strabismic amblyopia. In addition, they also reported no difference in these values in patients with anisometropic amblyopia. Al-Haddad et al. [16] also reported that central macular thickness was significantly increased in anisometropic amblyopia using spectral OCT. Park et al. [17] reported that there was significant thinning of the ganglion cell layer plus inner plexiform layer at the macula with spectral OCT. However, most of their patients responded poorly to occlusion therapy. Pang et al. [18] reported that central macula associated with myopic anisometropic amblyopia tended to be thinner following amblyopia treatment. However, they only included patients with myopic anisometropic amblyopia in their study. Therefore, they could not rule out the possibility that those changes were related to myopic progression of the patients. In this study, we included patients with all types of refractive errors, and each value of foveal volume reduction was consistent regardless of their refractive status, supported by the very small standard deviation (0.005). Therefore, direct comparison with results of Pang et al. [18] which included only myopic anisometropic amblyopia and our data seems impossible due to the heterogenous status of refractive errors in our study patients.
However, there has not been a study comparing these values prior to and after occlusion therapy of amblyopic eyes. Our study focused on children less than 10 years of age. Furthermore, we evaluated only patients with anisometropic amblyopia and excluded patients with strabismic and visual deprivation amblyopia as these might have different mechanisms of amblyopia development.
An important finding in our study is that there was a statistically significant decrease in foveal volume in amblyopic eyes after amblyopia resolution. We were interested in this unexpected difference in foveal volume. Although the amount of mean foveal volume reduction was very small (0.012 mm3), the value of foveal volume reduction in all patients was consistent, supported by the standard deviation (0.005). We concluded that the reduction of mean foveal volume was highly statistically significant. We believe the decrease of foveal volume is due to the rearrangement of foveal cone cells during occlusion therapy and we hypothesize that a decrease in foveal volume might occur through a decrease in foveal thickness. This cannot be established with statistical significance in this study due to the small sample size. We feel confident that further study with more patients with amblyopia can provide more evidence for this. In addition, the improved focusing of patients by increased visual acuity is another reason for this possible technical error. There was a report that presented increasing foveal thickness with age [19]. Considering that the mean duration of occlusion in our study was 11.6 months, we assume that the reduction of foveal volume is clinically meaningful.
We propose the following mechanism to explain our observations. The fovea is a small, avascular depression in the central part of the retina and is devoid of all cells except cone photoreceptors and Muller glia [15]. This region is initially one of the thickest parts of the retina and, by a process of cell migration, is transformed into a depression or pit [20]. We speculate that foveal cone cells in amblyopic eyes may be distributed less compactly than those in sound eyes because the receptive field of an amblyopic eye is larger than that of a sound eye [21]. After occlusion therapy, which consists of prescribing glasses to fully correct the refractive errors in anisometropic amblyopic eyes, the fovea will be stimulated by the act of sharply focusing on objects. Moreover, foveal cone cells in amblyopic eyes will be rearranged to be more compact by this stimulation. It is inferred that the increased density of foveal cone cells due to occlusion therapy may eventually lead to an increase in visual acuity in amblyopic eyes as the diameter of single foveal cone cell closely matches the minimum resolvable visual angle [20]. However, we do not yet know what controls the rearrangement of foveal cone cells, and we could not verify the actual rearrangement of foveal cone cells by microscopic observation.
This study has important limitations largely stemming from its small sample size, relatively loose refractive entry criteria, lack of the data of fellow eyes, and lack of a control group of normal children. Dubis et al. [22] indicated that morphological development of the fovea might be complete by around 17 months. Vajzovic et al. [23] demonstrated that the foveal structure of inner and outer segments were mature on both histology and spectral domain OCT at approximately 5 years of age. Considering the mean age and range of the patients in our study, the possibility of normal maturation of the fovea being the reason for decrease in foveal volume is quite low. The mean age of our study patients was 5.8 years (range, 47 to 116 months), which is a bit too old to have ongoing normal maturation considering that foveal maturation is thought to conclude around 17 months and not later than 5 years of age. However, we cannot rule out a normal maturation process being the reason for decrease in foveal volume in our study because interpersonal variation may exist. In addition, we did not measure the axial length of the patients. Therefore, another limitation of this study is the lack of compensation of the magnification effect by refractive status in the analysis of the OCT data. However, we compared data prior to and after occlusion therapy in the same eye of the same patients, which seems to be non-significantly affected by the change of age and refractive error during occlusion therapy. We could not compare these data with those from the Stratus normative database because of the ages of the patients.
In conclusion, there was a meaningful decrease in foveal volume in patients with unilateral anisometropic amblyopia after resolution of amblyopia. Whether this decrease in foveal volume relates to the visual improvement of amblyopic eyes remains to be determined.

 XML Download