

 PDF
PDF ePub
ePub Citation
 Print
Print


Abstract
Purpose
To report a case of glaucoma suspect with peripapillary pit, which enlarged in size with retinal herniation through the pit, and resulted in retinal nerve fiber layer defect and corresponding visual field defect.
Case summary
A 34-year-old male was referred to our glaucoma clinic for glaucoma evaluation. The intraocular pressure was 15 mmHg in the right eye and 14 mmHg in the left eye. The refractive error in spherical equivalence was −12.75 diopters (D) in the right eye and −11.50 D in the left eye. The axial length was 28.70 mm in the right eye and 28.15 mm in the left eye. On optical coherence tomography (OCT), the retinal nerve fiber layer thickness was within normal limits in both eyes. A peripapillary pit was found in both eyes, which measured 155 µm in the right eye and 625 µm in the left eye in maximal horizontal diameters. Two year follow-up OCT images showed that the peripapillary pit in the right eye enlarged to 239 µm and retinal herniation occurred through the pit, resulting in a retinal nerve fiber layer defect and a corresponding visual field defect. However, the peripapillary pit in the left eye had no significant change.
Figures and Tables
Figure 1
The infrared image (A) and optical coherence tomography (OCT) enhanced depth image (B) describing the location and the measurement of the peripapillary pit of the right eye. The size of the pit was measured in the OCT scan crossing the maximal horizontal diameter of the pit. The distance between the vertical lines passing the edge where the inner scleral continuity ends (c, d) was measured (red left right arrow). The peripapillary pit of the right eye was located in the gamma zone of the peripapillary atrophy (PPA), corresponding to the area between the optic disc border and the edge of the Bruch's membrane (b). The beta zone PPA is depicted as the area between the edge of the Bruch's membrane (b) and the end of the retinal pigment epithelium layer (a).
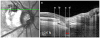
Figure 2
The infrared fundus image (A, C, E, G, I, K), optical coherence tomography (OCT) enhanced depth images (EDI) (B, D, F, H, J, L) at the first visit (A, B, E, F, I, J) and 2 years after the first visit (C, D, G, H, K, L). (A, B) Infrared fundus image and OCT EDI of the right eye at the first visit, respectively. The red arrow indicates the peripapillary pit of the right eye. The red left right arrow indicates the extent of the peripapillary pit. The blue arrow indicates the intact outer retinal layers at the first visit. (C) Infrared fundus image of the right eye at 2 years after the first visit shows the change in the route of superotemporal retinal vein. (D) OCT EDI of the right eye at 2 years after the first visit, which is the same scan location to B. Note the deepening of the pit and retinal herniation through the pit (red arrow) and the development of retinoschisis (blue arrow). The red left right arrow indicates the extent of the peripapillary pit. (E) Infrared fundus image of the right eye at the first visit. (F) OCT EDI of the right eye at the first visit. The yellow arrow indicates the intrascleral space connected to the subarachnoid space (purple star) beneath the scleral flange. (G) Infrared fundus image of the right eye at 2 years after the first visit. (H) OCT EDI of the right eye at the 2 years after the first visit, which is the same scan location to F. Note the enlargement of intrascleral space compared to that of F (yellow arrow). Intrascleral space is connected to the subarachnoid space (purple star) via intrascleral channels (small green arrows), which are more prominent than that seen in F. (I, J) Infrared fundus image and OCT EDI of the left eye at the first visit, respectively. The peripapillary pit is seen as well (white arrow). (K, L) Infrared fundus image and OCT EDI of the left eye at 2 years after the first visit, respectively. There is no interval change compared to the first visit (I, J). The white arrow indicates the peripapillary pit, which shows no interval changes from J.
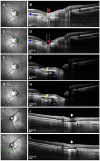
Figure 3
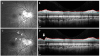
Red-free fundus photograph (A, C) and circumpapillary optical coherence tomography (OCT) scan (B, D) at the first visit and at 2 years after the first visit, respectively. (A) Retinal nerve fiber layer (RNFL) defect is not evident on red-free fundus photograph. (B) Retinal nerve fiber layer atrophy is not also evident in OCT scan. (C) The wedge-shaped RNFL defect (between white arrows) is found in the direction of the peripapillary pit. (D) A focal RNFL atrophy is also found in OCT scan (thick white arrow), which is matched with RNFL defect shown in C.
References
1. Ohno-Matsui K, Akiba M, Moriyama M, et al. Acquired optic nerve and peripapillary pits in pathologic myopia. Ophthalmology. 2012; 119:1685–1692.

2. Ugurlu S, Weitzman M, Nduaguba C, Caprioli J. Acquired pit of the optic nerve: a risk factor for progression of glaucoma. Am J Ophthalmol. 1998; 125:457–464.
3. Lee EJ, Kim TW. Progressive retinal nerve fiber layer atrophy associated with enlarging peripapillary pit. J Glaucoma. 2017; 26:e79–e81.
4. Kranenburg EW. Crater-like holes in the optic disc and central serous retinopathy. Arch Ophthalmol. 1960; 64:912–924.
5. Dithmar S, Schuett F, Voelcker HE, Holz FG. Delayed sequential occurrence of perfluorodecalin and silicone oil in the subretinal space following retinal detachment surgery in the presence of an optic disc pit. Arch Ophthalmol. 2004; 122:409–411.
6. Krivoy D, Gentile R, Liebmann JM, et al. Imaging congenital optic disc pits and associated maculopathy using optical coherence tomography. Arch Ophthalmol. 1996; 114:165–170.
7. Jonas JB, Nguyen XN, Gusek GC, Naumann GO. Parapapillary chorioretinal atrophy in normal and glaucoma eyes. I. Morphometric data. Invest Ophthalmol Vis Sci. 1989; 30:908–918.
8. Jonas JB. Clinical implications of peripapillary atrophy in glaucoma. Curr Opin Ophthalmol. 2005; 16:84–88.
 XML Download