Abstract
Methods
The study consisted of 68 eyes of 34 patients who were diagnosed with epiblepharon and 88 eyes of 44 patients who had normal eyelids from September 2012 to July 2013. Data on palpebral fissure height and refractive errors were compared be-tween the epiblepharon group and the control group. Epiblepharon patients were further divided into two subgroups depending on the degree of preoperative corneal erosion in order to study the effects of corneal erosion on corneal astigmatism.
Results
The mean age was 5.6 ± 2.2 years in the epiblepharon group and 6.1 ± 1.5 years in the control group ( p = 0.339). The mean astigmatism was 2.28 ± 1.54 D in the epiblepharon group and 0.91 ± 1.07 D in the control group. The epiblepharon group showed higher astigmatism than the control group ( p < 0.001). The mean palepebral fissure height was 6.70 ± 1.19 mm in the ep-iblepharon group and 7.63 ± 1.06 mm in the control group. The epiblepharon group exhibited smaller palpebral fissure height than the control group ( p < 0.001). In the palpebral fissure height subgroups of the epiblepharon group, the <7.0 mm group showed higher astigmatism than the ≥7.0 mm group ( p = 0.026). Higher astigmatism was associated with smaller palpebral fis-sure height ( p = 0.022).
References
1. Preechawai P, Amrith S, Wong I, Sundar G. Refractive changes in epiblepharon. Am J Ophthalmol. 2007; 143:835–9.

2. Noda S, Hayasaka S, Setogawa T. Epiblepharon with inverted eye-lashes in Japanese children. I. Incidence and symptoms. Br J Ophthalmol. 1989; 73:126–7.

3. Kim NM, Jung JH, Choi HY. The effect of epiblepharon surgery on visual acuity and with-the-rule astigmatism in children. Korean J Ophthalmol. 2010; 24:325–30.

4. Lee DP, Kim SD, Hu YJ. Change of visual acuity and astigmatism after operation in epiblepharon children. J Korean Ophthalmol Soc. 2001; 42:223–7.
5. Baek SH, Heo NH, Lee KS. Corneal topographic changes after sur-gery in epiblepharon children. J Korean Ophthalmol Soc. 2002; 43:1841–6.
6. Hyun DW, Jeon CY, Jin SY, Ha MS. Visual acuity and astigmatism after simultaneous surgery for upper and lower eyelid epiblepharon in children. J Korean Ophthalmol Soc. 2011; 52:272–6.

7. Jeoung JW, Kim NJ, Choung HK, Khwarg SI. Changes in astigma-tism after surgical repair of epiblepharon or ptosis: a vectorial-ana-lytic approach. J Korean Ophthalmol Soc. 2005; 46:1429–34.
8. Khwarg SI, Lee YJ. Epiblepharon of the lower eyelid: classi-fication and association with astigmatism. Korean J Ophthalmol. 1997; 11:111–7.

9. Garcia ML, Huang D, Crowe S, Traboulsi EI. Relationship be-tween the axis and degree of high astigmatism and obliquity of pal-pebral fissure. J AAPOS. 2003; 7:14–22.

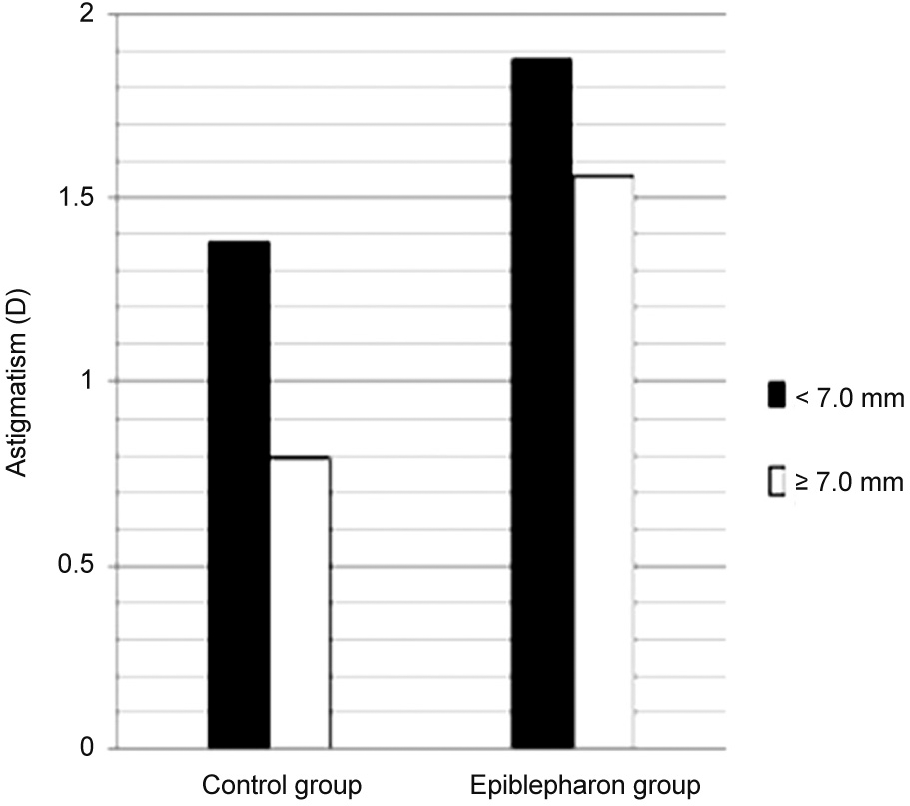
Figure 1.
Mean astigmatism with palpebral fissure height in the control group and the epiblepharon group. Within both the control group and the epiblepharon group, the smaller palpe-bral fissure height group showed higher astigmatism ( p = 0.073, 0.026, respectively). Mann-Whitney test.

Table 1.
Demographic features of the epiblepharon group and the control group
| Epiblepharon group (n = 68) | Control group (n = 88) | p-value | |
|---|---|---|---|
| Age at baseline (years) | 5.6 ± 2.2 | 6.1 ± 1.5 | 0.339* |
| Sex (male:female) | 1:1 | 1.4:1 | 0.423† |
| Astigmatism at baseline (D) | 2.28 ± 1.54 | 0.91 ± 1.07 | <0.001* |
| Palpebral fissure height (mm) | 6.70 ± 1.19 | 7.63 ± 1.06 | <0.001* |
Table 2.
Distribution of the corneal erosion in the epiblepharon group
| Degrees of corneal erosion | Astigmatism (D) |
Simultaneous component analysis by ANOVA |
|
|---|---|---|---|
| Subgroup | p-value | ||
| Grade 0 | 1.88 ± 1.29 | Grade 1 | 0.292* |
| Grade 2 | 0.033* | ||
| Grade 1 | 1.33 ± 1.01 | Grade 0 | 0.292* |
| Grade 2 | <0.001* | ||
| Grade 2 | 3.03 ± 1.60 | Grade 0 | 0.033* |
| Grade 1 | <0.001* | ||
| Total | <0.001† | ||


 PDF
PDF ePub
ePub Citation
 Print
Print


 XML Download