Abstract
Purpose
To compare the image quality between swept-source optical coherence tomography (SS-OCT) and spectral domain optical coherence tomography (SD-OCT), especially in eyes with media opacity.
Methods
Forty eyes without media opacity and 60 eyes with media opacity (30 eyes with cataract, 20 eyes with vitreous opacity, and 10 eyes with corneal opacity) were included in this study. SD-OCT and SS-OCT 6 × 6 macular scans were taken by a single operator. For image quality analysis, a total of 200 OCT images were subjectively graded by two trained retina specialists and measured quantitatively using the image quality factor (QF) built into the OCT devices.
Results
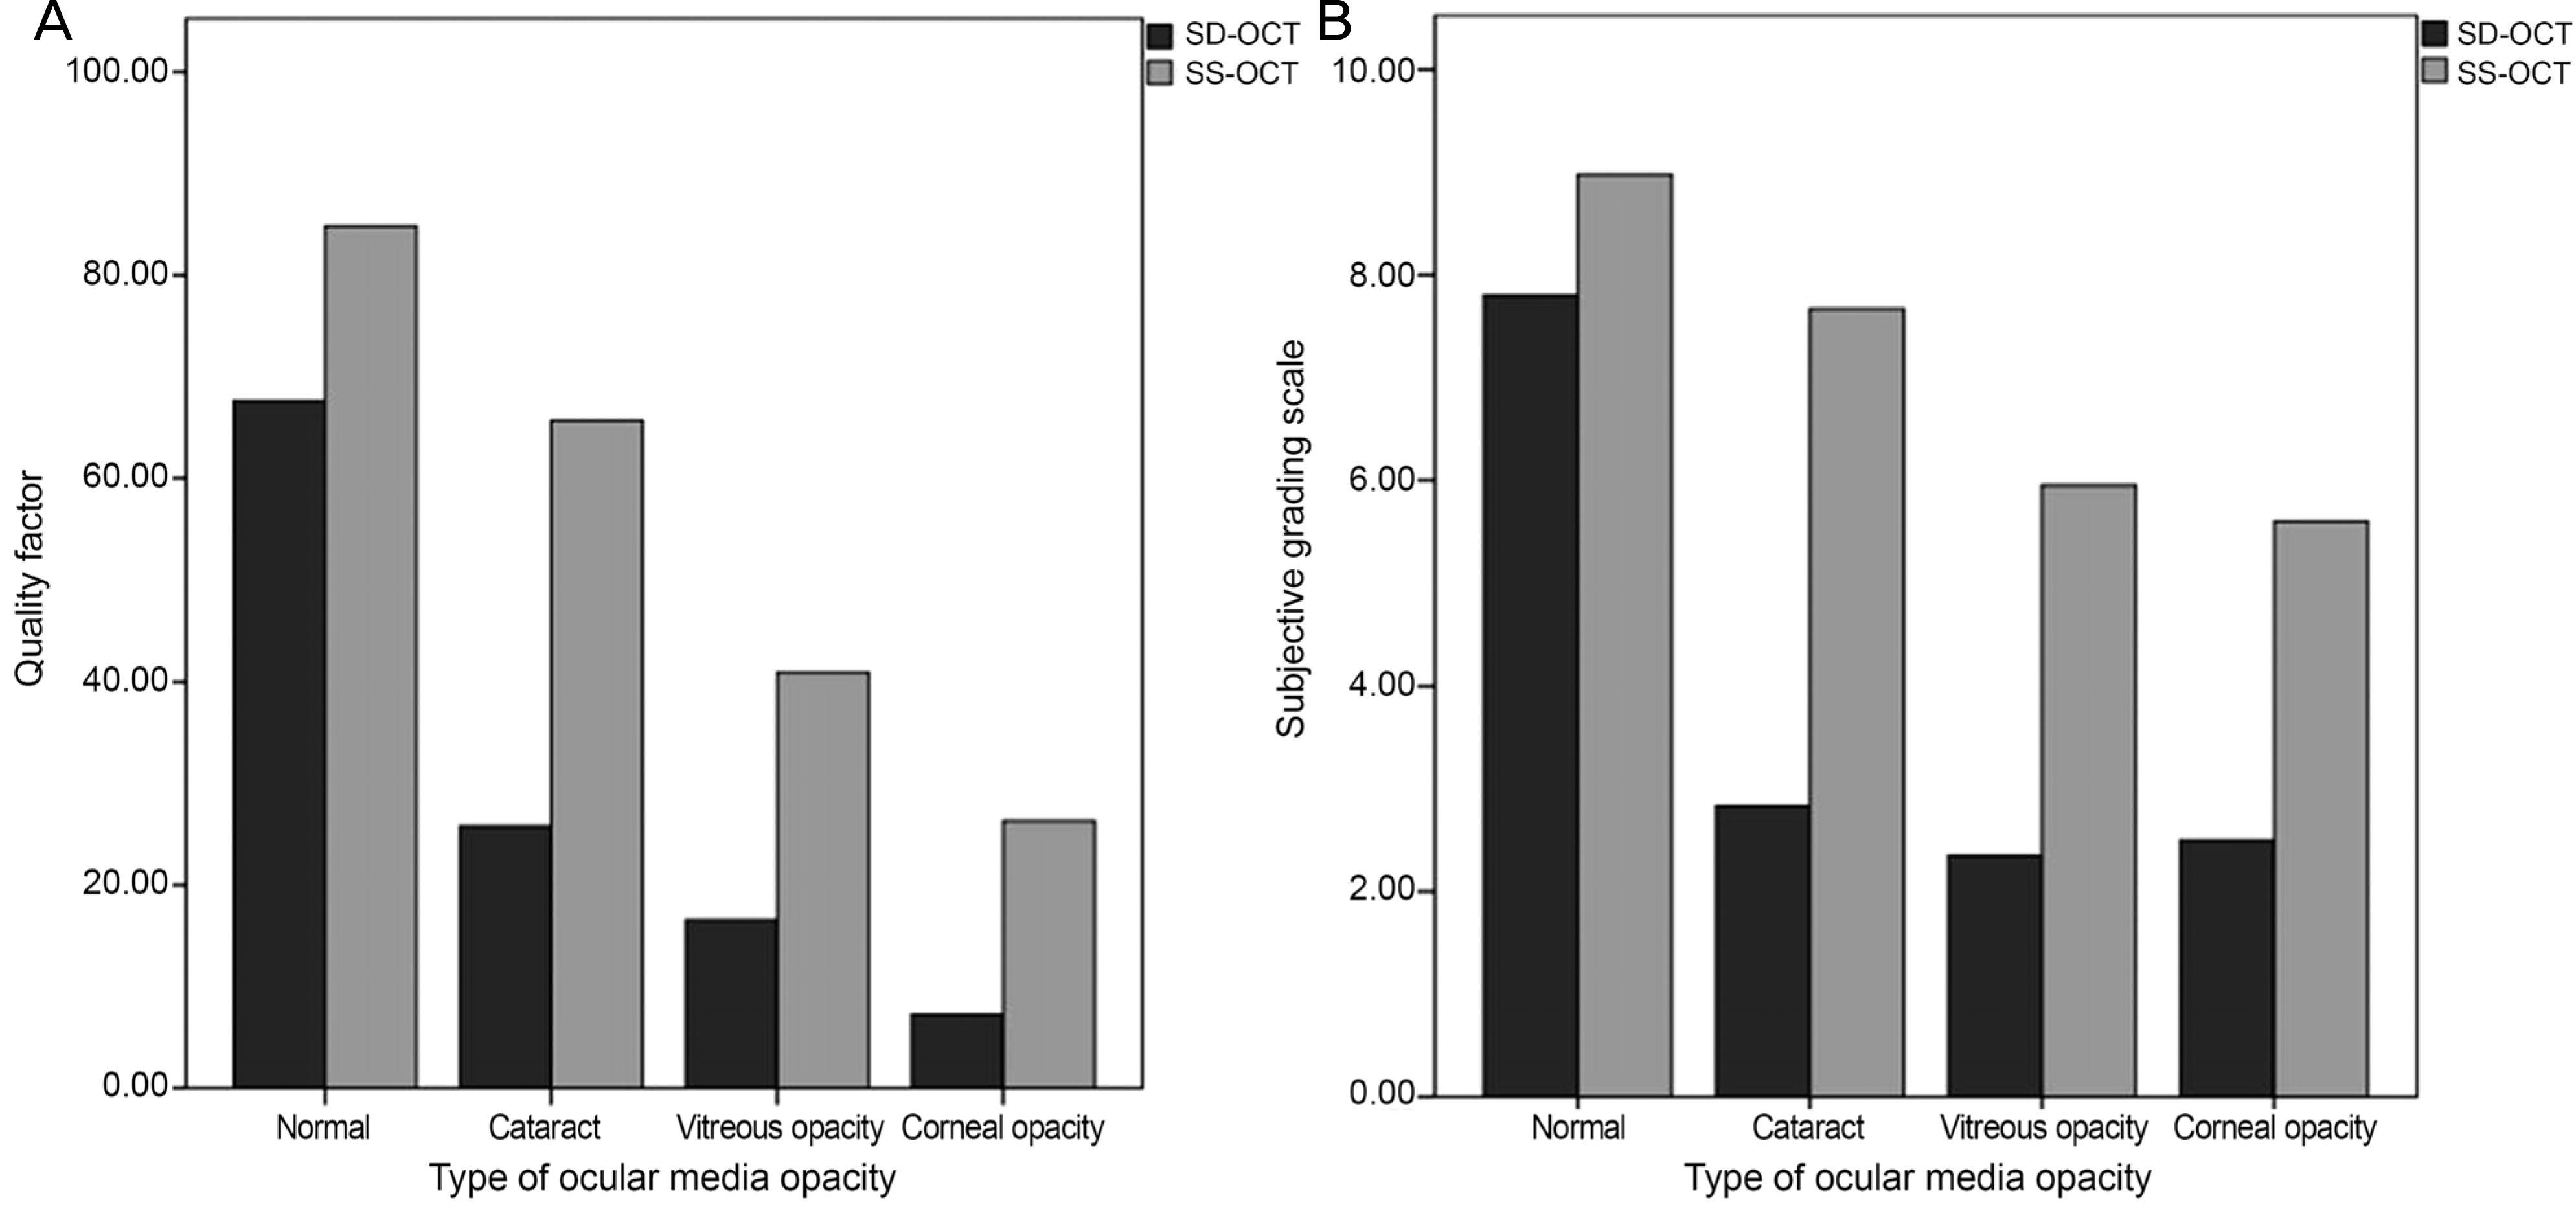
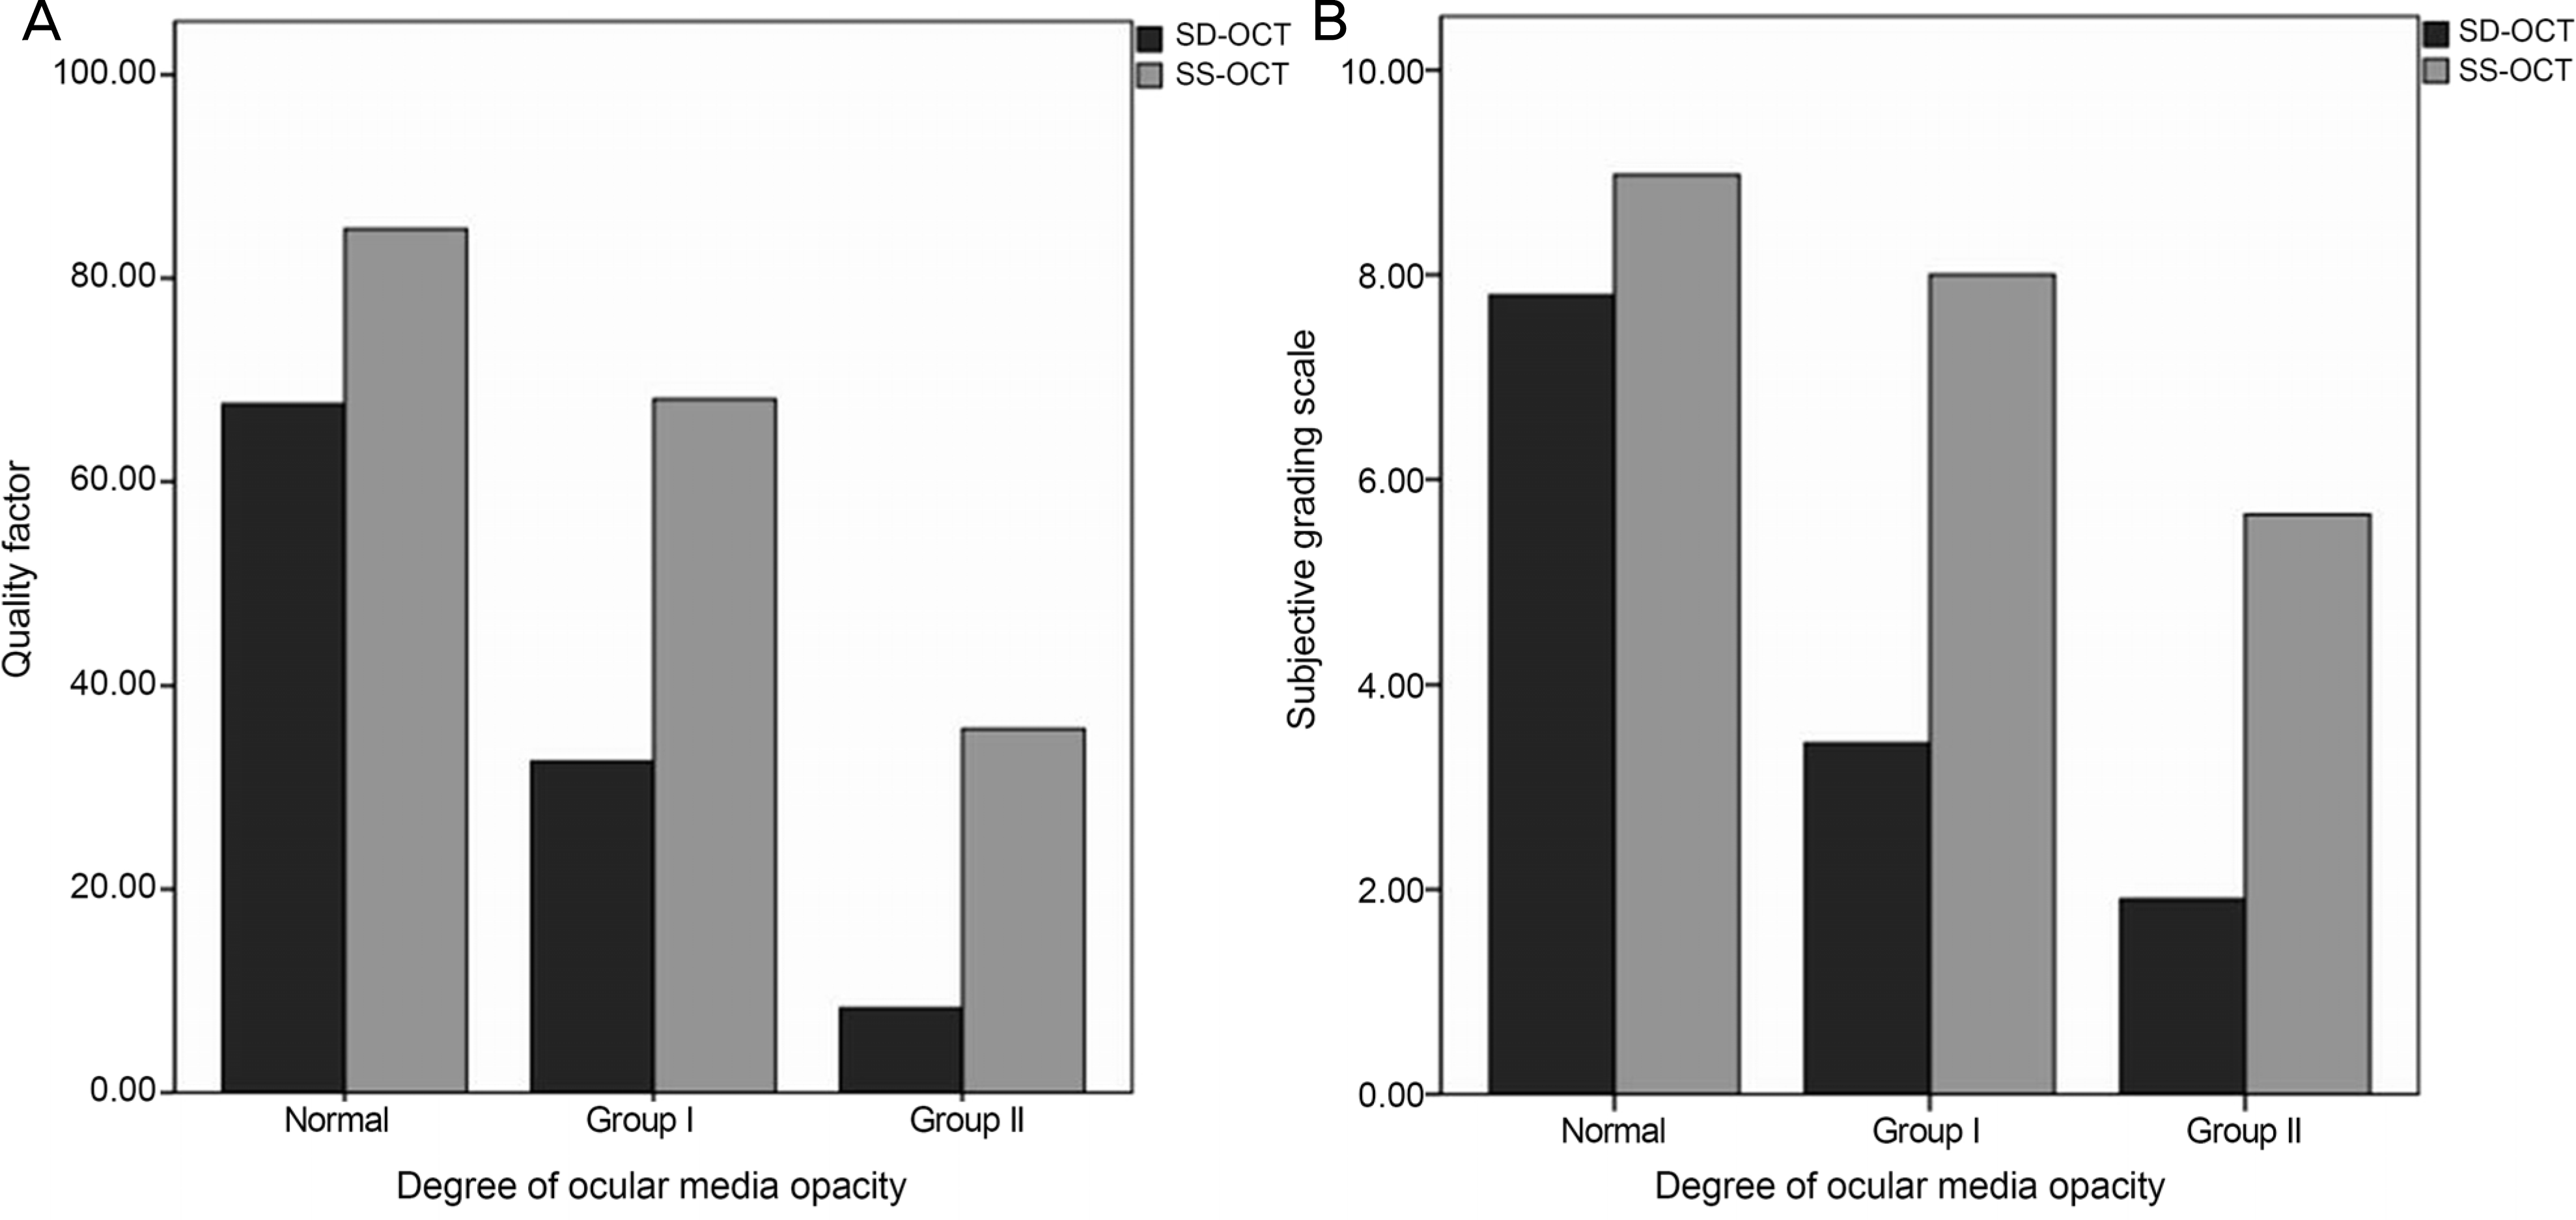
Compared to conventional SD-OCT, SS-OCT had statistically significantly better subjective and objective grades in the normal group, as well as each of the media opacity groups (p-value < 0.001). In both the subjective and objective grades, there was no significant difference according to the types of media opacity (QF: p = 0.188, subject grading scale [SGS]: p = 0.635) and the degree of media opacity (Group I: 20 ≤ QF < 50, Group II: 0 ≤ QF < 20; QF: p = 0.088, SGS: p = 0.051) in the superiority of image quality of SS-OCT to SD-OCT.
Conclusions
In this media opacity patient population, swept-source OCT is a superior diagnostic tool when compared with SD-OCT in both objective and subjective assessments, even in the ocular media opacity. This result may be useful in diagnosis and progression detection of retinal disease in media opacity eyes.
REFERENCES
1). Povazay B, Hermann B, Unterhuber A, et al. Three-dimensional optical coherence tomography at 1050 nm versus 800 nm in retinal pathologies: enhanced performance and choroidal penetration in cataract patients. J Biomed Opt. 2007; 12:041211.
2). Chen Y, Burnes DL, Bruin M, et al. Three-dimensional pointwise comparison of human retinal optical property at 845 and 1060 nm using optical frequency domain imaging. J Biomed Opt. 2009; 14:024016.
3). Lee EC, Mujat M, et al. In vivo optical frequency domain imaging of human retina and choroid. Opt Express. 2006; 14:4403–11.

4). Hirata M, Tsujikawa A, Matsumoto A, et al. Macular choroidal thickness and volume in normal subjects measured by swept-source optical coherence tomography. Invest Ophthalmol Vis Sci. 2011; 52:4971–8.

5). Yasuno Y, Hong Y, Makita S, et al. In vivo high-contrast imaging of deep posterior eye by 1-microm swept source optical coherence tomography and scattering optical coherence angiography. Opt Express. 2007; 15:6121–39.
6). Ching HY, Wong AC, Wong CC, et al. Cystoid macular oedema and changes in retinal thickness after phacoemulsification with optical coherence tomography. Eye (Lond). 2006; 20:297–303.

7). van Velthoven ME, van der Linden MH, de Smet MD, et al. Influence of cataract on optical coherence tomography image quality and retinal thickness. Br J Ophthalmol. 2006; 90:1259–62.

8). Kok PH, Dijk HW, et al. The relationship between the optical density of cataract and its influence on retinal nerve fibre layer thickness measured with spectral domain optical coherence tomography. Acta Ophthalmol. 2013; 91:418–24.

9). Stein DM, Ishikawa H, Hariprasad R, et al. A new quality assessment parameter for optical coherence tomography. Br J Ophthalmol. 2006; 90:186–90.

10). Liu S, Paranjape AS, Elmaanaoui B, et al. Quality assessment for spectral domain optical coherence tomography (OCT) images. Proc SPIE Int Soc Opt Eng. 2009; 7171:71710X.

11). Huang Y, Gangaputra S, Lee KE, et al. Signal quality assessment of retinal optical coherence tomography images. Invest Ophthalmol Vis Sci. 2012; 53:2133–41.

12). Giani A, Cigada M, Choudhry N, et al. Reproducibility of retinal thickness measurements on normal and pathologic eyes by different optical coherence tomography instruments. Am J Ophthalmol. 2010; 150:815–24.

13). Geitzenauer W, Kiss CG, Durbin MK, et al. Comparing retinal thickness measurements from Cirrus spectral domain- and Stratus time domain-optical coherence tomography. Retina. 2010; 30:596–606.

14). van Velthoven ME, Faber DJ, Verbraak FD, et al. Recent developments in optical coherence tomography for imaging the retina. Prog Retin Eye Res. 2007; 26:57–77.

15). Kok PH, van Dijk HW, van den Berg TJ, Verbraak FD. A model for the effect of disturbances in the optical media on the OCT image quality. Invest Ophthalmol Vis Sci. 2009; 50:787–92.

16). Unterhuber A, Povazay B, Hermann B, et al. In vivo retinal optical coherence tomography at 1040 nm - enhanced penetration into the choroid. Opt Express. 2005; 13:3252–8.

17). Povazay B, Bizheva K, Hermann B, et al. Enhanced visualization of choroidal vessels using ultrahigh resolution ophthalmic OCT at 1050 nm. Opt Express. 2003; 11:1980–6.

18). Esmaeelpour M, Povazay B, Hermann B, et al. Three-dimensional 1060-nm OCT: choroidal thickness maps in normal subjects and improved posterior segment visualization in cataract patients. Invest Ophthalmol Vis Sci. 2010; 51:5260–6.

Figure 1.
A representative OCT b-scan image showing how to grade subject grading scale (SGS). The graded OCT features were labeled (a) vitreous, (b) vitreo-retinal interface, (c) nerve fiber layer, (d) ganglion cell layer, (e) plexiform layers, (f) outer nuclear layer, (g) outer limiting membrane, (h) outer ret-ino-choroidal complex, (i) choroidal/scleral interface. Question 1 in the subjective grading scheme corresponds to the intensity difference between features a and h; question 2, visibility of b; question 3, intensity difference between a and c; question 4, intensity difference between a and e; question 5, visibility of multiple layers within h; question 6, visibility of d (against c and e); question 7, intensity difference between a and f; question 8, visibility of g; and question 9, visibility of i. Figure revised from Huang et al.11 OCT = optical coherence tomography.

Figure 2.
Representative cases of ocular media opacity. (A-C) A case of corneal opacity. Anterior segment photograph shows dense central corneal opacity (A). After dilating of pupil, SS-OCT and SD-OCT images were obtained. The b-scan image of SS-OCT shows relatively clear borders of each retinal layers and visualizes choroidal/scleral interface clearly (B), but in SD-OCT image, the borders of each layer are obscure and choroidal/scleral interface is not shown (C). (D-F) A case of cataract (lens opacity). Anterior segment photograph shows severe nuclear and cortical cataract (D). In the b-scan image of SS-OCT, each layers of retina are vi-sualized (E). The b-scan image of SD-OCT could not visualize the layers (F). (G-I) A case of vitreous hemorrhage (vitreous opacity). In the fundus photograph, vitreous hemorrhage is shown and the fundus looks hazy (G). The b-scan image of SS-OCT (H) shows relatively clear view of each layers of retina and choroidal/scleral interface than the b-scan image of SD-OCT (I). SD-OCT = spectral domain optical coherence tomography; SS-OCT = swept-source optical coherence tomography.

Figure 3.
Image quality of SD-OCT and SS-OCT in normal and each ocular media opacity groups. (A) Comparison of objective quality parameter (quality factor, QF) of SD-OCT and SS-OCT according to type of ocular media opacity. (B) Comparison of subjective quality parameter (subjective grading scale, SGS) of SD-OCT and SS-OCT according to type of ocular media opacity. SD-OCT = spectral domain optical coherence tomography; SS-OCT = swept-source optical coherence tomography.

Figure 4.
Image quality of SD-OCT and SS-OCT in each severity groups of ocular media opacity. (A) Comparison of objective quality parameter (quality factor, QF) of SD-OCT and SS-OCT according to degree of ocular media opacity. (B) Comparison of subjective quality parameter (subjective grading scale, SGS) of SD-OCT and SS-OCT according to degree of ocular media opacity. SD-OCT = spectral domain optical coherence tomography; SS-OCT = swept-source optical coherence tomography.

Table 1.
Comparison of objective and subjective quality parameter measurements of SD-OCT and SS-OCT according to type of media opacity
| Parameters | Media opacity (n = 60) | Total (n = 100) | ||||||||
|---|---|---|---|---|---|---|---|---|---|---|
| Normal (n = 40) | Cataract (n = 30) | Vitreous opacity (n = 20) | Corneal opacity (n = 10) | |||||||
| Mean | p-value* | Mean | p-value* | Mean | p-value† | Mean | p-value† | Mean | p-value* | |
| QF | <0.001 | <0.001 | <0.001 | 0.005 | <0.001 | |||||
| SD-OCT | 67.61 ± 4.23 | 2 | 25.80 ± 13.63 | 16.56 ± 13.57 | 7.25 ± 4.12 | 3 | 38.82 ± 26.18 | |||
| SS-OCT | 84.83 ± 9.96 | 6 | 65.67 ± 20.59 | 40.90 ± 24.96 | 2 | 26.30 ± 13.77 | 6 | 64.44 ± 26.97 | ||
| SGS | <0.001 | <0.001 | <0.001 | 0.004 | <0.001 | |||||
| SD-OCT | 7.80 ± 0.46 | 2.83 ± 1.53 | 2.35 ± 1.57 | 2.50 ± 1.78 | 4.69 ± 2.84 | |||||
| SS-OCT | 8.98 ± 0.16 | 7.67 ± 1.47 | 5.95 ± 2.37 | 5.60 ± 3.20 | 7.64 ± 2.09 | |||||
Table 2.
Comparison of objective and subjective quality parameter measurements of SD-OCT and SS-OCT according to degree of media opacity
| SD-OCT QF | Media opacity (n = 60) | Normal: QF ≥ 60 (n = 40) | ||||
|---|---|---|---|---|---|---|
| Group I: 20 ≤ QF < 50 (n = 28) | Group II: 0 ≤ QF < 20 (n = 32) | Normal: QF ≥ 60 (n = 40) | ||||
| Mean | p-value* | Mean | p-value* | Mean | p-value* | |
| QF | <0.001 | <0.001 | <0.001 | |||
| SD-OCT | 32.55 ± 8.50 | 8.32 ± 6.17 | 67.61 ± 4.23 | |||
| SS-OCT | 68.11 ± 16.28 | 35.75 ± 23.85 | 84.83 ± 9.96 | |||
| SGS | <0.001 | <0.001 | <0.001 | |||
| SD-OCT | 3.43 ± 1.14 | 1.91 ± 1.57 | 7.80 ± 0.46 | |||
| SS-OCT | 8.00 ± 1.02 | 5.66 ± 2.56 | 8.98 ± 0.16 | |||
Table 3.
Comparison of image quality difference between SS-OCT and SD-OCT according to type of media opacity
| Type of media opacity | Mean | p-value* | |||
|---|---|---|---|---|---|
| Cataract (n = 30) | Vitreous opacity (n = 20) | Corneal opacity (n = 10) | |||
| SSQF-SDQF† | 39.87 ± 18.86 | 24.34 ± 16.46 | 19.05 ± 9.96 | 31.22 ± 18.88 | 0.188 |
| SSSGS-SDSGS‡ | 4.83 ± 1.44 | 3.60 ± 1.57 | 3.10 ± 1.45 | 4.13 ± 1.63 | 0.635 |
Table 4.
Comparison of image quality difference between SS-OCT and SD-OCT according to degree of material opacity
| Grading of Media Opacity | Mean | p-value* | ||
|---|---|---|---|---|
| Group I: 20 ≤ QF < 50 (n = 28) | Group II: 0 ≤ QF < 20 (n = 32) | |||
| SSQF-SDQF† | 35.56 ± 14.20 | 27.43 ± 21.70 | 31.22 ± 18.88 | 0.088 |
| SSSGS-SDSGS‡ | 4.57 ± 1.20 | 3.75 ± 1.87 | 4.13 ± 1.63 | 0.051 |


 PDF
PDF ePub
ePub Citation
 Print
Print


 XML Download