Abstract
Purpose
To evaluate the correlation between central corneal thickness (CCT) and retinal nerve fiber layer thickness (RNFLT) as determined by optical coherence tomography (OCT) in glaucomatous subjects.
Methods
One hundred eyes diagnosed with glaucoma and 99 glaucoma suspect (GS) eyes were tested by visual field (VF), OCT, and ultrasonic pachymetry. The relationship between CCT and RNFLT measurements was assessed by Pearson correlation analysis. A mixed effect model was employed to determine the relationship between CCT and RNFLT in glaucoma and GS groups. We divided the patients into two groups depending on the thickness of their corneas: Thin (< 553.6 µ m) and thick (≥ 553.6 µ m), and compared three parameters: VF mean deviation (MD), pattern standard deviation (PSD), and RNFLT between the two groups.2
Results
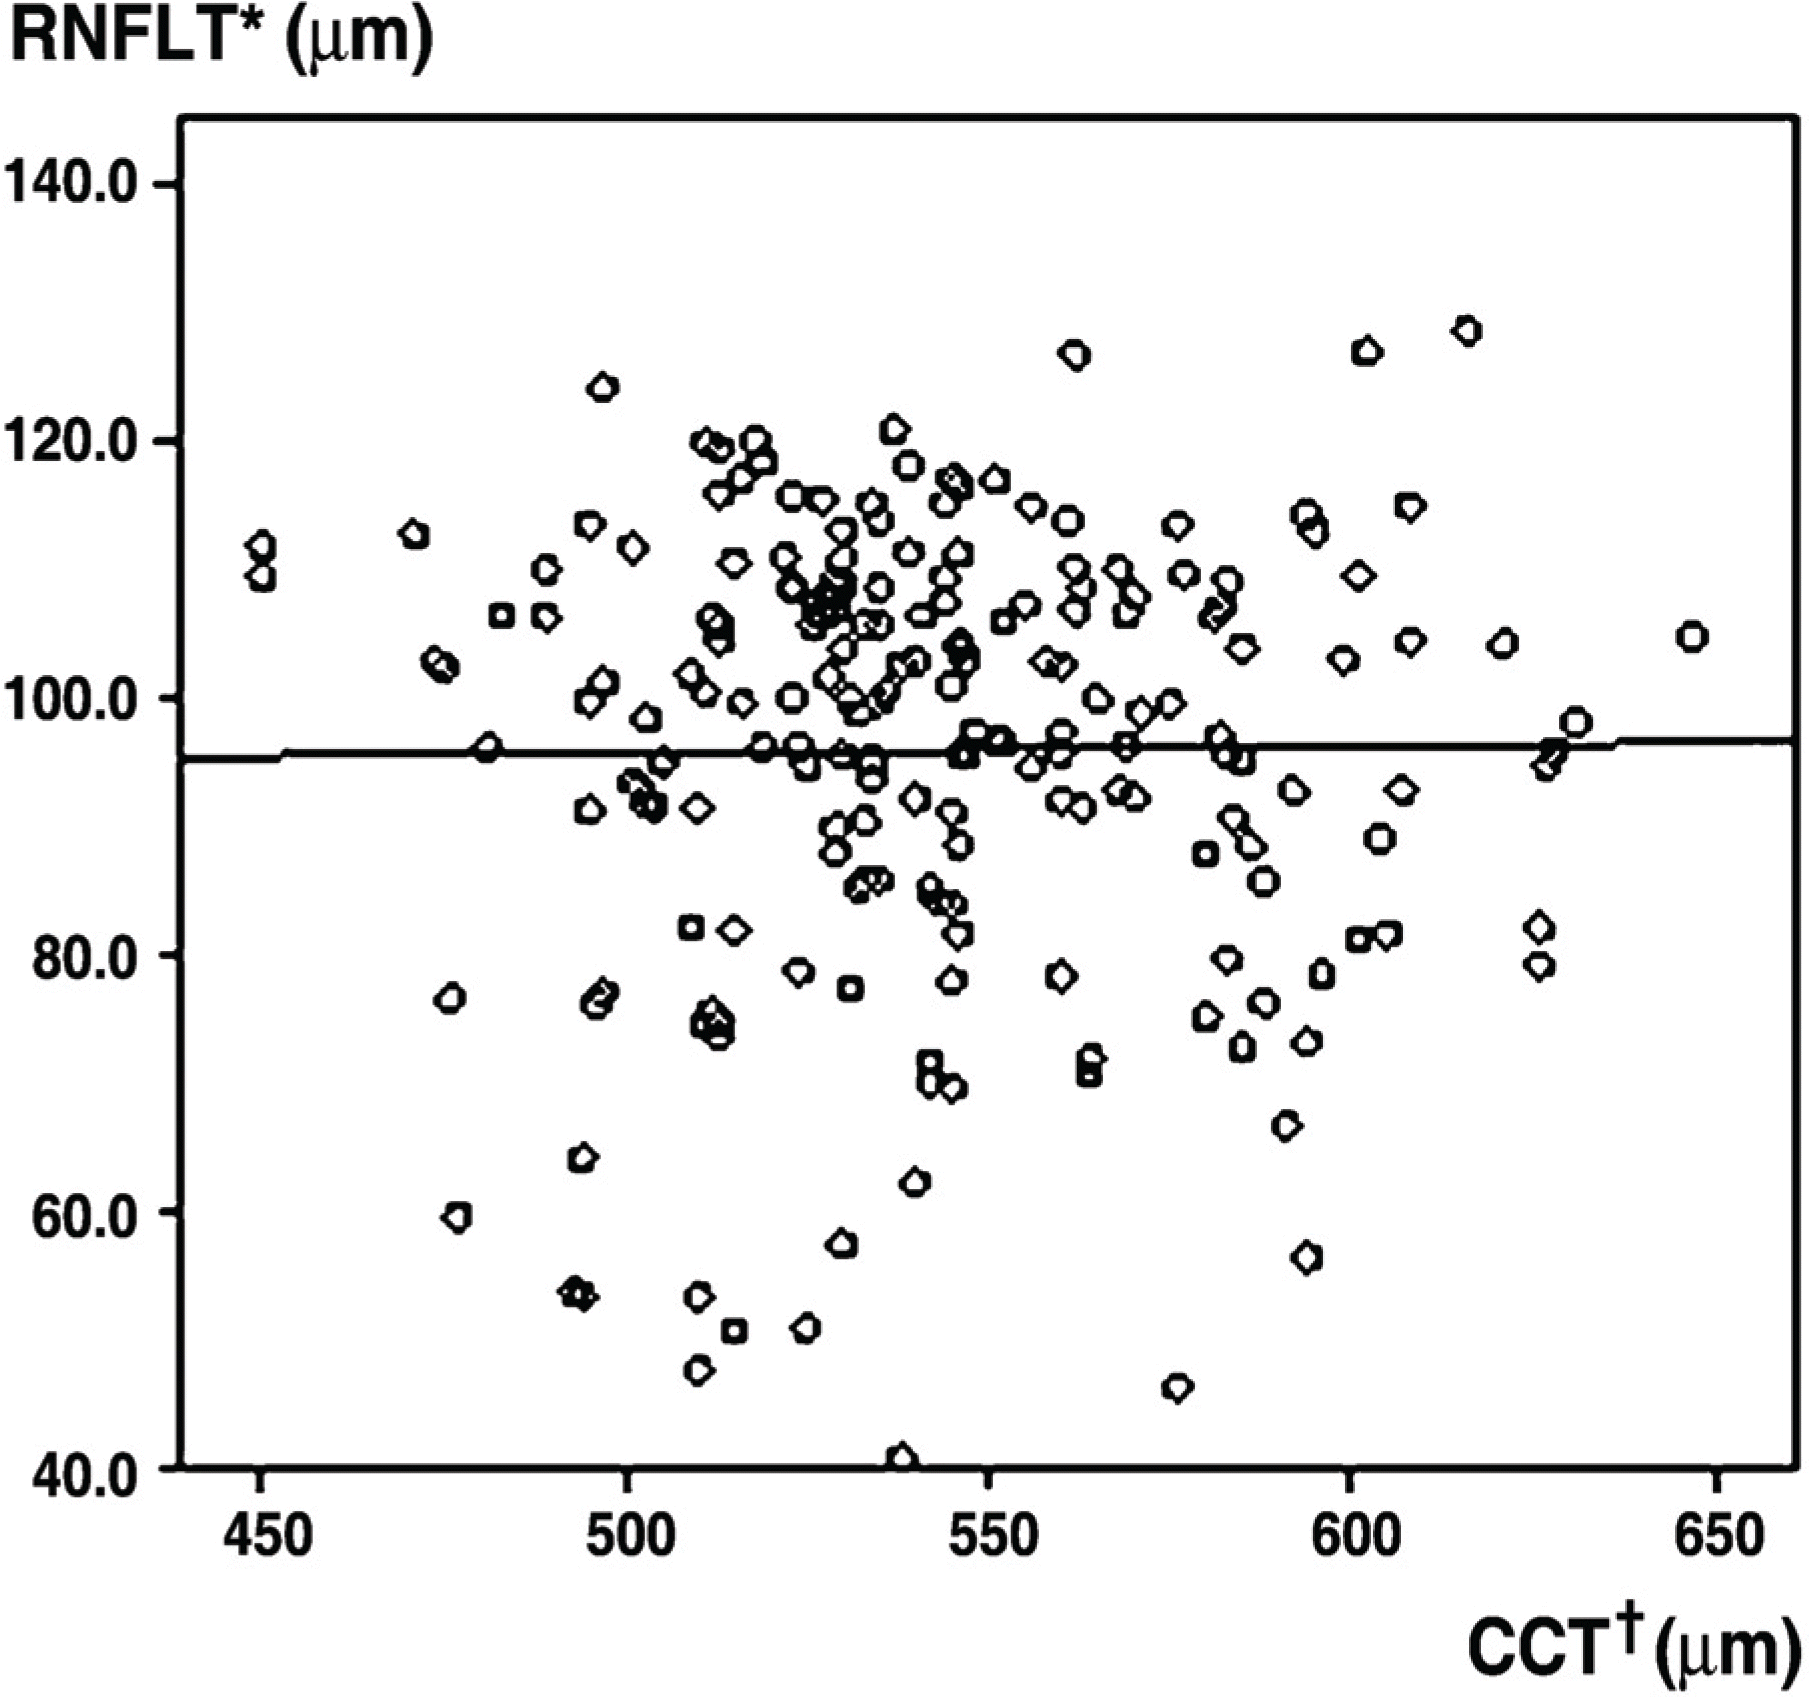
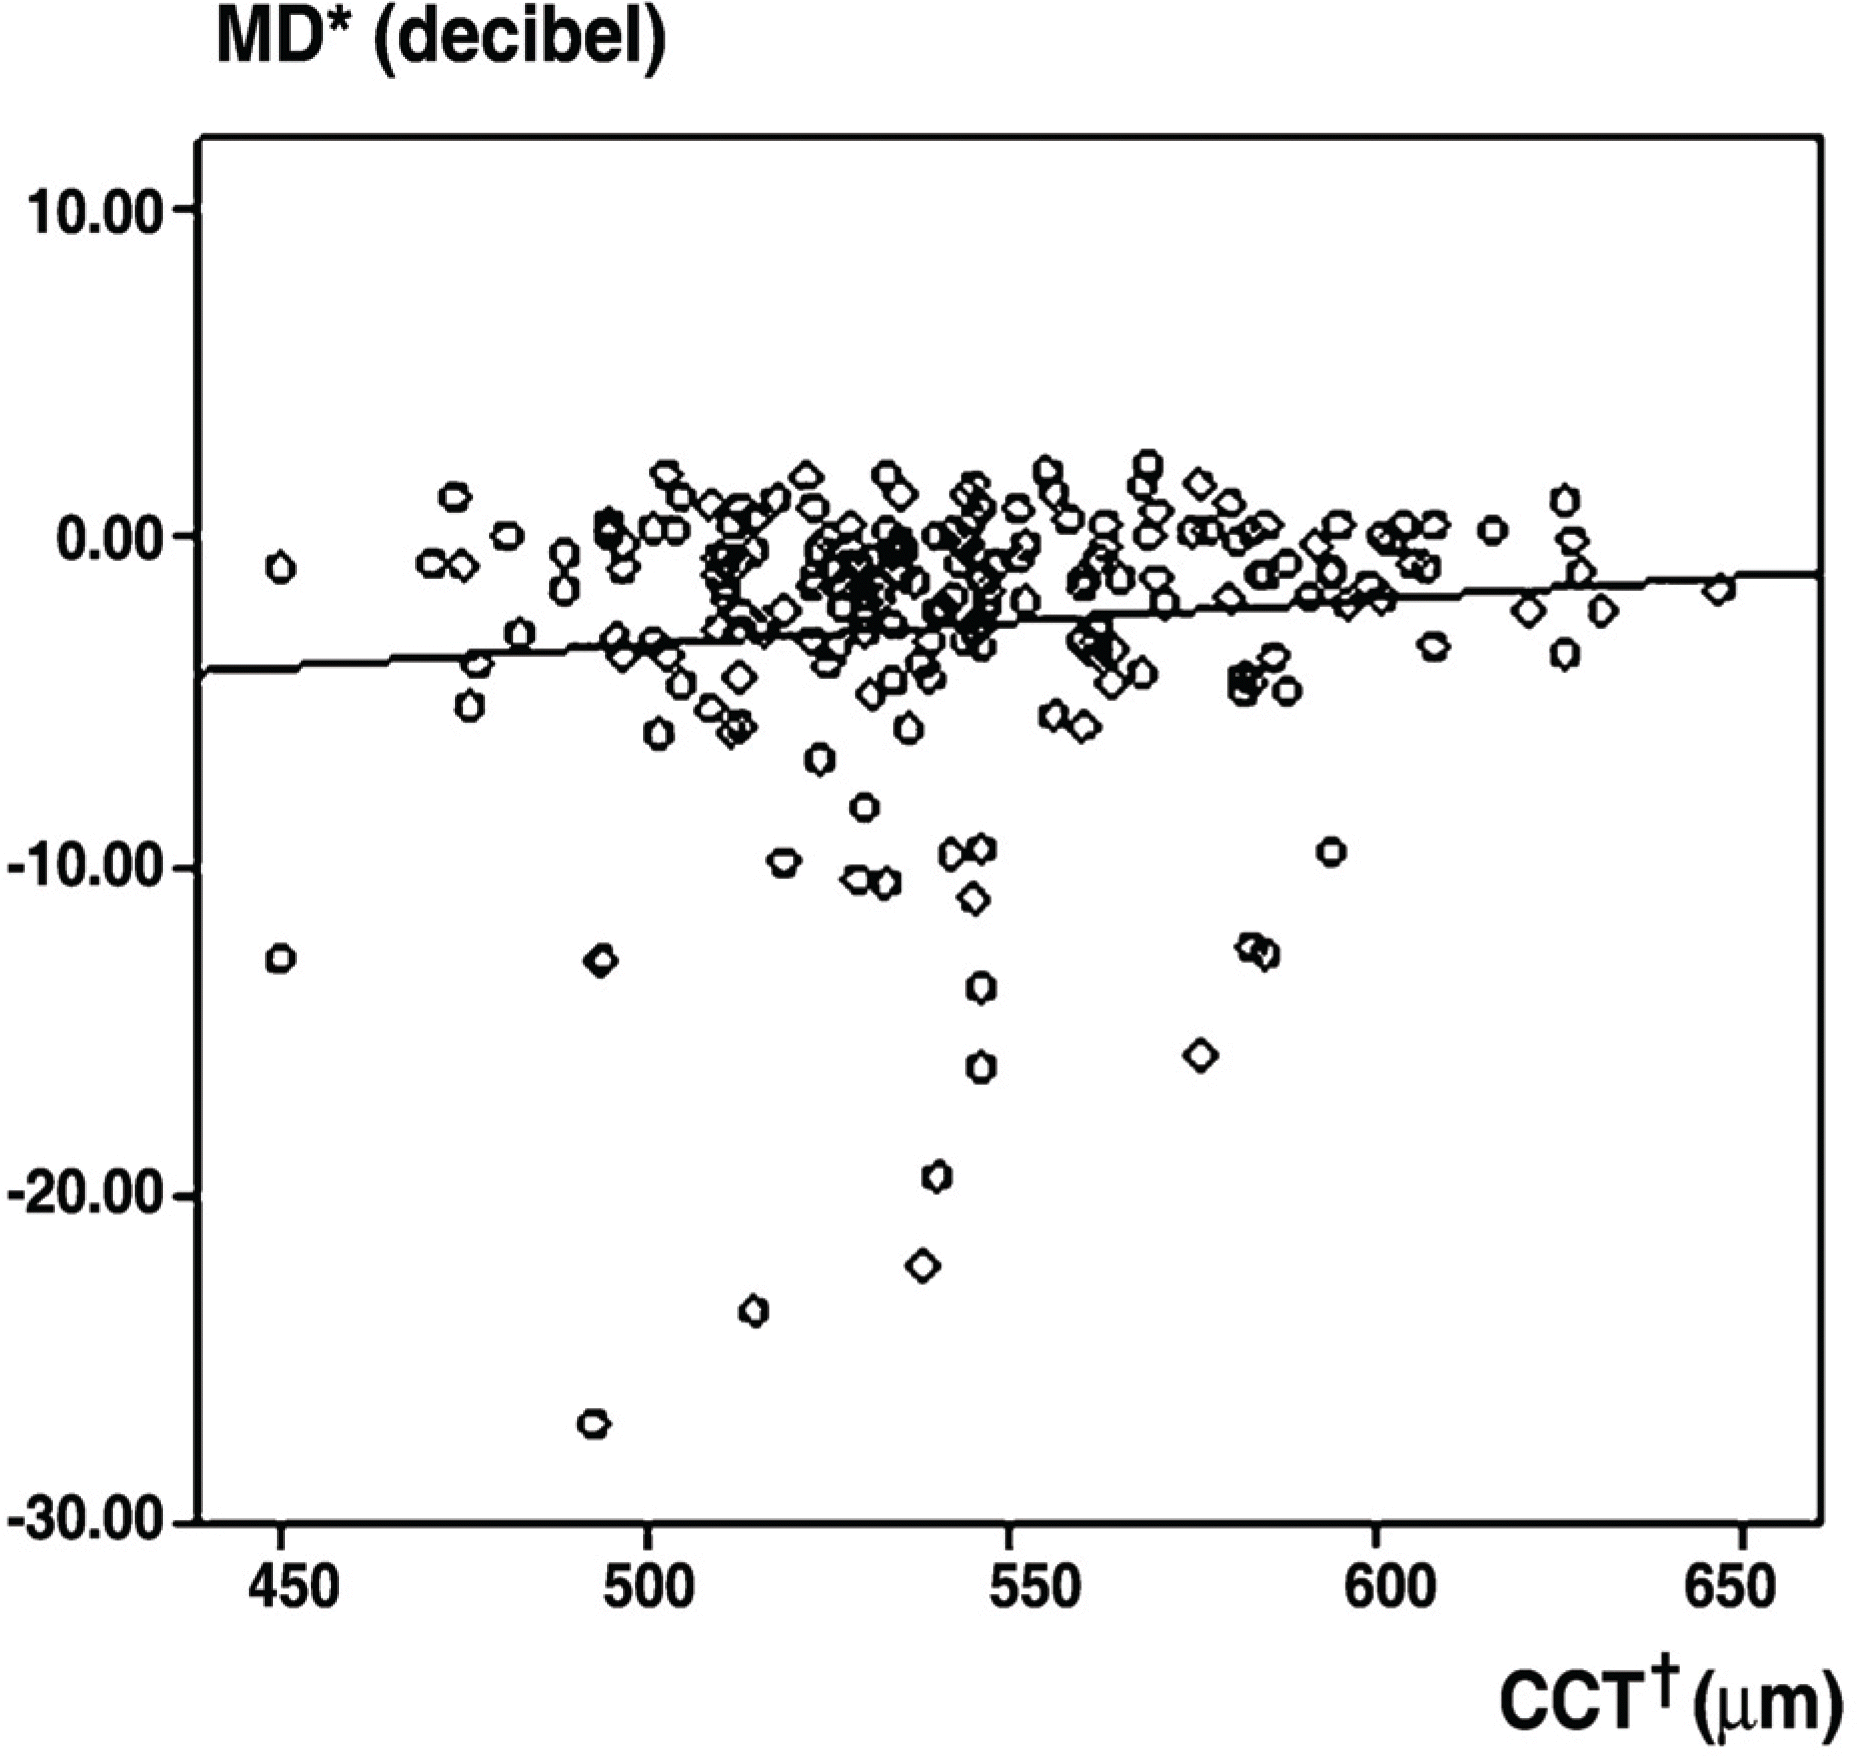
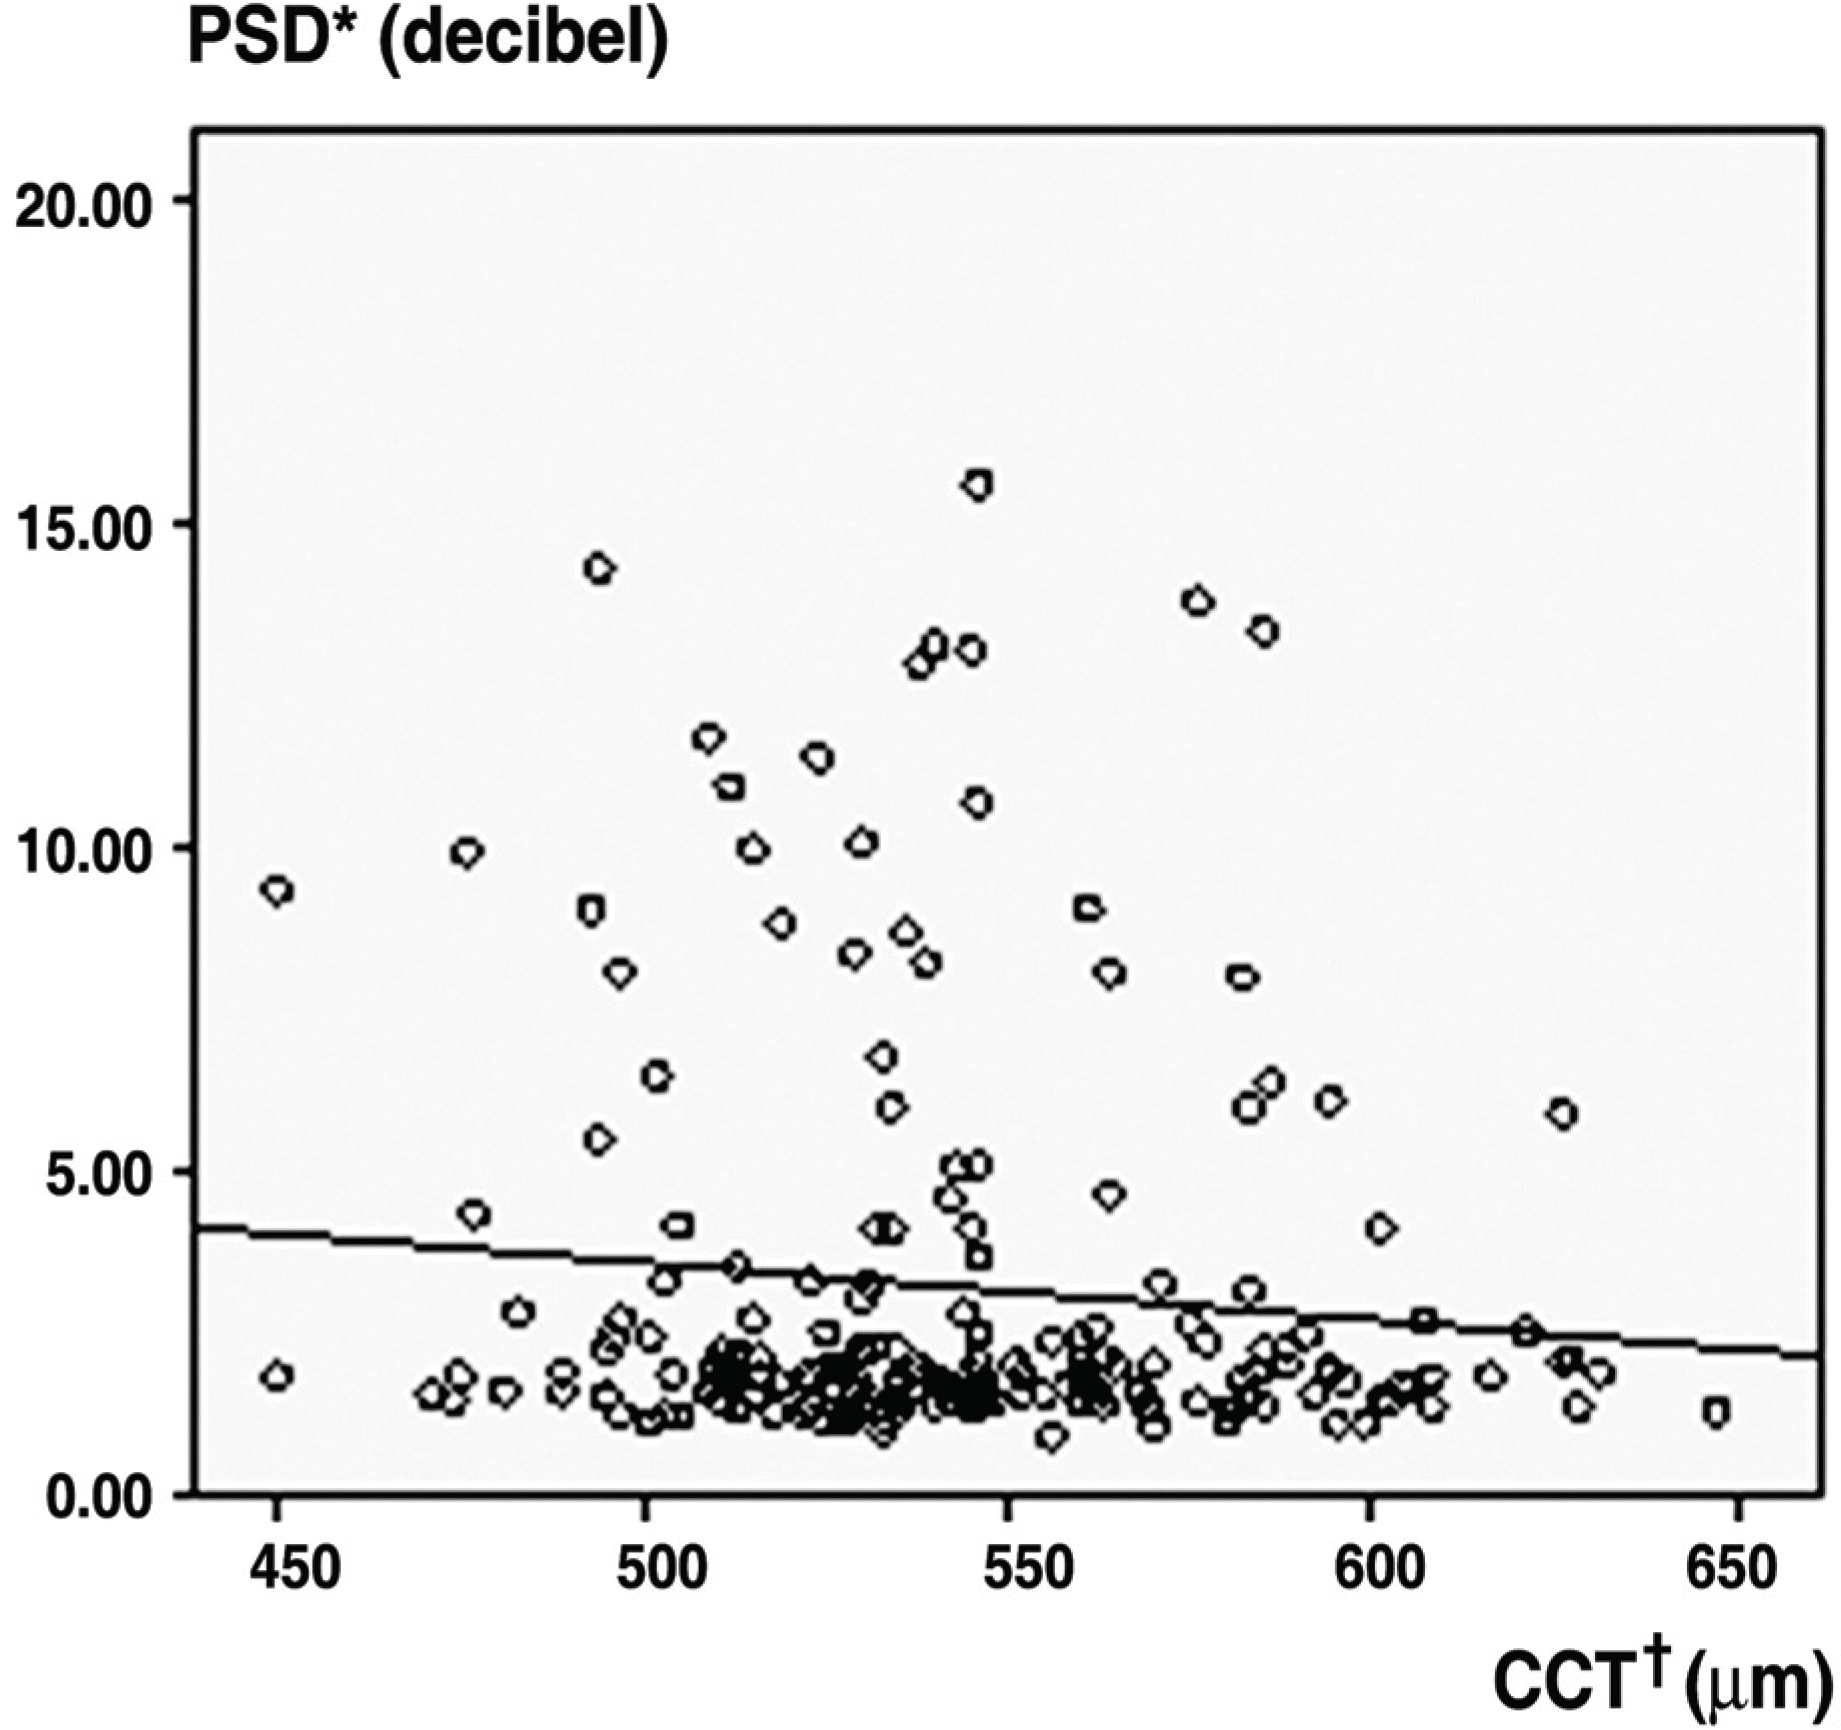
There were no significant correlations between CCT and RNFLT in any participant (R2=0.00, p=0.88). There was no significant relationship between CCT and RNFLT in glaucoma and GS groups (p=0.11, p=0.46). There were no statistically significant differences in MD, PSD, or RNFLT between the thin and thick cornea groups (p=0.38, 0.32, 0.44).
References
1. Gordon MO, Beiser JA, Brandt JD, et al. The Ocular Hypertension Treatment Study: baseline factors that predict the onset of primary open-angle glaucoma. Arch Ophthalmol. 2002; 120:714–20.
2. Miglior S, Pfeiffer N, Torri V, et al. Predictive factors for open-angle glaucoma among patients with ocular hypertension in the European Glaucoma Prevention Study. Ophthalmology. 2007; 114:3–9.

3. Allingham R, Damji K, Freedman S, et al. Intraocular Pressure and Tonometry. Allingham RR, Damji K, Freedman S, editors. Shields' Textbook of Glaucoma. 5th ed.Philadelphia: Lippincott Williams & Wilkins;2005. chap. 2.
4. Choi YJ, Kim JH, Sohn YH. Influence of central corneal thickness on diagnosis of glaucoma. J Korean Ophthalmol Soc. 2003; 44:2823–8.
5. Ehlers N, Bramsen T, Sperling S. Applanation tonometry and central corneal thickness. Acta Ophthalmol. 1975; 53:34–43.

6. Wolfs RC, Klaver CC, Vingerling JR, et al. Distribution of central corneal thickness and its association with intraocular pressure: the Rotterdam study. Am J Ophthalmol. 1997; 123:767–72.

7. Doughty MJ, Zaman ML. Human corneal thickness and its impact intraocular pressure measures: a review and meta-analysis approach. Surv Ophthalmol. 2000; 44:367–408.
8. Herndon LW, Weizer JS, Stinnett SS. Central corneal thickness as a risk factor for advanced glaucoma damage. Arch Ophthalmol. 2004; 122:17–21.

9. Kim JW, Chen PP. Central corneal pachymetry and visual filed progress in patients with open angle glaucoma. Ophthalmology. 2004; 111:2126–32.
10. Kim JH, Lee EK, Kim CS, Lee NH. Central corneal thickness and visual field progression in primary open angle glaucoma. J Korean Ophthalmol Soc. 2007; 48:1088–95.
11. Choi HJ, Kim DM, Hwang SS. Relationship between central corneal thickness and localized retinal nerve fiber layer defect in no-rmal-tension glaucoma. J Glaucoma. 2006; 15:120–3.

12. Budenz DL, Chang RT, Huang X, et al. Reproducibility of retinal nerve fiber thickness measurements using the stratus OCT in normal and glaucomatous eyes. Invest Ophthalmol Vis Sci. 2005; 46:2440–3.

13. Burgansky-Eliash Z, Wollstein G, Chu T, et al. Optical coherence tomography machine learning classifiers for glaucoma detection: a preliminary study. Invest Ophthalmol Vis Sci. 2005; 46:4147–52.

14. Huang ML, Chen HY. Development and comparison of automated classifiers for glaucoma diagnosis using Stratus optical coherence tomography. Invest Ophthalmol Vis Sci. 2005; 46:4121–9.

15. Leung CK, Chan WM, Yung WH, et al. Comparison of macular and peripapillary measurements for the detection of glaucoma: an optical coherence tomography study. Ophthalmology. 2005; 112:391–400.
16. Medeiros FA, Zangwill LM, Bowd C, et al. Evaluation of retinal nerve fiber layer, optic nerve head, and macular thickness measurements for glaucoma detection using optical coherence tomography. Am J Ophthalmol. 2005; 139:44–55.

17. Kanamori A, Nagai-Kusuhara A, Escano MF, et al. Comparison of confocal scanning laser ophthalmoscopy, scanning laser polarimetry and optical coherence tomography to discriminate ocular hypertension and glaucoma at an early stage. Graefes Arch Clin Exp Ophthalmol. 2006; 244:58–68.

18. Lalezary M, Medeiros FA, Weinreb RN, et al. Baseline optical coherence tomography predicts the development of glaucomatous change in glaucoma suspects. Am J Ophthalmol. 2006; 142:576–82.

19. Manassakorn A, Nouri-Mahdavi K, Caprioli J. Comparison of retinal nerve fiber layer thickness and optic disk algorithms with optical coherence tomography to detect glaucoma. Am J Ophthalmol. 2006; 141:105–15.

20. Lee ES, Kim CY, Ha SJ, et al. Central corneal thickness of Korean patients with glaucoma. Ophthalmology. 2007; 114:927–30.

21. Brandt JD, Beiser JA, Kass MA, Gordon MO. Central corneal thickness in the Ocular Hypertension Treatment Study (OHTS). Ophthalmology. 2001; 108:1779–88.

22. Brandt JD. Central corneal thickness–tonometry artifact, or something more? Ophthalmology. 2007; 114:1963–4.

23. Henderson PA, Medeiros FA, Zangwill LM, Weinreb RN. Relationship between central corneal thickness and retinal nerve fiber layer thickness in ocular hypertensive patients. Ophthalmology. 2005; 112:251–6.

24. Kaushik S, Gyatsho J, Jain R, et al. Correlation between retinal nerve fiber layer thickness and central corneal thickness in patients with ocular hypertension: an optical coherence tomography study. Am J Ophthalmol. 2006; 141:884–90.

25. Mumcuoglu T, Townsend KA, Wollstein G, et al. Assessing the Relationship Between Central Corneal Thickness and Retinal Nerve Fiber Layer Thickness in Healthy Subjects. Am J Ophthalmol. 2008; 146:561–6.

26. Leske MC, Heijl A, Hussein M, et al. Factors for glaucoma progression and the effect of treatment: the early manifest glaucoma trial. Arch Ophthalmol. 2003; 121:48–56.
27. Leske MC, Heijl A, Hyman L, et al. Predictors of long-term progression in the early manifest glaucoma trial. Ophthalmology. 2007; 114:1965–72.

Figure 1.
Correlation between average RNFLT* measured by OCT‡ and CCT† in glaucoma and glaucoma suspect subjects (R2=0.00, p=0.88). * RNFLT=retinal nerve fiber layer thickness; † CCT=central corneal thickness; ‡ OCT=optical coherence tomography.

Figure 2.
Correlation between VF‡ MD* and CCT† in glaucoma and glaucoma suspect subjects (R2=0.01, p=0.11). * MD=mean deviation; † CCT=central corneal thickness; ‡ VF=visual field.

Figure 3.
Correlation between VF‡ PSD* and CCT† in glaucoma and glaucoma suspect subjects (R2=0.01, p=0.14). * PSD=pattern standard deviation; † CCT= central corneal thickness; ‡ VF=visual field.


 PDF
PDF ePub
ePub Citation
 Print
Print


 XML Download