

 PDF
PDF ePub
ePub Citation
 Print
Print


INTRODUCTION
Thyroid cancer is the most common cancer type in Korea. Excellent prognosis allows most thyroid cancer patients survive for a long time. For this reason, long-term medical conditions are crucial in thyroid cancer patients. According to the 2015 American Thyroid Association Management Guidelines (1), thyroid-stimulating hormone (TSH) suppression after treatment is recommended according to the risk stratification. Since thyrotoxicosis is associated with high bone turnover osteoporosis and fracture, there is a concern about osteoporosis after TSH suppression. Previous studies showed that decreased bone mineral density (BMD) is possible in women with TSH suppression, especially in the post-menopausal status (23). However, 2 case-control studies in Korean women showed that the TSH suppression did not decrease BMD (45).
The Korea National Health and Nutrition Examination Survey (KNHANES) is a nationwide, cross-sectional study with a stratified, clustered sampling method (6). Launched in 1998, the KNHANES continues to assess the health and nutritional status of Koreans, health risk factors, and prevalence of chronic diseases which represent the general Korean population. In this study, we used the KNHANES data to investigate the BMD in thyroid cancer patients.
METHODS
1. Study participants
The KNHANES was conducted by Korea Centers for Disease Control and Prevention (6). Further detail about the KNHANES is available on the KNHANES website (https://knhanes.cdc.go.kr). We collected the data from 2008 (second year of the KNHANES IV) to 2011 (second year of the KNHANES V), because BMD was checked only in those periods (6). Among a total of 37,753 participants, 18,618 subjects were included based on 2 criteria of age above 20 years old and complete BMD measurements.
2. Study parameters
Age, gender, residence, occupation, alcohol intake, smoking history, exercise, and history of thyroid cancer were retrieved from the health interview data of the KNHANES. Regions were categorized as urban and rural according to the residential addresses. Following a previous report (7), occupations were categorized as indoor and outdoor work assuming different exposure to sunlight. Alcohol intake was defined as “high” when more than one glass per month was consumed all over the past one year. Smoking history was categorized as “current”, “former” and “never”. The “never” category included those who smoked fewer than 5 packs during their entire lives. Active exercise was indicated as “yes” in the case of vigorous exercise more than 20 minutes at a time and more than 3 times per week. Thyroid cancer history was found in the cancer section when specified as “thyroid cancer” in the years 2008 and 2009. From 2010, thyroid cancer was described in a separate section.
Body mass index (BMI), BMD, parathyroid hormone (PTH), 25-hydroxyvitamin D, and alkaline phosphatase (ALP) were retrieved from the health examination data. BMD was expressed as a T-score of total femur, proximal femur, and lumbar spine. Osteoporosis was defined if one of the T-score was below or equal to −2.5. Osteopenia was defined if one of the T-score was between −1.0 and −2.5. If all of the T-scores were above −1.0, BMD was described as normal. The level of PTH, 25-hydroxyvitamin D, and ALP were measured using standard laboratory techniques.
3. Statistical analysis
Complex sample analyses were performed because the KNHANES data had specific sample weights using complex sample design (6). Continuous variables like age and BMI were expressed as weighted means±standard error by the complex sample general linear model analysis. Nominal variables like gender were expressed as un-weighted numbers with weighted percentages by the complex sample crosstabs analysis. To investigate the effect of thyroid cancer on BMD, multivariate analyses were performed using the complex sample ordinal regression analysis for the adjustment of possible confounding factors according to normal, osteopenia, and osteoporosis. All analyses were carried out using SPSS software, version 23 (IBM Corp., Chicago, IL, USA).
RESULTS
Among the 18,618 subjects included, 80 thyroid cancers were observed. Mean duration after diagnosis of thyroid cancer was 3.72±0.33 years. Basic characteristics after univariate analysis are summarized in Table 1. Thyroid cancer cases were significantly older (P=0.011) and female predominant (P<0.001). Alcohol intake and smoking were low in thyroid cancer cases (P<0.001). No significant difference in BMI, region, occupation, exercise, and BMD were observed. The level of 25-hydroxyvitam D and ALP were not different in thyroid cancer cases. However, the PTH level in thyroid cancer was significantly decreased (P<0.001).
Table 1
Basic characteristics according to thyroid cancer
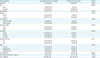
Table 2 summarizes results of all subjects according to the normal, osteopenia, and osteoporosis. Osteopenia and osteoporosis were more frequent in patients of old age, females, those with low BMI, low alcohol intake, and no smoking history. PTH and ALP levels were higher in osteopenia and osteoporosis (P<0.001). There were no differences in osteopenia and osteoporosis with or without thyroid cancer cases (P=0.783).
Table 2
Univariate analysis of BMD in all subjects
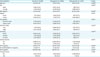
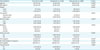
Table 3 summarizes the subgroup analysis of women. Osteopenia and osteoporosis were more frequent in patients of old age, women, those with low BMI, low alcohol intake. PTH and ALP levels were higher in osteopenia and osteoporosis (P<0.001). There were no differences in osteopenia and osteoporosis with or without thyroid cancer cases (P=0.685).
Table 3
Univariate analysis of BMD in women
In the subgroup analysis of post-menopausal women (Table 4), osteopenia and osteoporosis were less frequent in thyroid cancer cases in univariate analysis (P=0.003), but the difference was not significant in multivariate analysis (P=0.095).
Table 4
Univariate analysis of BMD in post-menopausal women
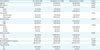
Continuous values are presented as mean±standard error. Nominal values are presented as un-weighted number with (weighted %).
BMD = bone mineral density; BMI = body mass index; PTH = parathyroid hormone; ALP = alkaline phosphatase.
*P value was also significant in multivariate analysis; †P value was 0.095 in multivariate analysis.
DISCUSSION
Decreased BMD is one of expected adverse effects after a life-long TSH suppression of thyroid cancer. Previous studies on this topic yielded conflicting results, especially in women. In the pre-menopausal women, 9 studies showed a decreased BMD, while 20 other studies showed no change (2). In the post-menopausal women, 11 studies showed a decreased BMD, while 19 showed no change (2). In men with TSH suppression, only one of eight studies showed a decreased BMD (2). In the present study, the results suggest that, as compared to non-thyroid cancer patients, thyroid cancer patients have no difference in BMD. In the subgroup analysis, there was also no difference in BMD in women and post-menopausal women. These results were consistent with several previous Korean studies (45).
Furthermore, in the present study, we observed a significantly decreased PTH level in thyroid cancer patients without difference in vitamin D and ALP. Hypoparathyroidism is a well-known post-operative complication of thyroid surgery. Post-operative hypoparathyroidism has a protective effect in BMD, as compared to normal parathyroid function (58). Therefore, the decreased PTH level observed in the present study can be related to the lack of differences in BMD.
The strength of the present study is that we investigated a large population based the KNHANES data which represents the general Korean population. The results of this study can be generalized to the Korean thyroid cancer patients. In addition, there was no previous study about the BMD change in the Korean thyroid cancer using the KNHANES data. However, our study has several limitations. First, we could not obtain the data about the TSH level, operational type, or history of medication for osteoporosis. As the KNHANES checked the BMD from 2008 to 2011 and the TSH level was included from 2013, we could not verify the degree of the TSH suppression and some patients with no TSH suppression could be included. The BMD will change according to the medication, like calcium or bisphosphonate. Therefore, a detailed history of medication was necessary, but not possible to obtain. The second limitation of this study is a relatively short duration of thyroid cancer history. Mean duration time after diagnosis was 3.72 years. In the review article of 27 studies (9), the mean follow-up time of 16 studies that showed no change of BMD was 7.94 years; the mean follow-up time in 11 studies that showed decreased BMD was 6.83 years. Therefore, it can be assumed that short duration time after diagnosis could not have been related to negative results. The third limitation of the present study is that the number of thyroid cancer patients was considerably smaller than that of non-thyroid cancer patients. The un-weighted number of thyroid cancer cases was 80 (0.4% of the total number of cases). However, this limitation was overcome by employing each subject's weight used by complex sampling method of the KNHANES. The fourth and final limitation of the present study is that, due to the cross-sectional design of our research, the causal relationships in the observed differences cannot be determined. The KNHANES is not a prospective study, which makes it difficult to define the cause and effect. In this study, osteopenia and osteoporosis were more prevalent in of the patients without smoking history. In general, smoking is known as a risk factor for osteoporosis. We interpreted this result as that deterioration of health caused by osteoporosis make to stop smoking.
In conclusion, the results of the present study show that osteopenia and osteoporosis are not more common in thyroid cancer patients than in non-thyroid cancer patients in Korea. The women and post-menopausal women with thyroid cancer also have no difference in BMD as compared to non-thyroid cancer female patients. However, as specified above, the present study has several limitations, which makes it imperative to interpret our results with caution and calls for further research on the issue at stake.
 XML Download