Abstract
Background
This study aimed to investigate the complexity of the relationships between socioeconomic status, health behaviors, stress and risks of metabolic syndrome. By applying structural equational modelling, modified generalized conceptual model had described the associations and interactions among them.
Methods
24,210 participants (8,242 men, 15,968 women) registered with the Korean Health Examinee Cohort (KOEX) between 2004 to 2008. This study collected data on the socioeconomic status, health behaviors, and stress through individual interviews. Socioeconomic status (education, house income, occupation), health behaviors (diet, physical activity, smoking, alcohol consumption) and stress level were defined as exogenous factors. Endogenous variables were risks of metabolic syndrome based on modified National Cholesterol Education Program Adult Treatment Panel-lll (NCEP ATP-lll, 2006).
Results
According to model fitness test, these proposed model were acceptable in men, comparative fit in-dex=0.877, incremental fit Index=0.877, Tucker-Lewis index=0.757, root-mean-squared error associated=0.055. These were compatible also in women as comparative fit index=0.924, incremental fit index=0.924, Tucker-Lewis index=0.851, root-mean-squared error associated=0.050. There were sex difference related to risks of metabolic syndrome: in men socioeconomic status (β=-0.08), health behaviors (β=-0.25) and stress (β =-0.25) were relevant, but in women only socioeconomic status (β=-0.25) was relevant (P<0.05).
Conclusions
A conceptual model properly explains how Socioeconomic status may influence on health behaviors, stress, and risks of metabolic syndrome. Health behaviors in men and socioeconomic status in women had the strongest associations with risks of metabolic syndrome. In addition, socioeconomic status was strongly associated with health behaviors, stress and age.
References
1. Tamashiro KL. Metabolic syndrome: links to social stress and socioeconomic status. Ann N Y Acad Sci. 2011; 1231:46–55.

2. Story M. Kaphingst KM, Robinson-O'Brien R, Glanz K. Creating healthy food and eating environments: policy and environmental approaches Annu Rev Public Health. 2008; 29:253–72.
3. Sallis JF, Cervero RB, Ascher W, Henderson KA, Kraft MK, Kerr J. An ecological approach to creating active living communities. Annu Rev Public Health. 2006; 27:297–322.

4. Gruenewald TL, Karlamangla AS, Hu P, Stein-Merkin S, Crandall C, Koretz B, et al. History of socioeconomic disadvantage and allostatic load in later life. Soc Sci Med. 2012; 74:75–83.

5. Kondo N, Sembajwe G, Kawachi I, van Dam RM, Subramanian SV, Yamagata Z. Income inequality, mortality, and self rated health: metaanalysis of multilevel studies. BMJ. 2009; 339:b447 1.

6. Steven HW, Steven J, Evonne KL. Health promotion and disease prevention in clinical practice. 2nd edition.Philadelphia: Lippincott Williams & Wilkins;2007. p. 5–7.
7. Braveman PA, Cubbin C, Egerter S, Chideya S, Marchi KS, Metzler M, et al. Socioeconomic status in health research: one size does not fit all. JAMA. 2005; 294:2879–88.
8. Wilkinson RG, Pickett KE. The problems of relative deprivation: why some societies do better than others. Soc Sci Med. 2007; 65:1965–78.

9. Baumann M, Spitz E, Guillemin F, Ravaud JF, Choquet M, Falissard B, et al. Association of social and material deprivation with tobacco, alcohol and psychotropic use and gender: a population study. Int J Health Geogr. 2007; 6:50–62.

10. Matthews KA, Räikkönen K, Gallo L, Kuller LH. Association between socioeconomic status and metabolic syndrome in women: testing the reserve capacity model. Health Psychol. 2008; 27:576–83.

11. Amiri P, Deihim T, Taherian R, Karimi M, Gharibzadeh S, Asghari-Jafarabadi M, et al. Factors affecting gender differences in the association between health-related quality of life and metabolic syndrome components: Tehran Lipid and Glucose Study. PLoS One. 2015; 10(12):): e0143167.

12. Alberti KG, Eckel RH, Grundy SM, Zimmet PZ, Cleeman JI, Donato KA, et al. Harmonizing the metabolic syndrome: a joint interim statement of the international Diabetes Federation Task Force on Epidemiology and Prevention; National Heart, Lung, and Blood Institute; American Heart Association; World Heart Federation; International Atherosclerosis Society; and International Association for the Study of Obesity. Circulation. 2009; 120(16):);. 1640–5.
13. The Korean society for equity in health. Methods in health inequalities measurement. Paju: Hanul;2008. p. 70–83.
14. Kim DH. Effect of Job and leisure time physical activity in the risk of colorectal cancer: a case-control study [disseration]. Seoul: Seoul National University;1997. Korean.
15. Lee CY, Lee JY. Reliability and validity of PWI (psychosocial wellbeing index). Korean J Prev Med. 1996; 29(2):255–64.
16. Yu JP. Concept and understanding of structural equation modelling. 1st ed.Seoul: Hannarae publishers;2012. p. 360–9.
17. Lynch JW, Kaplan GA. Socioeconomic position: Social epidemiology. New York: Oxford University Press;2000. p. 13–35.
18. Ford ES, Zhao G, Tsai J, Li C. Low-risk lifestyle behaviors and all-cause mortality: findings from the National Health and Nutrition Examination Survey III Mortality Study. Am J Public Health. 2011; 101(10):1922–9.

19. Elwood P, Galante J, Pickering J, Palmer S, Bayer A, Ben-Shlomo Y, et al. Healthy lifestyles reduce the incidence of chronic diseases and dementia: evidence from the Caerphilly cohort study. PLoS One. 2013; 8(12):): e81877.

20. Silventoinen K, Pankow J, Jousilahti P, Hu G, Tuomilehto J. Educational inequalities in the metabolic syndrome and coronary heart disease among middle-aged men and women. Int J Epidemiol. 2005; 34(2):327–34.

21. S⊘ltoft F, Hammer M, Kragh N. The association of body mass index and health-related quality of life in the general population: data from the 2003 Health Survey of England. Qual Life Res. 2009; 18(10):1293–9.

22. Chen YC, Wu HP, Hwang SJ, Li IC. Exploring the components of metabolic syndrome with respect to gender difference and its relationship to health-promoting lifestyle behaviour: a study in Taiwanese urban communities. J Clin Nurs. 2010; 19(21–22):3031–41.

23. Lim H, Nguyen T, Choue R, Wang Y. Sociodemographic disparities in the composition of metabolic syndrome components among adults in South Korea. Diabetes Care. 2012; 35(10):2028–35.

24. Park MY, Kim SH, Cho YJ, Chung RH, Lee KT, Association of leisure time physical activity and metabolic syndrome over 40 years. Korean J Fam Med. 2014; 35(2):65–73.
25. Kim SH, Park JY, Kim DH. Socioeconomic status and health behaviors associated with metabolic syndrome in adults over 40 years. korean J Health Promot. 2013; 13(4):125–32.
26. Ferguson TF, Funkhouser E, Roseman J. Factor analysis of metabolic syndrome components in the Coronary Artery Risk Development in Young Adults (CARDIA) study: examination of factors by race-sex groups and across time. Ann Epidemiol. 2010; 20(3):194–200.

27. Judge TA, Cable DM. When it comes to pay, do the thin win? The effect of weight on pay for men and women. J Appl Psychol. 2011; 96(1):95–112.

28. Bleich SN, Jarlenski MP, Bell CN, LaVeist TA. Health inequalities: trends, progress, and policy. Annu Rev Public Health. 2012; 33:7–40.

29. Sapolsky RM. Why Zebras Don't Get Ulcers. 3rd ed.New York: Holt Paperbacks;2004. p. 9–12.
30. Hendrie GA, Coveney J, Cox DN. Defining the complexity of childhood obesity and related behaviours within the family environment using structural equation modeling. Public Health Nutr. 2012; 15(1):48–57.
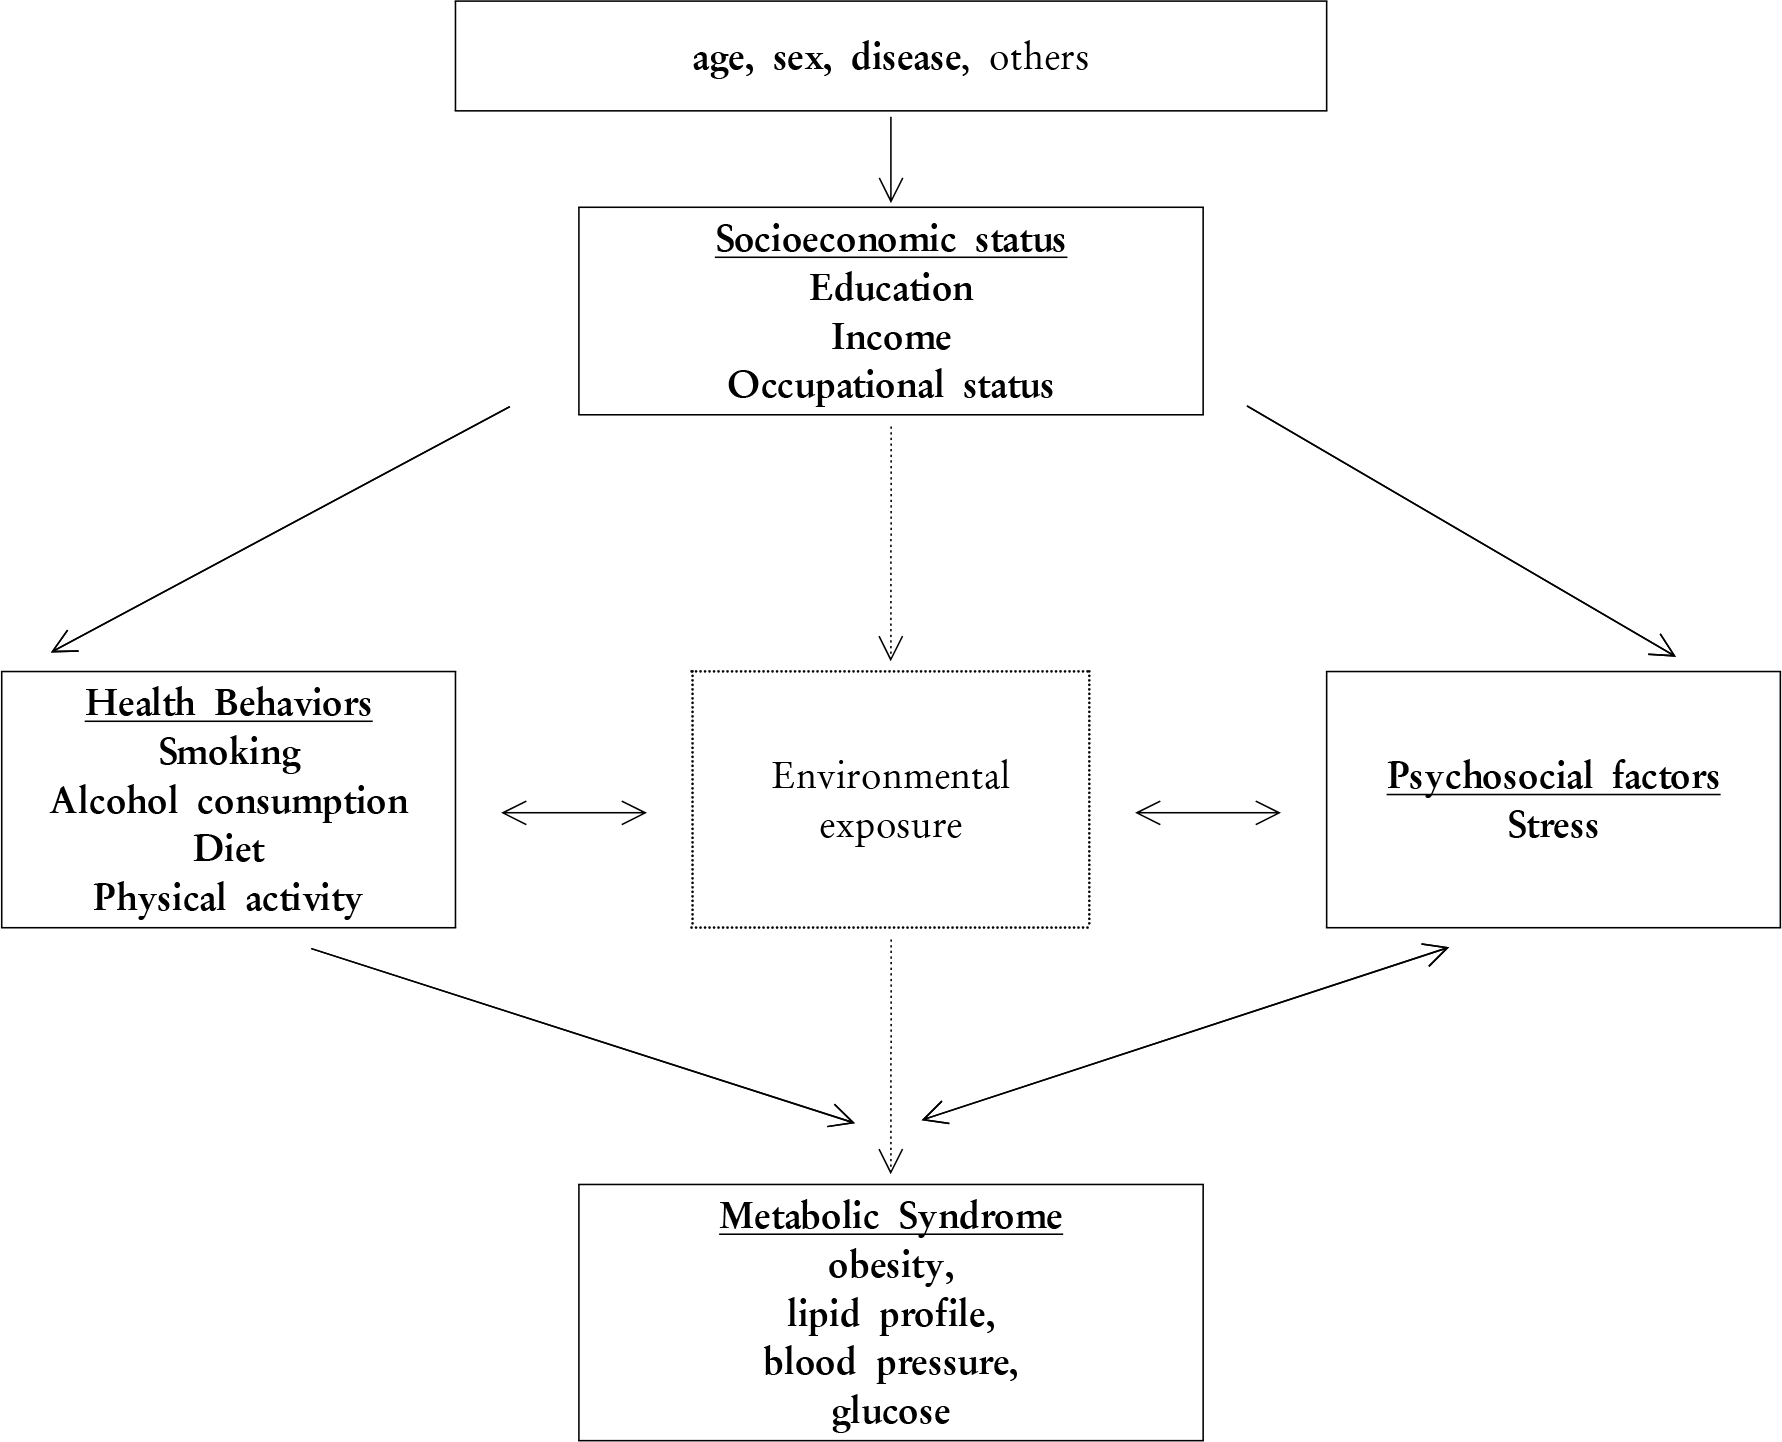
Figure 1.
Modified generalized conceptual model of potential pathway through which social status is linked to health.

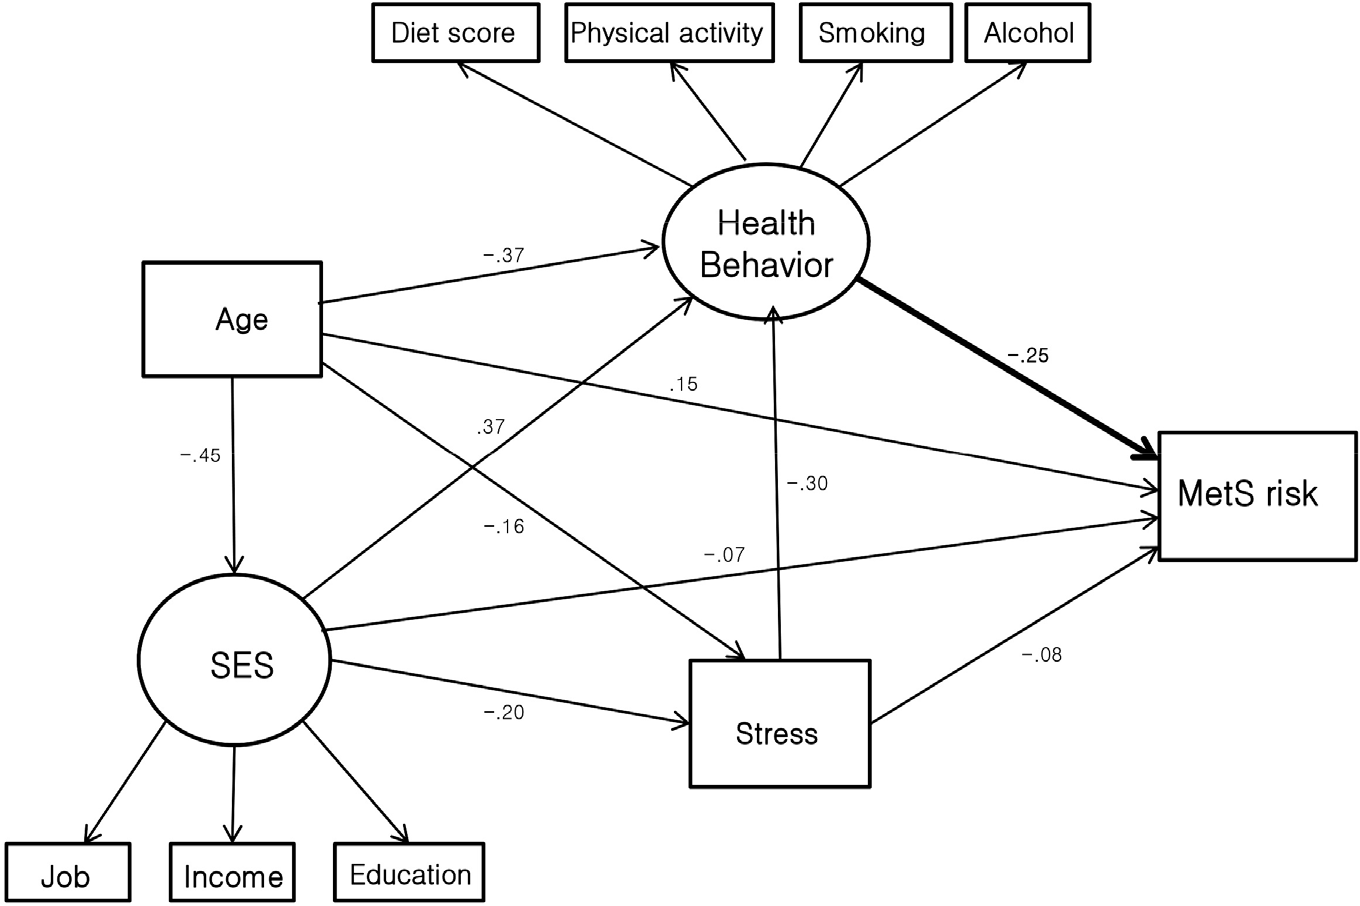
Figure 2.
Modified conceptual model; a summary of the interactions of Socioeconomic status (SES) influencing metabolic syndrome risk, in men Path coefficients are presented as standardised regression weight; dashed lines represent relationships that were non significant, model fitincluded in the exploratory analysis, but were non-significant. Model fit: X2=40.395, d.f=28, P<0.001, CFI=0.924, IFI=0.924 TLI=0.851, RMSEA=0.050.

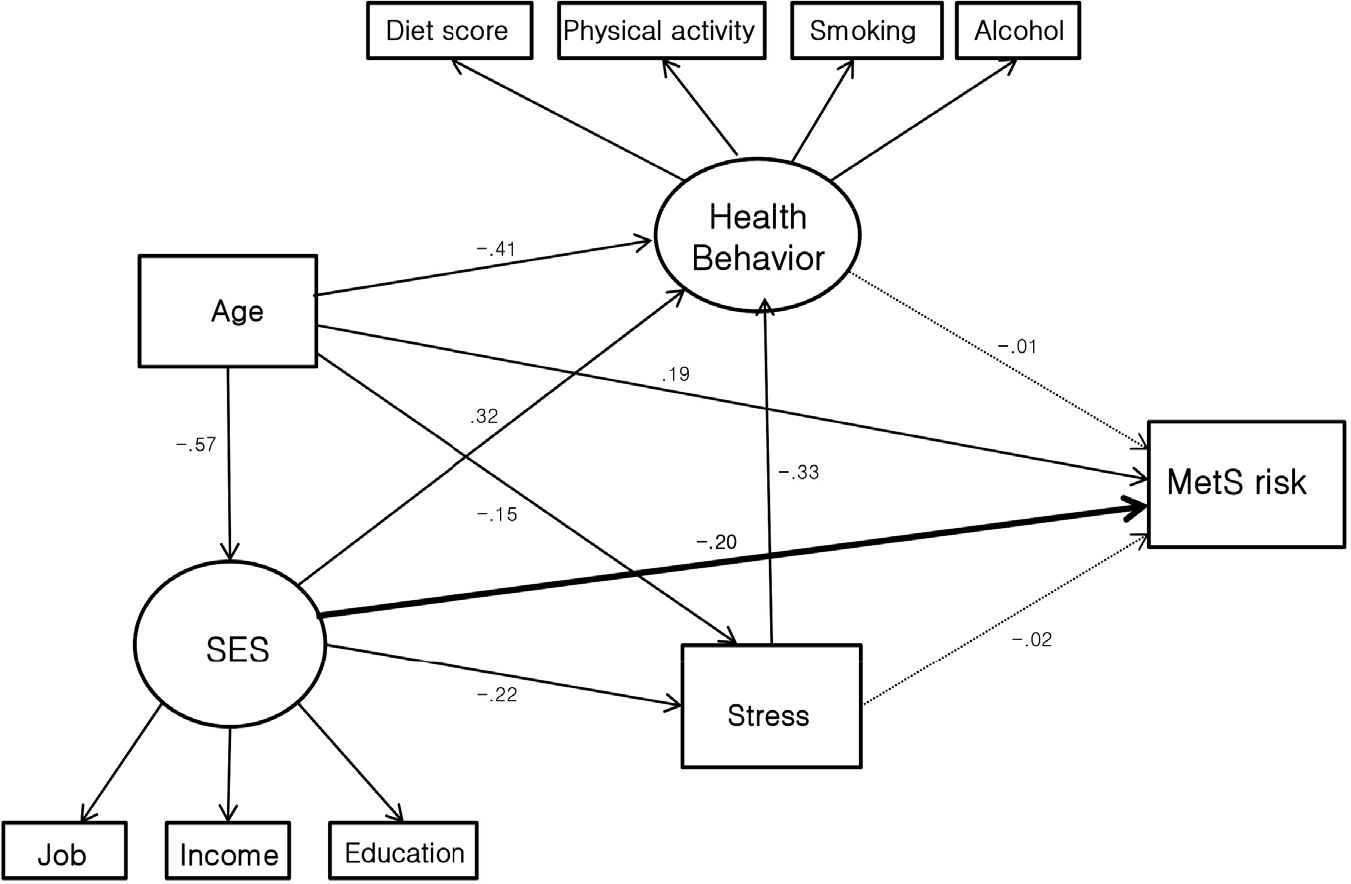
Figure 3.
Modified conceptual model; a summary of the interactions of Socioeconomic status (SES) influencing metabolic syndrome risk, in men path coefficients are presented as standardised regression weight; dashed lines represent relationships that were non significant, model fit included in the exploratory analysis, but were non-significant. Model fit: X2=35.843, d.f=28, P<0.001, CFI=0.877, IFI=0.877, TLI=0.757, RMSEA=0.055.

Table 1.
Health behaviors, stress, and socioeconomic status of study population
| Variables | Total (n=24,210) | |||
|---|---|---|---|---|
| Men (n=8,242) | Women (n=15,968) | P | ||
| General characteristics and health behaviorsa | ||||
| Age, y | 52.9±8.1 | 50.8±7.1 | <0.001 | |
| Smoking, pack years | 15.4±16.0 | 0.2±1.9 | <0.001 | |
| Alcohol intakeb, g/day | 25.9±36.5 | 2.4±8.8 | <0.001 | |
| Exercisec, Kcal/day | 201.0±250.9 | 180.3±203.3 | <0.001 | |
| Diet scored | 13.9±2.7 | 15.7±2.9 | <0.001 | |
| Score of psychosocial wellbeing index (PWI)e | 16.0±7.8 | 18.5±8.2 | <0.001 | |
| Socioeconomic statuse | ||||
| Education, y | None | 49 (0.6) | 207 (1.3) | <0.001 |
| < 6 | 66 (0.8) | 271 (1.7) | ||
| 6–8 | 626 (7.6) | 2,187 (13.7) | ||
| 9–11 | 963 (11.7) | 2,763 (17.3) | ||
| 12–13 | 2,840 (34.5) | 6,324 (39.6) | ||
| 14 | 338 (4.1) | 479 (3.0) | ||
| 15 | 247 (3.0) | 335 (2.1) | ||
| 16–17 | 2,273 (27.6) | 2,907 (18.2) | ||
| ≥ 18 | 840 (10.1) | 495 (3.1) | ||
| House income, 10,000 won | <50 50–99 | 362 (4.4) 342 (4.1) | 984 (6.2) 1,022 (6.4) | <0.001 |
| 100–149 | 666 (8.1) | 1,435 (9.0) | ||
| 150–199 | 812 (9.9) | 1,472 (9.2) | ||
| 200–299 | 1,886 (22.9) | 3,399 (21.3) | ||
| 300–300 | 1,777 (21.6) | 3,109 (19.5) | ||
| 400–599 | 1,643 (19.9) | 3,103 (19.4) | ||
| ≥600 | 754 (9.1) | 1,444 (9.0) | ||
| Job | Managers, Professionals | 1,541 (18.7) | 1,319 (8.3) | <0.001 |
| Office workers | 1,285 (15.6) | 855 (5.3) | ||
| Sales workers | 729 (8.8) | 1,705 (10.7) | ||
| Service workers | 651 (7.9) | 917 (5.7) | ||
| Operatives | 2,724 (33.1) | 1,712 (10.7) | ||
| Soldier | 82 (1.0) | 0 | ||
| House wife | 0 | 9,197 (57.6) | ||
| Unemployed | 1,183 (14.3) | 137 (0.9) | ||
| Non response | 47 (0.6) | 126 (0.8) | ||
Table 2.
Comparison of metabolic syndrome and it's components, and prevalence of diabetes and cardiovascular disease according to gender
| Variables | Total (n=24,210) | ||
|---|---|---|---|
| Men (n=8,242) | Women (n=15,968) | P | |
| Component of MetS, BMI and number of MetS componenta | |||
| Waist | 85.9±7.3 | 78.9±7.8 | <0.000 |
| BP systolic, mmHg | 125.9±14.8 | 118.9±15.2 | <0.001 |
| diastolic, mmHg | 79.1±10.2 | 73.8±10.0 | <0.001 |
| TG, mg/dL | 150.0±105.7 | 105.7±69.1 | <0.001 |
| FBS, mg/dL | 95.4±16.6 | 89.6±14.1 | <0.001 |
| HDL, mg/dL | 49.2±11.5 | 56.2±12.4 | <0.001 |
| BMI, kg/m2 | 24.4±2.7 | 23.5±2.8 | <0.001 |
| Number of MetS | 1.6±1.2 | 1.1±1.1 | <0.001 |
| Prevalence of chronic disease and metabolic syndromeb | |||
| CVA | 140 (1.7) | 128 (0.8) | <0.001 |
| MI | 297 (3.6) | 287 (1.8) | <0.001 |
| Diabetes | 717 (8.7) | 737 (4.6) | <0.001 |
| MetS | 2,291 (27.8) | 2,650 (16.6) | <0.001 |
Table 3.
Confirmatory factor analysis and pathway analysis: regression weight and standarized regression weight for measures of Metabolic syndrome risk
| Variables | Total (n=24,210) | |||||
|---|---|---|---|---|---|---|
| Men (n=8,242) | Women (n=15,968) | |||||
| Regression | Standarized | P | Regression | Standarized | P | |
| weight | regression weight | weight | regression weight | |||
| Factor loading of latent variables | ||||||
| SES | ||||||
| Job | 1 | 0.63 | <0.001 | 1 | 0.35 | <0.001 |
| House income | 0.14 | 0.71 | <0.001 | 0.29 | 0.71 | <0.001 |
| Education | 0.13 | 0.65 | <0.001 | 0.27 | 0.72 | <0.001 |
| Health behavior | ||||||
| Diet scorea | 1 | 0.37 | <0.001 | 1 | 0.36 | <0.001 |
| LTPA, Kcal/day | 75.69 | 0.31 | <0.001 | 56.32 | 0.28 | <0.001 |
| Pack year | 4.10 | 0.26 | <0.001 | 0.30 | 0.16 | <0.001 |
| Alcohol intakeb, g/day | 10.8 | 0.30 | <0.001 | 1.74 | 0.20 | <0.001 |
| Pathway coefficients | ||||||
| SES | ||||||
| Age | –0.52 | –0.45 | <0.001 | 0.39 | –0.57 | <0.001 |
| Health behavior | ||||||
| Age | 0.05 | 0.37 | <0.001 | 0.06 | 0.14 | <0.001 |
| SES c | 0.04 | 0.37 | <0.001 | 0.07 | 0.32 | <0.001 |
| Stressc | –0.04 | –0.30 | <0.001 | –0.04 | –0.33 | <0.001 |
| Stressc | ||||||
| Age | –0.15 | –0.16 | <0.001 | –0.18 | –0.16 | <0.001 |
| SES | –0.16 | –0.20 | <0.001 | –0.37 | –0.22 | <0.001 |
| MetS risk | ||||||
| Age | 0.02 | 0.15 | <0.001 | 0.03 | 0.19 | <0.001 |
| SES | 0.01 | 0.07 | <0.001 | –0.05 | –0.20 | <0.001 |
| Health behavior | –0.31 | –0.25 | <0.001 | –0.01 | –0.01 | 0.54 |
| Stressc | –0.01 | –0.08 | <0.001 | –0.00 | –0.02 | 0.06 |


 PDF
PDF ePub
ePub Citation
 Print
Print


 XML Download