

 PDF
PDF ePub
ePub Citation
 Print
Print


Introduction
Proton therapy, so called “the dream cancer therapy machine”, has garnered global interest, because the therapy does not impart unnecessary doses to organs other than the target tumor.1) Quality assurance (QA) is periodically performed on radiotherapy equipment to ensure accurate patient treatment. The task groups (TGs) of the American Association of Physicists in Medicine (AAPM) and the International Commission on Radiation Units and Measurements (ICRU) recommend numerous QA items for proton therapy devices, including a periodic analysis of proton spot checks.2345) Proton beam spot checks are performed on proton therapy devices that are capable of pencil beam scanning to enable intensity modulated proton therapy (IMPT). Tools for analyzing the spot position and spot width of a proton pencil beam have been developed as an alternative to dedicated instruments such as radiochromic films, which have been tested for measuring a proton therapy device and are used to acquire a spot at each energy level.6) The software developed by our team can easily and accurately analyze the spot position and spot width of a proton. The software consists of an image processing method, which finds the spot geometry and its center, and a Gaussian fitting method, which calculates the center and standard deviation of a spot by using Gaussian fitting from the maximum value around the spot.
Materials and Methods
1. S/W configuration and image correction
The software consists of four tabs and a file menu: “Image correction,” “Selection mode,” “All-in-one mode,” and “Results.” In the Image correction tab, the following options are available: correcting the left and right distortions of the imported image from the File menu, setting the center coordinates of the image, setting the background value, setting the dpi, and checking the film size.
The first step is to check whether the left and right sides of the image are distorted when a film image is imported, and to further correct the distortion of the image. The left and right distortions of the image are calculated by using the center point of two or three spots on the same horizontal line in the image. As a calculation method, the geometric center of the selected spots is calculated by using the cv2 module of Python. The slope of these centers is calculated, and the distortion of the image is corrected by using the corresponding tangential angle.
After the left and right distortions of the image are corrected, the center coordinates of the image can be set, and the position of the center of the spots to be subsequently analyzed is calculated based on the designated center. The method for setting the center coordinates of the image is to designate the center of the image matrix, the geometric center of the spot clicked by the user, and the coordinates that the user clicks. The background of the image allows the user to designate a region of interest (ROI), which defines the average pixel value in the designated area as the background. If there is a point with a difference of 5% or more from the average value, an error message is displayed, and the ROI must be designated again. The dots per inch (dpi) option allows the user to enter the dpi when scanning in order to obtain the actual size of the imported image. The actual size of the image can be obtained by dividing the number of pixels in the row and column by the dpi value.
2. Spot analysis
After the image correction process, the spot of the film can be analyzed. Analysis methods are divided into selection mode and all-in-one mode. While selection mode designates one spot and analyzes the spot only, the all-in-one mode allows the user to specify the ROI in the image and to analyze all spots in the specified ROI at once. In the selection mode, 100×100 pixels, 150×150 pixels, or 200×200 pixels is selected, and the spot is analyzed by extracting only the region of the size from the area neighboring the user-designated spot.
All image processing is performed by using only the red channel value from the imported image. The image is blurred through a Gaussian filter to eliminate noise in the image. Users can select one of the six Gaussian filters from a combination of two mask sizes (5×5 pixels or 15×15 pixels) and 1, 2, or 3 sigma. After applying a Gaussian filter to the image, a binary image is created with a threshold value of 20% of the maximum pixel value subtracted by the background (pixel values are set to 1 if above the threshold and 0 if below the threshold). The cv2 module of Python is used to find the contour of the binary image inner circle and to find its geometric center as well. By subtracting the coordinates of the center of the image, as designated in image correction, from the discovered center coordinates, the x and y coordinates of the designated spot can be obtained. Furthermore, a Gaussian graph can be plotted by extracting the pixel values of the x and y axes according to the user-designated size based on the discovered center, and the full width half maximum (FWHM) and sigma can be calculated. FWHM calculations are performed by connecting the two points depicting a 50% threshold between the maximum value in the plotted graph and the background. The standard deviation can be calculated by dividing the calculated FWHM by 2.355.
Another method for analyzing the spot is the Gaussian fitting method.7) The Gaussian fitting method discovers the maximum pixel value around the clicked coordinates when the user clicks on the spot to analyze. Based on the maximum value, the lmfit module of Python is used to fit the linear equation of the background region and the Gaussian distribution of the spot region. The center point of the spot is reset by using the average value obtained from the fitting curve, and to further calculate the FWHM of the fitting curve.
3. Results tab
In the table of the Results tab, the distance from the center of the previously analyzed spots and the FWHM value are determined. A user can create a location for the actual spot on all analyzed spots by using the Results tab. Pushing the “average reduce” button calculates the difference between the actual position of the spot created by the user, and the calculated position in the software. The average of all position differences is calculated and subtracted from the position of the spot calculated by the software. By using the export button, the contents of the table can be saved in the .xls format.
4. Film analysis
By using the developed software, spots obtained from QA for the previously commissioned proton therapy system (Sumitomo Proton Therapy System, Sumitomo Heavy Industries, Ltd.) were analyzed.89) There are 14 total films, including 15 spots per film. All films were scanned at 120 dpi through a film scanner (EPSON, Expression 11000XL, Epson Co., Japan). The measured proton energies were 150, 190, and 230 MeV. All spots were analyzed by using the image processing method and Gaussian fitting method.
Results and Discussion
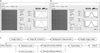
Fig. 1 shows an example of analyzing a 230-MeV spot film using the developed software. Fig. 1a shows the results of a spot analysis by using the image processing method. Fig. 1b shows the results of a spot analysis by using the Gaussian fitting method. If a user clicks on the spot to analyze, the software indicates the spot the user clicked with a red circle, as in a film image of the figure, and further shows the distance of the spot center from the image center, as well as the FWHM (mm, standard deviation). In the example of Fig. 1, the results of FWHM sigma analysis by the image processing method were 3.24 mm in the x-axis direction and 3.24 mm in the y-axis direction. The results of FWHM sigma analysis by the Gaussian fitting method were 3.07 mm in the x-axis direction and 3.15 mm in the y-axis direction. Furthermore, the error of the distance between the spot center and the image center was 0% in the x-axis direction, and 0.6% in the y-axis direction in the image processing method. For the Gaussian fitting method, the error was identified as 0.6% in both the x-axis and y-axis directions.
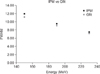
The results of analyzing 14 films (210 spots) confirmed that FWHM was statistically analyzed as shown in Table 1. The results indicate that as the energy increased, the size of the FWHM decreased. Moreover, the results of FWHM analysis by using the image processing method are relatively higher than those by using the Gaussian fitting method. The results are shown in Fig. 2. Although the results are from the fitting result with the original image with the Gaussian fitting method, the results for the image processing method were obtained by analyzing the image with a distorted image through image blurring. Thus, the FWHM results of the spot become larger.
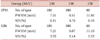
To prove this hypothesis, we used two 230-MeV spot films to compare the FWHM measurements between a Gaussian filter with a Gaussian sigma of 5×5 and 1 sigma, which is less blurred during the preprocess of the image processing for the same spot; and a Gaussian filter of 15×15 and 3 sigma, which is more blurred relative to the former. As the size of the Gaussian filter increased, 18 of the 30 spots showed no change in FWHM, whereas an average of 3.54% sigma increased in 12 spots. The results mentioned above are listed in Table 2. Therefore, the results show that the FWHM increased when the FWHM analysis was performed by using the Gaussian filter (image processing method) rather than the Gaussian fitting method by using the original image (Gaussian fitting method).
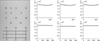
To prevent noise from being detected as a spot when using the image processing method, a threshold is assigned to the area of a region where noise is detected when a binary image is created to determine whether the region is a spot or noise. However, despite using the same energy spot, the area of the spot can vary according to its position. This phenomenon affects the spot detection rather than the FWHM results that are calculated from the geometric center in the original image. As shown in Fig. 3, the background of the same film varies according to the position of the x-axis, resulting in this phenomenon. When the background of the higher side is measured as a global background, the difference between the pixel value and the background value at the spot is not large. Accordingly, the spot area is measured as relatively narrow and is determined as noise. Thus, it is not detected as a spot.
Conclusion
In this study, we developed a software program that can easily analyze the QA results of the proton pencil beam scanning by using an image processing method and Gaussian fitting method. As the software program mentioned above can analyze the spot film more accurately and can reduce the analysis time, the software can be used for a spot QA analysis by proton treatment institutions.

 XML Download