

 PDF
PDF ePub
ePub Citation
 Print
Print


INTRODUCTION
Transient reversible lesions (TSL) in the splenium of corpus callosum are often found on MR imaging, with the patients recovering without any neurologic defects after mild clinical courses (1). MR imaging have shown restricted diffusion in the central portion of splenium of corpus callosum (2). Many studies have presented the causing factors of TSL, defining hypothetic pathogenesis. These lesions are well documented to be associated with antiepileptic drugs (3-8).
MATERIALS AND METHODS
We retrospectively reviewed imaging findings and medical records in seven patients (M: F = 4: 3; age range 11-38 years, mean age 25.5 years) with TSL between November 2006 and April 2011.
For MR examinations, 1.5 T (GE Electrical Medical Systems, SIGNA EXITE, SIGNA HDXT, Milwaukee, Wisc., USA, Philips Medical systems, Gyroscan Intera, Best, the Netherlands) or 3.0 T units (Philips Medical systems, Intera Achieva, Best, the Netherlands) were used in all patients. Imaging protocol for 1.5T units included non-enhanced axial T1 [repetition time (TR)=416 ms, echo time (TE)=10 ms, section thickness=5 mm, 320×192 matrix, field of view (FOV)=22×22 cm], and T2 (TR=4000 ms, TE=122 ms, section thickness=5 mm, 320×256 matrix, FOV=22×22 cm)-weighted images (WI), gradient echo image (TR=567 ms, TE=15 ms, section thickness=5 mm, 320×224 matrix, FOV=22×22 cm), diffusion weighted imaging (DWI) (TR=10000 ms, TE=79 ms, section thickness=3 mm, 128×128 matrix, FOV=24 ×24 cm, b value=1000 s/mm2), apparent diffusion coefficient (ADC) map and contrast enhanced axial, coronal and sagittal imaging.
For 3.0 T units, imaging protocol was as follows: T1WI [TR=2000 ms, TE=10 ms, section thickness=5 mm, 276×214 matrix, FOV=22×22 cm], T2WI (TR=3000 ms, TE=80 ms, section thickness=5 mm, 400×304 matrix, FOV=22×22 cm), gradient echo image (TR=454 ms, TE=13 ms, section thickness=5 mm, 276×277 matrix, FOV=22×22 cm), DWI (TR=4464 ms, TE=46 ms, section thickness=3 mm, 128×126 matrix, FOV=24×24 cm, b value = 1000 s/mm2), ADC map and contrast enhanced axial, coronal and sagittal T1WI with multiplanar reconstruction (TR=9.8 ms, TE=4.6 ms, section thickness=3 mm, 240×240 matrix, FOV=24×24 cm).
We analyzed lesion location, MR signal intensity, restricted diffusion on DWI and ADC map, enhancement pattern, and reversibility on follow up images.
We also evaluated the clinical symptoms and signs, underlying disease or previous medication history, and the treatment and outcome according to the medical records.
RESULTS
Imaging Findings
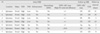
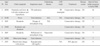
MR imaging findings and ADC values in seven patients are summarized in Table 1 and 2. All lesions were single and located in the splenium of corpus callosum, which showed focal high signal intensity on DWI. Six of the lesions showed restricted diffusion on ADC map. ADC map was not available in one case (patient #6). All cases showed high signal intensity on T2WI, and low (n=4) or iso (n=3) signal intensity on T1WI. Hemorrhage was not found on gradient echo image and enhancement in all patients. Four of the lesions were ovoid shaped and three were round in appearance.
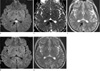
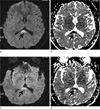
Five of the seven patients showed complete resolution of focal high signal intensity on follow up DWI as well as T2WI. ADC values in these patients recovered to those of normal appearing white matters (Fig. 1). One case (patient #3) showed partial reversibility on follow up DWI and ADC map as well as T2WI. The ADC value was partially recovered (Fig. 2). One case (patient #5) did show aggravation without reversibility on DWI/ADC map and T2WI, although clinical symptoms including headache was improved. In this patient, ADC value was not recovered but aggravated. The mean interval between the first MR image showing TSL and follow up MR image was 14.8 days (range 7-34 days) in the cases showing complete resolution on follow up MR image, whereas it was 3.5 days (range 2-5 days) in the two cases (patient #3 and #5) which did not show complete reversibility of TSL. In addition to TSL, other abnormalities on the brain MRI were shown in two patients (patient #1 and #3). In one patient (patient #1), meningitis as well as cerebritis and myelitis in thalamomesencephalon, medulla obologata, and upper cervical spinal cord were shown. In another patient (patient #3), left hippocampal sclerosis was suspected.
Clinical Findings
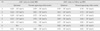
The clinical findings are summarized in Table 2. Three patients were presented with headaches without fever, and one patient was presented with flu-like symptoms such as fever. The other three patients showed CNS symptoms, including weakness on one side, mental state change with seizure, and behavior change. CSF study was nonspecific in four of the seven patients, with the exception of one patient with TB meningitis.
Various possible etiologies caused TSL in this study, and we divided these factors into five categories. First is TB medication. One patient (patient #1) was presented with a headache and fever, followed by a left-side weakness and hypesthesia due to TB meningitis (confirmed by CSF study). The first MRI conducted 6 days after the initial symptoms showed diffuse leptomeningeal enhancement, which is suggestive of meningitis, without abnormal signal intensity in the splenium of corpus callosum. The second MRI was conducted 10 days after the first MRI, and DWI and ADC map showed restricted diffusion in the splenium. At that time, the patient was on TB medication, including pyrazinamide, isonicotinic acid, rifampicin, and ethambutol. As the splenial lesion abruptly appeared after the TB medication on the follow up MRI, this lesion may be attributed to the TB medication or TB meningitis.
For the second possible etiology, two of the seven patients had a history of withdrawal or change of antiepileptic drugs before the brain MRI was conducted. One of the two patients withdrew from the antiepileptic drug (Lamotrigine, Lamiart tab 100 mg, Dae Woong Pharm, South Korea) 7 days prior to the MRI. The other patient switched the antiepileptic drug (Carbamazepine, Carmazepine tab 200 mg, Myung In Pharm, South Korea) to another (Levetriacetam, Keppra tab 1000 mg, UCB S.A., Belgium). Thirdly, one case (patient #7) had an episode, involving loss of consciousness due to a large amount of blood loss (2000 mL) during cesarean section and hypoglycemia (48 mg/dL). Hypoglycemia was the suspected cause of abnormal signal intensity of splenial lesion. Fourthly, two cases (patients #2 and #6) had viral infection histories prior to showing TSL. They did not have any other suspected causes for the abnormality of the splenium other than the viral infections. The one last patient did not have any specific possible history which may have induced the brain lesion.
All patients showed complete recovery of symptoms after conservative treatments. Mean duration for recovery of clinical symptoms was 10.6 days (range 6 hours - 15 days) (Table 3).
DISCUSSION
Isolated signal intensity change in the splenium of corpus callosum on MR imaging has been described in many articles. It is not uncommon to find MR imaging of patients with mild neurologic symptoms (2). In addition to restricted diffusion on DWI and ADC map, imaging findings such as T2 high signal intensity, T1 iso or low signal intensity, non-hemorrhagic and non-enhancing lesions in our cases were not different from previous studies (4, 9, 10, 14). Several possible causes for TSL were also as introduced in previous studies (1, 3, 9, 11-13), including viral encephalitis, hypoglycemic encephalopathy, anticonvulsant drug withdrawal, alcohol, malnutrition, and traumatic axonal injury.
This study did find one other possible cause of TB medication or TB meningitis, which has not yet been introduced other than in one similar case report (14). In this study, we have classified the various suspected factors which may cause TSL into five categories. The first is that of TB related causes, such as TB medication or TB meningitis. Second category is the history of withdrawal or change of antiepileptic drugs before the conducted brain MRI. The third and fourth categories are hypoglycemia and viral infection, respectively. The last is that iatrogenic causes may induce TSL.
The pathophysiology of TSL has been hypothesized in several studies. According to Tada et al., intramyelinic edema and the influx of inflammatory cells and macromolecules, including associated cytotoxic edema, are two major mechanisms of TSL (10). Oster et al. has suggested a hypothesis on intramyelinic edema, transient disruption of energy metabolism, and ionic transport which may cause reversible myelin vacuolization or intramyelinic edema (6). Five of the cases in our study are not related to infection or inflammation. In those cases, TSL may be caused by intramyelinic edema rather than influx of inflammatory cells and macromolecules. However, TSL in the other two cases related to viral infection, may be caused by influx of inflammatory cells and macromolecules.
In our study, five of the seven cases showed complete reversibility of the splenial lesion and ADC values as in other studies (4, 9, 15). However, the other two cases (patient #3 and #5) showed partial reversibility and aggravation on follow up DWI/ADC map and T2 weighted images. The differential point between the two groups was the interval between the initial and the follow up MRI. Mean interval in the group of patients showing reversibility between the initial and the follow up MRI was 14.8 days in contrast to 3.5 days in the other group. The reversibility of TSL may therefore depend on the duration between the MRI's. In other words, the duration between the initial and the follow up MRI may have been too short for recovery in the two patients (patient #3 and #5). According to Tada et al., TSL patients had recovered completely within 1 month, mostly within 1 week following the neurologic symptom recovery (10). Thus, the follow up MRI for TSL should be conducted with long-enough interval time. If hypothesized from our cases, there needs be at least 7 days interval, as one case (patient #3) showed partial reversibility in 5 days after the initial MRI and another case (patient #6) showed complete reversibility in 7 days after the initial MRI.
Reviewing the current study along with various other studies on TSL, we found another interesting point. Considering that TSL often appears at a young age, there may be an age period of prevalence. In our case, the mean age of the patients was 25.5±9.32 years (range 11 - 38 years), and the mean age of the patients was 22.2±12.07 years (range 6 - 41 years) in the study of Bulakbasi et al. (9). However, we could not find a specific relationship between age and TSL.
There were several limitations in this study. First, we did not confirm complete reversibility in two cases, in which showed partial reversibility or aggravation in spite of improvement in clinical symptoms. Second, the lesions were not proved pathologically in all patients. Third, we could not obtain the ADC map image in one case (patient #6).
In conclusion, all TSL showed nonspecific imaging findings, including the restricted diffusion on DWI and ADC map. The preference of young age, an acceptable period of minimum 7 days for follow up MR images, and conservative treatment for reversibility are characteristic findings, with various etiologies discussed including the TB medication.
 XML Download