

 PDF
PDF ePub
ePub Citation
 Print
Print


INTRODUCTION
Multiparametric MRI (mpMRI) has various roles in prostate cancer management including detection, staging, localization, and aggressive evaluation (123456789). Although many studies revealed the usefulness of mpMRI before transrectal ultrasound (TRUS)-guided biopsy (10111213), prostate MRI is still commonly performed after diagnosis of prostate cancer by TRUS-guided biopsy. As post-biopsy hemorrhage has been thought to decrease detection and staging accuracy of MRI in prostate cancer, prostate MRI is recommended to be performed more than eight weeks after the biopsy to provide time for regression of the hemorrhage in the prostate gland (141516).
According to recent guidelines, delaying MRI after biopsy for tumor detection may be unnecessary, although a delay of six weeks or longer should be considered for staging (17). However, mpMRI allows reasonable diagnostic accuracy, even after biopsy (18). The hemorrhage exclusion sign (HES) can be helpful to delineate prostate cancer in a hemorrhagic background (19). Moreover, as a biopsy cannot precisely predict the clinical significance of prostate cancer, delaying the MRI for six weeks can be problematic for some patients (202122). If mpMRI can provide good accuracy for the staging of prostate cancer in post-biopsy patients, MRI does not have to be delayed after biopsy.
The purpose of this study was to evaluate differences in the staging accuracy of prostate cancer according to the extent of hemorrhage on mpMRI performed after biopsy.
MATERIALS AND METHODS
Subjects
This retrospective study was approved by the Institutional Review Board and the requirement for informed consent was waived. We identified 78 consecutive patients that were diagnosed with prostate cancer after 12-core TRUS-guided biopsy followed by prostate MRI and prostatectomy at our institution in 2014. We excluded seven patients that did not have prostatectomy specimen histologic maps. A total of 71 patients with a mean age of 66.6 (range, 49–78 years) were enrolled in this study. The mean interval between biopsy and MRI was 17.4 ± 10.2 days (range, 0–73 days). An interval between prostate biopsy and MRI greater than 21 days was considered a long interval.
MRI Technique
MRI was performed on 44 patients with 3-T (MAGNETOM Verio; Siemens Healthcare, Erlangen, Germany) system and 1.5-T MRI system (Achieva, Phillips, Best, The Netherlands) with a pelvic-phased array coil was used in the other 27 patients. In the absence of contraindications, 20 mg of scopolamine butylbromide (Buscopan; Boehringer Ingelheim, Ingelheim, Germany) was injected intramuscularly before MRI examination in order to reduce bowel movements.
The study protocol consisted of sagittal, coronal, and axial T2-weighted turbo spin echo (TSE) images (repetition time [TR] > 3200 ms, echo time [TE] 80–100 ms; echo train length, 14–18; matrix, 320 × 320 [3-T] or 210 × 210 [1.5-T]; slice thickness, 3 mm; field of view [FOV], 160 mm; in-plane resolution 0.5 × 0.5 mm [3-T] or 0.8 × 0.8 mm; flip angle, 140° or 90°), axial T1-weighted TSE images (TR 400 ms, TE 10 ms; slice thickness, 3mm; matrix, 320 × 320 [3-T] or 210 × 210 [1.5-T]; FOV, 160 mm; in-plane resolution 0.5 × 0.5 mm [3-T] or 0.8 × 0.8 mm; flip angle, 150° or 90°), and axial diffusion-weighted images (DWI, b value 0, 50, 500, and 1000 [3-T] or 0, 500, and 1000 [1.5-T]; slice thickness, 3 mm; matrix, 100 × 100 [3-T] or 106 × 69 [1.5-T]; FOV, 210 mm [3-T] or 160 mm [1.5-T]; in-plane resolution, 2.1 × 2.1 mm [3-T] or 1.5 × 2.3 mm [1.5-T]). Apparent diffusion-coefficient (ADC) maps were generated from DWI with b values of 50 and 1000 sec/mm2 in a 3-T MRI and 0 and 1000 sec/mm2 in a 1.5-T MRI. The dynamic contrast-enhanced (DCE) images were acquired for more than 4 minutes with 0.1 mmol/kg gadobutol (Gadovist, Bayer Schering Pharma, Berlin, Germany) and temporal resolution was 5–7s. In-plane resolution was 0.9 × 1.2 mm in a 3-T MRI and 1.0 × 1.0 mm in a 1.5-T MRI. Subtraction DCE images were not used for image analysis.
Image Analysis
Two radiologists with 22 and 5 years of experience in prostate imaging reviewed all prostate MRIs in consensus using a picture archiving and communication system (Maroview version 5.4, INFINITT Healthcare, Seoul, Korea). The reviewers were aware that the patients had been diagnosed with prostate cancer by TRUS biopsy but were not aware of the Gleason score or the size and location of prostate cancer that was confirmed after prostatectomy.
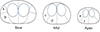
Peripheral and transition zones were demarcated on T2-weighted images (T2-WI), although the transition zone was not evaluated to determine the extent of hemorrhage in this study due to intrinsic heterogeneous signal intensity. The prostate gland peripheral zone was divided into 12 regions on the MRI: right and left sides of lateral and medial regions at the apex, middle, and base of the prostate gland (Fig. 1). Hemorrhage in each region was assessed using axial T1-weighted images (T1-WI). Hemorrhage was considered to be present when high signal intensity occupied the region. Patients with hemorrhage in more than 6 regions were classified in the large hemorrhage group.
The radiologists evaluated the local stage of the prostate cancer after reviewing the T2-WI, DWI, and DCE images. A mass with marked hypointensity on an ADC map with homogeneous signal intensity (SI) lower than the normal peripheral zone on T2-WI and early enhancement on DCE was regarded as prostate cancer on MRI. It is important for treatment plans to distinguish between non-organ-confined (pathologic stage ≥ T3) cancer and organ-confined (pathologic stage ≤ T2) cancer; therefore, we focused on increased sensitivity in order to diagnose non-organ-confined cancer. Non-organ-confined cancers include tumors with extracapsular extension (ECE), seminal vesicle invasion, and adjacent organ invasion. For tumor staging, we applied features indicating possibility of ECE suggested in Prostate Imaging - Reporting and Data System version 2 (PI-RADS v2). They included broad capsular contact (≥ 1 cm); capsular bulging; an irregular, spiculated, or angulated prostatic margin adjacent to the tumor; obliteration of the rectoprostatic angle; or thickening of the neurovascular bundle (17). When a tumor was not visible, we considered the tumor as organ-confined cancer. The HES suggested in a previous study was evaluated. The HES was defined as a well-defined area of a low-signal intensity nodule with surrounding high signal intensity on T1-WI (19).
MRI and Histology Correlation
Correlations between MRI findings and histologic results were assessed for each patient based on a histologic report and a histologic map where prostate cancers were marked. For local staging, accurate discrimination between organ-confined and non-organ-confined cancers on MRI was considered as correct. Images of tumors with incorrect MRI staging were reviewed with a histologic map to evaluate the causes of incorrect staging. Gleason score and tumor volume in each patient were collected from a histologic report.
Statistical Analysis
The Spearman correlation coefficient (r) was used to investigate the correlation between the number of hemorrhaged areas among 12 regions of the peripheral zone and the TRUS biopsy and MRI interval.
Differences in the frequency of correct staging of prostate cancers according to the extent of hemorrhage, interval between biopsy and MRI, magnetic field strength of MRI unit, T stage, HES, tumor volume, and Gleason score were assessed using Fisher's exact test. Univariate and multivariate logistic regression analyses were performed to determine factors that were associated with tumor staging. Variables with P value less than 0.25 in the univariate analysis were included in the multivariate regression analysis. Statistical analysis was performed with SPSS 24.0 (IBM Corporation, Armonk, NY, USA). A P value less than 0.05 was considered statistically significant.
RESULTS
Patient and Tumor Characteristics
Local stages of prostate cancers were T2a (n = 6), T2b (n = 5), T2c (n = 33), T3a (n = 13), T3b (n = 11) and T4 (n = 2) in 71 patients. Gleason scores of prostatectomy specimens were 6 (3 + 3, n = 6), 7 (3 + 4, n = 28), 7 (4 + 3, n = 23), and more than 8 (n = 14). There were 10 prostate cancers primarily located in the transition zone and only one of them showed ECE while 9 prostate cancers were organ-confined: T2a (n = 2), T2b (n = 2) and T2c (n = 5). There were 15 tumors less than 0.5 mL in volume.
Image Analysis
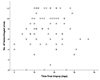
For all patients, the median number of hemorrhaged areas was eight (range 0–12), and there was no biopsy-related hemorrhage in three patients. Large and small amounts of hemorrhaging were divided into groups that consisted of 49 and 22 patients, respectively. There was no statistically significant correlation between the interval between prostate biopsy and MRI and the number of hemorrhaged areas (r = −0.018, P = 0.880) (Fig. 2).
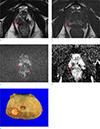
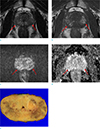
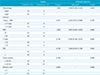
Preoperative MRI staging was accurate in 61 of 71 patients (85.9%). There was no visible prostate cancer in 16 patients (22.5%). Invisible cancers were confirmed as organ-confined cancers after prostatectomy and they had variable Gleason scores: 6 (3 + 3, n = 3), 7 (3 + 4, n = 8), 7 (4 + 3, n = 3), and more than 8 (n = 2). However, there was no invisible cancer in inaccurately staged cancers. Based on all of the tested factors including the extent of hemorrhage, interval between biopsy and MRI, and HES, there was no significant difference in staging accuracy. Since there was no factor with P value less than 0.25 identified with the univariate analysis, multivariate analysis was not performed (Table 1). Accurate staging was documented in 23 of the 26 non-organ-confined cancers (sensitivity 88.5% and specificity 84.4%). Prostate cancer with accurate preoperative staging on MRI was displayed in Figure 3. Seven T2 cancers were over-staged as T3 cancers on MRI, and three T3 cancers were under-staged as T2 cancers on MRI. Of the seven over-staged cases, hemorrhage was considered as prostate cancer in one patient, and six patients had prostate cancer with broad contact up to the prostate capsule. Among the three under-staged cases, readers could not detect focal invasion in the seminal vesicle in two patients and could not detect extracapsular extension due to tumor located at the apex in one patient. The patient with large amount of hemorrhage in the prostate gland is shown in Figure 4.
DISCUSSION
In this study, the extent of hemorrhage in the prostate gland was not correlated with the interval between prostate biopsy and MRI, which is in agreement with the results of a previous study (18). There was no significant difference in the accuracy rate of tumor staging between the large and the small hemorrhage groups and there was no factor that was associated with tumor staging accuracy.
Accuracy of MRI staging was not associated with any factors in this study. Hemorrhaging was considered as a prostate cancer lesion in only one patient, contrary to a previous study that showed there was a tendency to overestimate tumor presence and ECE on MRI that was performed less than 21 days after biopsy (14). MRI in a previous study consisted only of T1-WI and T2-WI, and the authors did not discriminate between hemorrhage and tumor; therefore, it is possible hemorrhage could have been mistaken as a tumor. In contrast, we were able to differentiate between hemorrhage and tumors and accurately determine tumor staging with mpMRI consisting of T2-WI, T1-WI, DWI, and DCE (18).
When conducting image analysis in the prostate gland with background hemorrhage, HES might be useful to detect prostate cancer (19). However, there were many invisible tumors in this study and some of them had high Gleason scores. Large amount of hemorrhage, small size of the prostate cancer, and low Gleason score can be reasons for invisibility. Nevertheless, all invisible tumors were organ-confined. Furthermore, staging accuracy was not statistically different between HES-negative and HES-positive patients. Since tumor staging is solely determined from the relationship between the tumor and the prostate capsule, HES seems to be useless to determine tumor staging and all inaccurately staged tumors were visible. So, invisibility might not impair staging accuracy.
Six organ-confined-cancers (≤ T2) had broad contact to the capsule and were over-staged as T3 cancers on preoperative MRI. We considered the tumor's broad capsular contact ≥ 1 cm as an ECE finding in this study. However, a previous study showed that 2 cm of tumor contact length was the best threshold to predict ECE (23). Over-staging for tumor with broad capsular contact may be caused by a 1 cm cut-off in our study. Broad capsular contact ≥ 1cm is described in PI-RADS v2 but > 1.5 cm was used in PI-RADS v1 (24), so the cut-off is still controversial. On the other hand, focal invasion into the seminal vesicle and the location of the tumor were the causes of inaccurate staging in under-staged cancers of our study. Microscopic invasion of the adjacent organ could not be accurately detected on MRI.
MRI may be utilized for prostate cancer detection any time after biopsy; however, a delay of more than 6–8 weeks post-biopsy has been recommended for prostate cancer staging (141617). The necessity of this long interval is based on the belief that hemorrhage resolves 6–8 weeks after biopsy. However, in this study the extent of hemorrhage in the prostate gland was not correlated with the interval between prostate biopsy and MRI, and several studies have also shown that absorption of hemorrhage was insufficient even after 6 weeks (182526). A long interval between biopsy and MRI does not seem to guarantee hemorrhage absorption in the prostate gland. Moreover, large amount of hemorrhage did not significantly impact tumor staging.
There were a few limitations in this study. First, because of the retrospective study design, we were not able to control the interval between biopsy and MRI. The median interval was 17 days in this study, relatively shorter than recommended (17). The insufficient hemorrhage regression in the prostate gland could be attributable to the relatively short interval between biopsy and MRI. However, there was no correlation between amount of hemorrhage and delay time to MRI in our study and we wanted to evaluate the impact of hemorrhage on tumor staging. Future study with repeated MRI at each time point after biopsy will solve the problem. Second, two radiologists reviewed MRI in consensus rather than independently. There was a large difference in the two radiologists' experience, and since we were not sure about reaching proper inter-observer agreement in image analysis of the prostate with large amounts of hemorrhage, we interpreted MRI in consensus. Third, we did not use PI-RADS v2 for image analysis. As PI-RADS v2 categorization is decided without considering T1 signal intensity, many hemorrhagic areas may be rated as PI-RADS 4 or 5 in spite of their T1 high-SI. Therefore, we concluded that PI-RADS v2 was not meaningful in this study.
In conclusion, biopsy-induced hemorrhage in the prostate gland is not absorbed sufficiently over time. The extent of hemorrhage and the short interval between biopsy and MRI may not impair tumor detection or staging on multiparametric MRI.
 XML Download