

 PDF
PDF ePub
ePub Citation
 Print
Print


INTRODUCTION
1. Background
The goals of the National Health Plan 2020 of the Korean government are to increase healthy life expectancy and improve health equity [1], and health projects in many countries around the world, including the US and Japan, also aim to achieve the same goals [2]. Frailty in older people is a very important issue in relation to achieving the goals of prolonging healthy life expectancy and improving health equity. In Korea, the prevalence of frailty among people aged 65 years and over is estimated to be 8.3%[3], which is higher than 6.9% in the US [4] and 6.0% in the Netherlands [5]. The prevalence rates of frailty among elderly aged 65 years and over in Korea, the US and the Netherlands were all estimated by applying the same criteria.
Many studies have shown that frailty in elderly is a major contributor to the loss of muscle mass and the decline in overall physical and cognitive functions [46], and the increases of mortality [7], falls [8], hospitalization and admission to long-term care facilities [6910]. Therefore, it has been suggested that the degree of frailty should be monitored regularly because it is effective for preventing exacerbations of frailty to detect and manage frailty in elderly as early as possible [11]. A Finnish study reported that home healthcare services in Finland are focused on the management of frail elderly to such a degree that 90% of the individuals that receive home healthcare services are frail elderly [11].
In Korea, older people aged 65 and over who are vulnerable groups in terms of socioeconomic and health status are managed through the home visiting health service program of public health centers [13]. Among elderly, frail elderly are classified as the intensive care group which requires at least 8 home visits within 3 months. These frail elderly are provided with diverse interventional programs, including programs related to nutritional management, oral health care, enhancement of emotional and cognitive function, management of urinary incontinence, exercise and fall prevention, and assessments of symptom control and changes in health status in elderly that receive home health care are performed [13].
So far, the majority of prior researches on the home health care implemented by public health centers have been cross-sectional studies of economically vulnerable groups [14], and most of the studies to evaluate the effects of home health care examined short-term effects of home health care over a period of less than a year, such as 8 weeks [15] or 8 months [16], in terms of blood pressure, blood sugar, depression, quality of life, bone density, obesity, and self-perceived health status. In addition, as for research on the effects of home health care in frail elderly, only one prior study compared the pre- and post-intervention assessment data of frailty after providing frail elderly with home health care for 3 years [17], so further research is needed to evaluate mid- and long-term effects of home health care in terms of the indicators described above.
The vision of home health care was to ‘enhance health equity’ and ‘increase healthy life expectancy in vulnerable people until 2018 [18], so most public health centers have provided home health care only to the elderly of economically vulnerable groups despite the principle regarding government projects which may cause social stigma should target the general population. Thus, there have been problems such as the subjects’ refusal of the home visits of the health service workers because they do not want their neighbors or others around them to know that they are recipients of the national basic livelihood security program.
In order to overcome the limitations of the home visiting health service program targeting only vulnerable social groups, one public health center in Seoul has been assessing and managing the level of frailty in the general population of elderly living in its jurisdiction regardless of socioeconomic status since 2008. Therefore, unlike prior studies, this study attempted to analyze the status of universal home health care targeting elderly at high risk among elderly living in the community, and to conduct a follow-up study of changes in the degree of frailty from the mid- to long-term perspective of 8 years. Since there were some dropouts over a long period of 8 years because of hospitalization due to illness, death, moving, and other reasons, there are limitations on the interpretations of the study findings.
However, given that the vision of the home visiting health service program of public health centers has been converted from the ‘increase of healthy life expectancy of vulnerable groups’ [18] to the ‘increase of healthy life expectancy’ for the general public in 2019[13], a follow-up study of the changes in the degrees of frailty observed after providing home health care to elderly continuously living in the community regardless of socioeconomic status is expected to present basic data needed for the home visiting health service program to establish itself in a more desirable direction in the future.
2. Purpose
This study aimed to follow-up changes in the degrees of frailty in elderly over 8 years, using the assessment data of a public health center in Seoul which assessed frailty in all the elderly in its jurisdiction and has provided high-risk frail elderly with home health care for 8 years. The specific objectives of this study are as follows:
• To investigate general characteristics, co-residing family members, and disease status in high-risk frail elderly receiving home health care;
• To analyze the number of home visits and contents of the services over the period of about 8 years when the home health care have been provided;
• To investigate changes in frailty in high-risk frail elderly who have received home health care for 8 years and identify the factors affecting changes in frailty.
3. Definition of terms
The management of frail elderly is a program which is aimed at promoting healthy life in old age and preventing the need for long-term care by restoring, maintaining, and promoting physical, cognitive, emotional, and social functions. To achieve these goals, the program performs assessments of frailty and detection of frail elderly among elderly who are not eligible for the national long-term care insurance, offers diverse interventions regarding physical activities, nutrition, oral care, management of urinary incontinence, depression prevention, cognitive enhancement, and fall prevention, and oral exercise to improve oral function such as chewing, swallowing, pronunciation, and salivation, and provides the support and encouragement for hobbies and social participation such as religious activities, education on creation of a safe environment inside and outside the home, and health education and emotional support for the family of the participants, and/or links the elderly with appropriate services. High-risk frail elderly receiving home visiting health service are those aged 65 years or older who have a frailty assessment score of 4 to 12 points [13].
METHODS
1. Study Design
This study is a secondary data analysis to examine the frequency and contents of home health care for frail elderly provided by a public health center in Seoul since they were registered for the interventions in 2010 and to investigate changes in the degrees of frailty in the elderly managed through home health care.
2. Data Collection
This study used the data on high-risk frail elderly who had been receiving home health care delivered by a public health center located in Seoul since they were registered for the program in 2010, and these data were obtained through the Public Health Information System (PHIS).
Since the PHIS contains only the assessment data of elderly who were registered in 2010 or later and the data of those registered before 2010 are not available, 1,723 people who were registered before 2010 were first excluded among a total of 5,525 people registered in the home visiting health service program. Then, 3,243 people who had received home health care for less than 8 years were additionally excluded, and only old adults whose frailty score was 4 to 12 points at the time of registration and who had received home health care for 8 or more years were included in the analysis. Thus, a total of 499 frail elderly were included in the final analysis and their data were entered for analysis. Among the elderly receiving home health care by the public health center, high-risk frail elderly were 83.3%(499 out of 559 people).
3. Statistical Power of the Study
To determine whether a sample size of 499 was sufficiently large in terms of statistical power, we calculated the sample size using the PASS program (version 1.2: NCSS, LLC. Kaysville, Utah, USA). With three repeated measurements at the significance level of 0.05, the minimum detectable difference between measurements over time was set to 0.29, the regression coefficient of frailty scores according to time in this study. After setting the variance of the residual of the fitting model at 2.25 and the autocorrelation coefficient at 0.6, statistical power was calculated to be 80%, indicating that the sample size was appropriate.
4. Variables
1) Characteristics of Frail Elderly Receiving home health care
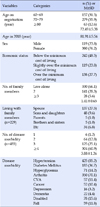
The general characteristics of elderly we examined in this study are gender, age, socioeconomic status, the number of co-residents and types of co-residents, relationships between elderly and co-residents (spouse, child, parent, sibling, etc.), and self-reported clinically diagnosed diseases (cerebrovascular disease, cancer, depression, dementia, registered disability, and falls).
2) Provision of home health care
In this study, we investigated the average total number of home visits per person per year during the 8 years of home health care and whether health education on health problems, such as medication instruction, physical exercise, nutrition, complications of hypertension, complications of diabetes, education on smoking cessation, education on moderate drinking, fall prevention, and emotional support, was conducted in 2018.
3) Frailty
Frailty, also referred to as senility, is an outcome variable that is measured annually after registration in the home visiting health service program, and it is considered as physiological vulnerability due to aging [17]. In this study, assessments were performed using a total of 28 questions listed in the manual of the home health care program. The assessment items included 5 questions regarding instrumental activities of daily living (using transportation, shopping, using banking services, going out, and consulting), 5 items on physical functions (climbing stairs, getting up from a chair, walking for 15 minutes, fall experience, and fear of falls), 2 questions on nutrition (presence of weight loss and underweight), 3 questions on oral health (eating, difficulty in swallowing, and dry mouth [xerostomia]), 2 questions on homeboundness (the weekly frequency of going out, and the frequency of going out compared to that of the previous year), 3 questions on cognitive function (forgetfulness, making a phone call, and time orientation), 5 questions on depression (emotional states in the past 2 weeks), 1 question on chronic diseases (the presence of 8 diseases including hypertension and diabetes), 2 questions on sensory function (the presence of visual and hearing impairments) and 1 question on gait evaluation (the Timed Up and Go (TUG) test) [18].
In the case of the items about the instrumental activities of daily living, physical function, oral health, homebound status, and cognitive function, 1 point is given if the participant does not have the ability to perform the relevant activity. For the item on chronic diseases, 0 point is given if the participant has no chronic disease, and 2 points are given if the participant has chronic disease. For the items on sensory function, 0 point is given if there is not visional or hearing impairment, 1 point if there is either visional or hearing impairment, and 2 points if the participant has both visional and hearing impairment. For gait assessment, 0 point is given if the participant walks a distance of 2.4m back to the starting point within 8.5 seconds, and 2 points if it takes more than 8.5 seconds. Consequently, the total scores range from 0 to 31 points, and higher scores indicate higher levels of frailty. In other words, it is assumed that a score of 0 to 3 points indicates healthy state, a score of 4 to 12 points indicates high risk of frailty, and a score of 13 or higher points indicates the frailty [18]. It was not possible to identify the reliability of the assessment instrument when it was developed by the Ministry of Health and Welfare [18]. In this study, the reliability coefficients of the assessment tool at baseline, at 4 years post baseline, and at 8 years were .819, .742, and .723, respectively.
5. Ethical Considerations
After obtaining written consent from the public health center regarding the use of the data of the home health care of the public center from the PHIS, and receiving a determination of exemption from the IRB of the institution where the researcher belongs regarding the secondary use of data (IRB no. 1041566-201903-HR-004-01), the relevant data without any personally identifiable information such as names, identification numbers and detailed addresses, telephone numbers, etc. were entered into the Excel program to conduct analysis.
6. Statistical Analysis
Analysis was performed according to the study purpose and the nature of the data, using the R program (version 3.6.1, the R Foundation for Statistical Computing, Vienna, Austria).
• Descriptive statistics were analyzed the characteristics of elderly receiving home health care and the contents of the services.
• To analyze the effects of home health care, a MMRM analysis of the follow-up data of a maximum of 8 years was performed. Frailty scores were used as the dependent variable, and the data were adjusted for age, gender, income level, number of co-residents, and the number of comorbidities. When a fitting model was built, the correlation matrix for AR(1) was considered, and the least square means (LS means) and 95% confidence intervals for the period of a maximum of 8 years from the registration time were derived from the fitted model.
RESULTS
1. General Characteristics of Participants
Of the total participants, 76.2% were women, and the majority of the participants lived alone (66.1%) or had one co-resident (28.3%) with the average household size of 1.41 persons. The average age was 72.49 years at the time of registration, and 81.91 years in the most recent data of 2018. For economic status, 48.5% were recipients of the national basic livelihood security program, 23.8% were the second-lowest income class, and 27.7% were not among economically vulnerable groups. The prevalence rates of self-reported clinically diagnosed diseases were 85.2% for hypertension, 70.1% for arthritis, and 36.7% for diabetes, and the average number of diseases per person was 3.88 (Table 1).
2. Provision of Home Health Care
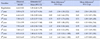
While home health care were provided for frail elderly for 8 years, the average number of home visits per person was 4.72 to 8.75 times a year. It was assumed that if an intervention is checked at least once a year in the intervention data of 2018, it indicates that the relevant intervention was offered. Under the assumption, medication instructions, exercise therapy, nutrition interventions, emotional support, education for fall prevention, and education for moderate drinking were offered at each visit, but education for prevention of complications of hypertension was offered during 85.7% of the total visits, education for prevention of complications of diabetes during 24.2% of the total visits, and smoking cessation counseling during 24.2% of the total visits (Table 2).
3. Changes in Frailty in Elderly Receiving Home Health Care
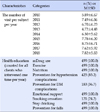
The changes in frailty scores were estimated through a mixed model for repeated measures (MMRM) analysis. In the MMRM analysis, gender, age, the number of co-residing family members, the number of diseases, and economic status were included as covariates, and changes in the scores of frailty in elderly receiving home health care were analyzed. The scores of frailty (0 to 31 points) estimated by adjusting for the covariates were 5.77 points at baseline (at the time of registration), 6.92 points at 4 years post baseline, 7.49 points at 6 years, 7.78 points at 7 years, and 8.06 points at 8 years, showing a statistically significant worsening of frailty over 8 years.
Until the first three years after registration in the home health care, there were no significant changes in frailty scores compared to the baseline, the measurements in the year when the participants were registered. However, the frailty score was increased significantly by 0.58 points at 4 years compared to the baseline value (95% CI 0.07~1.08; p=.025), by 2.42 points at 7 years (95% CI 1.32~3.51; p<.001), and by 2.12 points at 8 years (95% CI 1.61~2.64; p<.001). The comparative analysis between the frailty scores of two adjacent years over the period of the home health care showed that there were no statistically significant changes over a period of one year, indicating that frailty gradually worsens little by little every year (Table 3, Figure 1).
4. Factors Affecting Frailty Scores in Frail Elderly Receiving Home Health Care
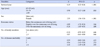
The frailty scores in frail elderly receiving home health care were used as the dependent variable, and the analysis of the factors affecting changes in frailty scores showed that as the period of home health care was longer, the frailty score was significantly increased (β=0.29, p<.001). In addition, the frailty score was higher in the 70~79 age group than in the 60~69 age group (β=0.98, p<.001), and it was higher in females than in males (β=2.55, p<.001) (β=3.1, p=.04) (Table 4, Figure 1).
DISCUSSION
While previous studies were conducted on short-term interventions over a period of less than a year for vulnerable social groups [18], this study evaluated the effects of medium- and long-term home health care interventions for at least 8 years for all older residents in the jurisdiction of a public health center.
According to prior studies, the percentage of frail elderly living in the community ranges from 4 to 59% [20]. These differences in the estimated percentages of frail elderly have been attributed to a wide variety of tools used to measure frailty [12]. In this study, the percentage of frail elderly among those receiving home health care was found to be 83.3%. Although there are some limitations in comparing this percentage with the findings of other studies, the percentage of frail elderly among the elderly receiving home health care in this study is relatively lower in comparison with the results of a Finnish study which performed assessments of frailty in elderly using the Comprehensive Geriatric Assessment (CGA) and reported that home visiting health care services in Finland are focused on the management of frailty in elderly to such a degree that 90% of the people receiving home health care services are frail elderly [12]. In this study, the average age of older people receiving home health care in Korea was 81.9 years, which is about 2 years lower than the average age of 84.7 years in elderly receiving home health care services in Finland. Considering that it is efficient for the prevention of aggravation of frailty to start the management of frailty as early as possible [12], there is a need to further strengthen the management of frail elderly in Korea.
The average number of home visits was 4.72 to 8.75 times a year. This may be due to guidelines on the home health care requiring that a visit be reevaluated after at least eight visits within three months of registration. This is to adjust the interval and frequency of visits according to the frailty change after 3 months [14]. With respect to the contents of the services, medication instruction, physical exercise, education on the need for nutritional management, emotional support, fall prevention, and education for moderate drinking were offered at each visit, and the most common types of interventions were education for prevention of complications of hypertension, education for prevention of complications of diabetes, and smoking cessation counseling. This can be attributed to the fact that the prevalence of hypertension (85.2%) was highest, followed by arthritis (70.1%), and diabetes (36.7%) among self-reported diagnosed diseases. However, it was not possible to identify all the specific contents of the interventions delivered during the visits of the health service workers because many of the data were superficial and were not sufficiently detailed. For example, the intervention data for each home visit recorded in the PHIS were identical in some cases. Therefore, it is necessary to make more specific record items for the contents of interventions in the PHIS.
The state of frailty did not worsen and the level of frailty at the time of registration was maintained during the first three years of home health care, but after 4 years, the level of frailty was significantly increased. Two possible explanations for these results can be presented as follows. First, individuals are usually registered as the participants of home health care at the age of 65 or 70, and when they are 69 and 74 years old after four years, they are relatively younger than or almost as old as the age of 70 years, the age for which it is recommended to include all the elderly in the management program for frail elderly [13]. This fact about the ages of participants may account for the assumption that while the level of frailty did not worsen and was maintained by the frailty management through about 8 home visits per year during the first 3 years, while frailty worsened with increasing age after 8 years of the intervention. These results are consistent with the findings of a prior study which evaluated the effects of home health care provided for 3 years in for frail elderly aged about 75 years, and reported the decrease in the level of frailty and depression [18].
Second, although the absence of a control group in this study poses some difficulty in drawing a definite conclusion, the results of this study indicated that the management of frail elderly did not have a significant effect on the reduction of frailty. It was pointed out that although many foreign studies have also shown that frailty is a result of complex interactions of diverse factors including physical, psychological, and social factors [21], most previous studies have the limitation that they were focused only on frailty related to diseases and physical frailty [22]. Although the specific contents of the interventions were not clearly identified in the present study, home health care were mainly composed of health education, such as medication instruction, physical exercise, education of the need of nutritional management, emotional support, fall prevention, education for moderate drinking, education for prevention of complications of hypertension and diabetes, and smoking cessation counseling. However, it is difficult to expect that improvements in frailty will be achieved by paying short visits 5 to 8 times a year and providing health education because most of the elderly receiving home health care are economically vulnerable groups. Specifically, 48.6% of them are recipients of the national basic livelihood security program, 23.9% belong to the second- lowest class, and only 27.5% are not among economically vulnerable groups. Although inequality in the life expectancy according to socioeconomic status has been improving to some degree in Korea [2], the disparity in life expectancy between the highest and lowest income groups has decreased only slightly from 4.98 years in 2010 to 4.58 years in 2013 and there is still a large gap in life expectancy. Therefore, in addition to health education on the methods of health management, it is necessary to more consistently and systematically provide diverse programs which help to improve frailty, such as intake of sufficient nutrients including protein, regular exercises combining isotonic and isometric exercises, and promotion of social activities [22].
The factors affecting changes in frailty scores in elderly receiving home health care were found to be the period of home health care, age, and female gender. A longer period of home-visiting health care services, higher age, and female gender were associated with higher levels of frailty among elderly, and these results are all thought to mean that the level of frailty becomes higher with age. As for variables other than these three variables related to age, economic status, the number of co-residing family members, and the number of comorbidities were not significantly related to changes in frailty. However, there is a need to investigate the quality of relationships with co-residing family members rather than the number of co-residing family members. In addition, since disease severity may vary among different comorbidities, it is necessary to reinvestigate the number of comorbidities, taking into account the states of comorbidities reflecting the severity of diseases.
The main risk factors for frailty in people receiving home health care in Finland were found to be undernutrition and low education level [12]. A German study has also reported that nutritional status is closely associated with frailty in elderly aged 75 and over [23]. According to another German study, since frailty is likely to occur in older people with undernutrition who have a Mini Nutritional Assessment (MNA) score of 17.0 to 23.5 points, there is a need to assess frailty in elderly [24]. A prior study of community-dwelling elderly aged 70 years and over in Korea has reported that as nutritional status was poorer and as the level of chewing discomfort was higher, frailty scores were lower [25]. Given that 64.3% of the individuals receiving home health care live alone and 73.5% of them are recipients of the national basic livelihood security program and the second-lowest class in Korea, undernutrition is not an unexpected problem, so it is necessary to provide substantial support for them rather than only providing education on the need for nutritional management.
The problem of undernutrition involves diverse factors, including the financial ability to purchase food ingredients, abilities to buy and cook foods, and social relationships which allow individuals to share eating pleasure. Among elderly in Korea, the percentages of elderly who are completely self-reliant in purchasing goods and in preparing meals were found to be 87.4% and 87.8%, respectively, among elderly aged 65 and over, and 90.1% and 90.2%, respectively, among elderly aged 60 years and over. Therefore, it is necessary to provide support for food purchasing and preparation to elderly who are not completely self-reliant in the activities [4]. The awareness rates for the free meal service and the meal on wheels among elderly were quite high at 73.0% and 64.8%, respectively, reflecting the reality regarding decreasing self-reliance with age in elderly. However, the experience rates for the two kinds of services were 3.8% and 1.4%, respectively, and the request rates for them were 33.8 and 35.0%, respectively, showing that the supply of the services is insufficient to meet demand [4]. For these kinds of supports for daily living, it would be more efficient to actively manage it by taking the approach of community care based on the involvement of the residents of the community where frail elderly live.
The main strengths of this study are that this study analyzed data relatively accurately recorded and accumulated for 8 or more years by well-trained home-visiting nurses, and that the analyzed data were not the data of vulnerable social groups but the data of all the elderly aged 65 years and over living in one region. However, this study has several limitations which should be addressed in future research.
First, since this study conducted a secondary analysis of the data of home health care delivered by a public health center, there was no data of a control group for comparison and thus it was not possible to identify the changes in frailty which can be attributed to the effects of the home health care, taking into account frailty and depression resulting from natural aging. Although it is practically very difficult to conduct a long-term experimental study in the community, it is necessary to conduct an experimental design study even for a short period by setting a region with similar characteristics as a control group. In addition, there is also a need to compare the degrees of frailty between the group of elderly who were excluded from this study and received general home health care rather than frailty management and the group of elderly who received frailty management.
Second, since this study analyzed the data of elderly living in an area of a metropolitan city, it has limitations in generalizing study findings. Therefore, it is suggested that public health centers in a wider range of regions provide a universal home visiting health service program for the total elderly population rather than only for vulnerable social groups. In particular, it is necessary to conduct periodic assessments of the total population of elderly aged 70 years and over [1013]. In addition, in consideration of the fact that home health care in Finland are focused on the management of frail elderly [12], it is necessary to adust the management of the home health care so that this program will be focused on the management of frail elderly and chronic disease management.
Third, since the PHIS contains no data on education level, which has been reported to be a high risk factor for frailty in many studies [30], ‘economic level’ was used as a proxy variable and treated as a covariate. Previous findings on the education level as a high risk factor for frailty suggest that education level has a significant effect on the understanding and practice of health education. Therefore, it is considered necessary to include the data of education level in the PHIS.
Fourth, although there are limitations in generalizing the study results since this study had no control group as in previous research on home health care which conducted an analysis of data over relatively long periods of time [17], the results of the present study showed that the current home health care have no significant effects on the management of frailty in elderly. This result is thought to reflect the limitations of the frailty management program which is focused on health education on diseases and uses health education as the main method. Since there are a wide variety of causes of frailty, research should be conducted to develop a more standardized and comprehensive model for management of frail elderly and evaluate its effectiveness through the practical application of the model.
Fifth, although changes in frailty scores are ultimately the most important outcome variable in the management of frail elderly, it is also considered necessary to analyze the long-term effects of home health care in terms of indicators such as depression, nutritional intake, blood pressure, blood glucose levels, cholesterol control, and body weight, which have been so far reported to be associated with frailty in elderly.
CONCLUSION
Unlike in existing home health care of public health centers centered on vulnerable groups, assessments of the degree of frailty were carried out among all the elderly aged 65 and 70 years living in the community. The analysis results showed that frailty worsened 4 years after the start of the intervention in elderly continuously managed through home health care for 8 or more years. In particular, this tendency was more prominent among older women of higher ages, so it is required to manage this group of elderly through more intensive home health care.
Currently, the home health care for frail elderly is being operated focused only on health education related to disease management. It is necessary to expand and reorganize the program into a more systematic and comprehensive program by including the interventions to provide adequate nutrition through community care and improve the practice rates of exercises to maintain muscle strength in addition to health education.

 XML Download