

 PDF
PDF ePub
ePub Citation
 Print
Print


Abstract
Purpose
The purpose of this study was to analyze factors influencing health-related quality of life (HRQoL) among male adults.
Methods
Participants were 196 male adults who were recruited from June to July 2016. Seven variables related to HRQoL including age, perceived stress, physical activities, problem drinking, social support, self-esteem, depression were measured. Data were analyzed using the SPSS/WIN 20.0 program and Amos 18.0 for descriptive statistics, Pearson correlation coefficients and path analysis.
Results
The mean for HRQoL was 80.14. The path analysis showed that depression had the greatest direct effect on HRQoL. It was found that perceived stress had direct and total effects on HRQoL. It also mediated the paths of social support and self-esteem to HRQoL. These factors account for 68% of the total variance, and the fit indices of the model satisfied the criteria of fitness.
Figures and Tables
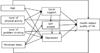
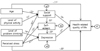
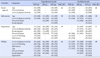
Table 1
General Characteristics (N=196)
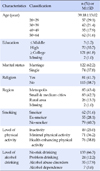
Table 2
Descriptive Statistics and Correlations Matrix of Measurable Variables (N=196)
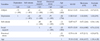
Table 3
Estimates and Effects of Predictor Variables in Hypothetical Model and Modified Model
References
1. World Health Organization. Global action plan for the prevention and control of NCDs 2013-2020 [Internet]. Geneva: World Health Organization;2013. cited 2016 October 1. Available from: http://www.who.int/nmh/events/ncd_action_plan/en/.
2. Ministry of Health & Welfare. Healthy Plan 2020. Sejong: Ministry of Health & Welfare;2015. 12. Report No.: 11-1352000-000285-13.
3. Ministry of Health & Welfare. Korea Health Statistics 2014: Korea National Health and Nutrition Examination Survey (KNHANES VI-2). Sejong: Ministry of Health & Welfare;2015. 12. Report No.: 11-1351159-000027-103.
4. Ware JE, Sherbourne CD. The MOS 36-item short-form health survey(SF-36): Conceptual framework and item selection. Med Care. 1992; 30(6):473–483.
5. Lee GH, Kim CH, Shin HC, Park YW, Sung EJ. The relation of physical activity to health related quality of life. J Korean Acad Fam Med. 2007; 28(6):451–459.
6. Cha EJ. Predictive model of health-related quality of life of Korean goose daddies. Korean J Adult Nurs. 2012; 24(4):428–437. DOI: 10.7475/kjan.2012.24.4.428.

7. Park MJ, Suh E, Chung MY. Health-related quality of life and its influencing factors according to gender in baby boomers. Korean J Adult Nurs. 2015; 27(3):314–324. DOI: 10.7475/kjan.2015.27.3.314.
8. Jeon EY, Choi YH. Factors affecting the health-related quality of life according to age in vulnerable aged men. J Korean Acad Nurs. 2010; 40(3):400–410. DOI: 10.4040/jkan.2010.40.3.400.
9. Park YR, Son YJ. Relationship of satisfaction with appearance self-esteem, depression, and stress to health related quality of life in women across the lifespan. J Korean Acad Fundam Nurs. 2009; 16(3):353–361.
10. Hwang WJ, Park YH. Factors affecting health-related quality of life Korean blue-collar workers. Korean J Occup Health Nurs. 2015; 24(2):94–102. DOI: 10.5807/kjohn.2015.24.2.94.
11. Ministry of Health & Welfare. Ministry of health and welfare statistical year book 2015. Sejong: Ministry of Health & Welfare;2015. 12. Report No.: 11-1352000-000137-10.
12. Lee HK, Roh SW. The relations of alcohol drinking behavior depressive mood and suicidal ideation among Korean adults. J Alcohol Sci. 2011; 12(1):155–168.
13. Park YR, Jang EH. Impact of stress on depression among university students: Testing for moderating effect of social support. Korean J Adult Nurs. 2013; 25(5):549–558. DOI: 10.7475/kjan.2013.25.5.549.
14. Shim OS. Effects of stress on health-related quality of life and moderating effect of self- esteem in patients on renal dialysis. J Korean Gerontol Nurs. 2010; 12(2):95–107.
15. Kim MR. The relationship between married womens' life stress and depression tendency: The mediating and moderating effects of self-esteem. Korean J Health Psychol. 2007; 12(4):761–777.
16. Choi H, Lee EO, Kim BW, Kim IJ. Stage of change for exercise and health-related quality of life in Korean adults. Korean J Adult Nurs. 2004; 16(2):191–201.
17. Lee DH. The effect of quality of life in the elderly's health condition. J Korean Gerontol Soc. 2010; 30(1):93–108.
18. Wilson IB, Cleary PD. Linking clinical variables with health-related quality of life: A conceptual model of patient outcomes. J Am Med Assoc. 1995; 273(1):59–65.
19. Hong JY, Kim JH, Kim OS. Factor influencing problem drinking of male drinkers according to life cycle. Korean J Adult Nurs. 2014; 26(2):139–148. DOI: 10.7475/kjan.2014.26.2.139.
20. Stevens J. Applied multivariate statistics for the social sciences. 3rd ed. Mahwah NJ: Lawrence Erlbaum Associates;1996. p. 659.
21. Radloff LS. The CES-D scale: A self-report depression scale for research in the general population. Appl Psychol Meas. 1977; 1(3):385–401. DOI: 10.1177/014662167700100306.
22. Weinert C, Brandt PA. Measuring social support with the personal resource questionnaire. West J Nurs Res. 1987; 9(4):589–602.
23. Suh MH, Oh KS. A study of well-being in caregivers caring for chronically in family members. J Korean Acad Nurs. 1993; 23(3):467–486.
24. Rosenberg M. Society and the adolescent self-image. Princeton, NJ: Princeton University Press;1965. p. 340.
25. Jon BJ. Self-esteem: A test of its measurability. Yonsei Nonchong. 1974; 11(1):107–130.
26. Cohen S, Kamarck T, Mermelstein R. A global measure of perceived stress. J Health Soc Behav. 1983; 24(4):385–396.
27. Craig CL, Marshall AL, Sjostrom M, Bauman AE, Booth ML, Ainsworth BE, et al. International physical activity questionnaire: 12-country reliability and validity. Med Sci Sport Exerc. 2003; 35(8):1381–1395. DOI: 10.1249/01.MSS.0000078924.61453.FB.
28. IPAQ Research Committee. Guidelines for the data processing and analysis of the international physical activity questionnaire [Internet]. Stockholm: Karolinska Institute;2005. cited 2015 August 1. Available from http://www.ipaq.ki.se/.
29. Saunders JB, Aasland OG, Babor TF, Fuente DL, Grant M. Development of the alcohol use disorders identification test (AUDIT): WHO collaborative project on early detection of persons with harmful alcohol consumption. Addiction. 1993; 88(6):791–804.
30. Kim JS, Oh MK, Park BK, Lee MK, Kim GJ, Oh JK. Screening criteria of alcohol use disorders identification (AUDIT) in Korea. J Korean Acad Fam Med. 1999; 20(9):1152–1159.
 XML Download