Journal List > J Korean Acad Community Health Nurs > v.26(3) > 1058388

Kim, Cho, and Park: The Effects of the Designated Doctor System on Health Care Utilization of Medical Aid Beneficiaries with Chronic Diseases

Abstract

Purpose

This study was conducted to examine differences in health care utilization and related costs between before and after the introduction of the designated doctor system, and to find out factors making the differences.

Methods

Data were collected from 200 medical aid beneficiaries having one or more chronic diseases, registered in the designated doctor system during the year of 2012, and the relationship between the use of health services and claimed medical expenses was analyzed through paired t-test and multiple regression analysis using the SPSS 18.0 program.

Results

There was a decrease in the number of total benefit days and the number of outpatient and medication days, but some cases showed an increase after the designation of medical institution. In general, hospital stay increased after the introduction of the system. However, the number of medical institutions utilized was reduced in most cases after designation. Conversely, medical expenses increased in most cases after the designation of medical institution.

Conclusion

These results suggest that a detailed scheme to designate medical institutions should be made in consideration of the seriousness of illness and classification of medical institutions not only for the beneficiaries' enhanced health but for the effective management of medical aid fund.

Figures and Tables

Table 1

General Characteristics of Beneficiaries with Designated Doctor System (N=200)
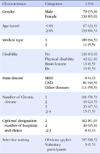
jkachn-26-278-i001
Characteristics Categories n (%)
Gender Male 70 (35.0)
Female 130 (65.0)
Age (year) <65 67 (33.5)
≥65 133 (66.5)
Medical type 1 189 (94.5)
2 11 (5.5)
Disability No 126 (63.0)
Physical disability 42 (21.0)
Brain lesions 13 (6.5)
Etc 19 (9.5)
Main disease SRID 8 (4.0)
CND 81 (40.5)
Other diseases 111 (55.5)
Number of Chronic disease 1 101 (50.5)
2 49 (24.5)
3 35 (17.5)
≥4 15 (7.5)
Optional designation number of hospitals and clinics 1 162 (81.0)
2 30 (15.0)
≥3 8 (4.0)
Selective sorting Obvious applier 197 (98.5)
Voluntary participants 3 (1.5)

SRID=severe/rare incurable diseases; CND=chronic notified diseases.

Table 2

Characteristics of Designated Doctor System (N=200)
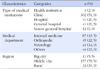
jkachn-26-278-i002
Characteristics Categories n (%)
Type of medical institutions Health institution 4 (2.0)
Clinic 102 (51.0)
Hospital 41 (20.5)
General hospital 41 (20.5)
Senior general hospital 12 (6.0)
Medical department Internal medicine 87 (43.5)
Orthopedic 45 (22.5)
Neurology 24 (12.0)
Others 44 (22.0)
Region Big city 11 (5.5)
Middle city 157 (78.5)
Rural 32 (16.0)
Table 3

A Change in Trend of Health Care Utilisation before and after the Introduction of Designated Doctor System based on the Characteristics of Individual Patient
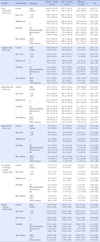
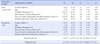
jkachn-26-278-i003
Variables Characteristics Categories Before (n=200) After (n=200) Difference t (p)
M±SD M±SD M±SD
Total benefit day (day/year) Gender Male 1,049.0±461.93 1,047.4±425.04 1.6±414.03 0.03 (.974)
Female 938.1±340.19 969.0±425.47 -30.9±458.64 -0.77 (.443)
Age (year) <65 984.5±401.43 1,039.1±437.22 -54.6±412.17 -1.09 (.282)
≥65 973.1±385.04 974.9±420.10 -1.8±457.88 -0.05 (.963)
Medical type 1 983.8±397.80 1,010.1±430.44 -26.2±450.95 -0.80 (.425)
2 857.6±172.12 761.9±249.77 95.7±250.08 1.27 (.233)
Disability No 957.8±393.30 1,012.3±427.65 -54.4±379.64 -1.61 (.110)
Physical disablity 1,019.5±337.45 966.0±456.30 53.5±504.09 0.69 (.495)
Brain lesions 1,051.0±406.57 770.4±304.19 280.5±358.64 2.82 (.015)
Etc 958.8±472.80 1,113.4±379.62 -154.5±629.73 -1.07 (.299)
Main disease SRID 911.1±291.34 708.5±221.26 202.6±280.62 2.04 (.080)
CND 1,031.8±432.73 1,088.6±475.00 -56.7±532.33 -0.96 (.340)
Other diseases 941.6±359.53 949.9±382.72 -8.3±372.57 -0.24 (.814)
Outpatient day (day/year) Gender Male 109.0±109.45 111.0±121.27 -2.0±53.83 -0.31 (.757)
Female 106.0±79.56 100.5±87.30 5.5±76.14 0.83 (.407)
Age (year) <65 104.6±92.24 110.0±107.10 -5.4±68.06 -0.66 (.515)
≥65 108.3±90.50 101.2±97.01 7.1±69.50 1.18 (.240)
Medical type 1 109.0±92.47 106.6±102.36 2.4±70.22 0.47 (.638)
2 73.2±47.51 61.7±34.41 11.5±47.44 0.81 (.438)
Disability No 103.3±89.66 106.7±105.59 -3.3±61.64 -0.61 (.541)
Physical disability 116.0±86.37 99.5±70.86 16.5±82.30 1.30 (.201)
Brain lesions 92.6±78.80 63.6±55.24 29.0±57.37 1.83 (.093)
Etc 121.7±116.94 125.2±136.42 -3.4±86.83 -0.17 (.866)
Main disease SRID 84.3±100.95 24.5±19.19 59.8±106.90 1.58 (.157)
CND 92.8±73.71 97.2±89.67 -4.3±70.01 -0.56 (.577)
Other diseases 119.1±100.04 115.0±108.26 4.1±63.80 0.68 (.499)
Medication day (day/year) Gender Male 902.4±419.44 891.6±376.04 10.8±386.28 0.24 (.815)
Female 815.4±301.43 842.6±389.31 -27.1±422.48 -0.73 (.465)
Age (year) <65 842.2±368.47 882.7±397.03 -40.5±45.68 -0.89 (-.378)
≥65 847.7±339.80 848.2±378.99 -0.4±427.15 -0.01 (.991)
Medical type 1 850.4±356.57 869.8±389.31 -19.4±417.60 -0.64 (.524)
2 768.9±152.11 687.5±240.28 81.3±222.48 1.21 (.253)
Disability No 835.1±339.03 872.2±373.38 -37.1±351.72 -1.18 (.239)
Physical disability 880.5±328.26 860.4±425.47 20.0±471.40 0.28 (.784)
Brain lesions 895.5±391.82 595.8±363.74 299.6±356.12 3.03 (.010)
Etc 807.1±437.78 956.4±322.98 -149.3±555.10 -1.17 (.256)
Main disease SRID 784.8±327.22 552.2±319.77 232.6±331.14 1.99 (.087)
CND 897.8±394.47 945.6±440.94 -47.8±484.34 -0.89 (.377)
Other diseases 812.4±310.91 819.2±324.89 -6.8±347.28 -0.21 (.836)
Inpatient day (day/year) Gender Male 37.5±93.71 44.7±96.27 -7.2±43.22 -1.39 (.168)
Female 16.4±39.90 32.8±85.30 -16.3±76.42 -2.44 (.016)
Age (year) <65 36.3±87.61 46.3±100.55 -10.0±64.74 -1.27 (.209)
≥65 17.5±48.40 32.3±82.96 -14.7±67.89 -2.50 (.014)
Medical type 1 24.3±65.86 38.4±91.37 -14.0±68.45 -2.83 (.005)
2 15.4±38.77 12.6±28.02 2.8±15.05 0.62 (.549)
Disability No 17.1±56.64 33.1±83.90 -16.0±71.48 -2.52 (.013)
Physical disability 29.6±60.54 27.8±63.18 1.8±51.66 0.23 (.819)
Brain lesions 62.7±103.36 111.0±167.61 -48.2±89.84 -1.94 (.077)
Etc 28.9±83.20 32.1±83.95 -3.2±26.54 -0.53 (.605)
Main disease SRID 81.0±131.55 131.7±178.60 -50.7±97.18 -1.47 (.183)
CND 37.3±86.75 57.8±115.55 -20.4±89.88 -2.05 (.043)
Other diseases 9.8±20.36 14.9±34.66 -5.1±37.03 -1.45 (.149)
The number of utilizing hospital (a place/year) Gender Male 17.5±11.18 16.3±12.26 1.1±10.17 0.96 (.339)
Female 17.6±10.41 15.0±9.80 2.6±9.95 3.00 (.003)
Age (year) <65 18.2±11.97 16.8±11.74 1.4±10.39 1.11 (.273)
≥65 17.2±9.95 14.8±10.13 2.4±9.86 2.88 (.005)
Medical type 1 17.7±10.76 15.6±10.92 2.0±10.15 2.79 (.006)
2 15.1±8.54 12.1±5.07 3.0±7.89 1.26 (.236)
Disability No 17.4±10.23 15.7±10.37 1.6±9.93 1.89 (.061)
Physical disability 18.5±9.34 14.9±7.86 3.5±8.65 2.64 (.012)
Brain lesions 18.0±15.37 11.5±9.85 6.4±10.02 2.33 (.038)
Etc 16.7±12.98 17.8±17.24 -1.1±12.58 -0.38 (.706)
Main disease SRID 9.8±5.74 8.8±7.79 1.0±2.72 1.04 (.334)
CND 17.4±10.22 16.4±10.89 1.0±10.65 0.90 (.373)
Other diseases 18.2±11.06 15.3±10.66 2.9±9.86 3.16 (.002)
Medical expense (1,000 won) Gender Male 7,534±6,909 8,831±7,237 -1,297±5,118 -2.12 (.038)
Female 5,994±4,518 7,215±6,599 -1,220±6,392 -2.18 (.031)
Age (year) <65 6,972±6,045 8,070±6,891 -1,097±5,497 -1.64 (.107)
≥65 6,312±5,225 7,635±6,858 -1,323±6,205 -2.46 (.015)
Medical type 1 6,633±5,610 7,998±6,964 -1,364±6,097 -3.08 (.002)
2 4,816±2,902 4,056±2,651 760±2,053 1.23 (.247)
Disability No 5,602±4,682 7,199±6,421 -1,596±5,752 -3.12 (.002)
Physical disability 7,448±4,888 7,522±5,635 -74±6,620 -0.07 (.943)
Brain lesions 1,140±8,077 1,317±1,196 -177±6,960 -0.92 (.378)
Etc 7,350±7,699 8,523±6,421 -1,173±5,207 -0.98 (.339)
Main disease SRID 9,673±8,746 12,433±1,324 -2,810±8,675 -0.92 (.390)
CND 8,155±6,956 9,523±7,652 -1,368±7,124 -1.73 (.088)
Other diseases 5,123±3,184 6,170±4,980 -1,047±4,735 -2.33 (.022)

SRID=severe/rare incurable diseases; CND=Chronic notified diseases; One year before the introdution of designated doctor system; One year after the introdution of designated doctor system.

Table 4

A Change in Trend of Health Care Utilisation before and after the Introduction of Designated Doctor System based on the Characteristics of Health Care Facilities
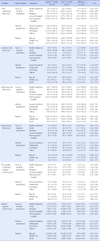
jkachn-26-278-i004
Variables Characteristics Categories Before (n=200) After (n=200) Difference t (p)
M±SD M±SD M±SD
Total benefit day (day/year) Type of medical institutions Health institution 726.2±426.16 724.2±69.86 2.0±420.92 0.01 (.993)
Clinic 972.2±373.14 1,005.2±394.31 -33.7±400.26 -0.84 (.406)
Hospital 911.6±370.67 913.2±373.20 -1.5±505.30 -0.02 (.984)
General hospital 1,032.6±451.44 1,077.9±554.52 -45.3±500.14 -0.58 (.565)
Senior general hospital 1,133.5±317.13 1,018.2±386.18 115.2±404.60 0.99 (.345)
Medical department Internal medicine 946.2±363.07 953.6±412.63 -7.3±445.99 -0.15 (.878)
Orthopedic 930.4±341.32 993.9±367.31 -63.4±435.07 -0.98 (.333)
Neurology 1,171.6±498.72 1,127.4±634.92 44.2±545.01 0.40 (.695)
Others 978.9±401.72 1,012.3±362.89 -33.3±389.94 -0.57 (.573)
Region Big city 1,338.9±582.63 1,219.9±568.38 119.0±526.29 0.75 (.471)
Middle city 939.1±364.03 967.0±413.82 -27.9±434.11 -0.81 (.421)
Rural 1,037.9±375.00 1,063.8±414.30 -25.9±462.10 -0.32 (.753)
Outpatient day (day/year) Type of medical institutions Health institution 80.0±73.38 84.2±27.48 -4.2±68.88 -0.12 (.910)
Clinic 125.8±108.06 128.4±116.40 -2.5±71.27 -0.36 (.717)
Hospital 93.6±71.56 72.3±56.37 21.2±71.71 1.90 (.065)
General hospital 81.8±57.28 89.5±92.72 -7.7±67.39 -0.74 (.467)
Senior general hospital 89.2±56.87 63.7±51.96 25.5±26.84 3.29 (.007)
Medical department Internal medicine 95.2±74.37 84.9±73.04 10.2±67.10 1.43 (.157)
Orthopedic 132.5±106.97 141.2±116.78 -8.7±80.33 -0.73 (.471)
Neurology 107.0±77.31 109.4±112.88 -2.4±74.86 -0.16 (.876)
Others 104.6±106.23 101.4±113.71 3.1±56.82 0.37 (.714)
Region Big city 82.0±73.67 80.9±62.22 1.0±40.73 0.09 (.931)
Middle city 101.3±84.13 94.7±93.61 6.5±71.02 1.16 (.248)
Rural 144.2±117.58 158.6±124.69 -14.4±66.04 -1.24 (.226)
Medication day (day/year) Type of medical institutions Health institution 631.7±393.68 591.5±93.02 40.2±383.83 0.21 (.847)
Clinic 830.8±312.07 862.2±325.26 -31.4±347.14 -0.91 (.363)
Hospital 770.5±343.35 758.8±387.24 11.7±500.55 0.15 (.881)
General hospital 930.4±421.09 970.3±488.63 -39.9±456.55 -0.56 (.578)
Senior general hospital 1,014.5±304.65 895.5±419.26 119.0±437.31 0.94 (.366)
Medical department Internal medicine 831.8±325.92 845.7±367.95 -13.8±408.38 -0.32 (.752)
Orthopedic 779.0±295.22 825.9±312.32 -46.8±387.31 -0.81 (.421)
Neurology 1,027.4±477.28 936.8±642.33 90.5±542.71 0.82 (.422)
Others 843.0±340.47 880.0±295.81 -37.0±352.20 -0.70 (.489)
Region Big city 1,195.5±545.47 1,070.5±553.07 125.0±507.43 0.82 (.433)
Middle city 813.5±323.17 833.8±378.08 -20.2±402.90 -0.63 (.529)
Rural 884.5±330.12 914.6±329.61 -30.0±411.93 -0.41 (.683)
Inpatient day (day/year) Type of medical institutions Health institution 14.5±28.33 48.5±74.40 -34.0±82.51 -0.82 (.470)
Clinic 12.5±39.44 24.3±67.72 -11.7±61.81 -1.92 (.058)
Hospital 54.6±111.65 80.1±136.58 -25.4±92.78 -1.76 (.086)
General hospital 20.3±38.28 18.0±37.95 2.3±31.45 0.48 (.633)
Senior general hospital 29.7±74.84 59.0±130.50 -29.2±82.37 -1.23 (.244)
Medical department Internal medicine 21.1±54.94 33.3±77.20 -12.1±62.12 -1.83 (.071)
Orthopedic 14.7±36.02 26.8±67.25 -12.0±71.31 -1.13 (.264)
Neurology 37.1±80.18 81.1±144.12 -43.9±97.16 -2.22 (.037)
Others 31.2±90.96 30.8±89.03 0.4±43.72 0.07 (.943)
Region Big city 61.3±123.37 68.4±139.52 -7.0±34.42 -0.68 (.510)
Middle city 24.4±64.49 37.9±92.12 -13.4±72.50 -2.33 (.021)
Rural 8.1±14.94 21.8±39.23 -13.6±41.65 -1.86 (.073)
The number of utilizing hospital (a place/year) Type of medical institutions Health institution 12.7±7.67 9.0±4.08 3.7±7.04 1.07 (.365)
Clinic 18.6±11.24 17.0±11.57 1.5±10.57 1.52 (.132)
Hospital 16.4±11.39 14.1±10.85 2.3±10.75 1.39 (.171)
General hospital 16.7±8.81 14.4±9.10 2.2±9.09 1.58 (.122)
Senior general hospital 17.5±9.87 12.7±7.39 4.7±6.83 2.41 (.035)
Medical department Internal medicine 17.4±10.82 15.8±10.70 1.5±9.46 1.58 (.119)
Orthopedic 19.7±11.22 16.3±12.03 3.4±10.78 2.13 (.039)
Neurology 15.8±9.13 12.9±9.53 2.9±8.52 1.68 (.107)
Others 16.7±10.50 15.4±10.03 1.3±11.18 0.80 (.431)
Region Big city 15.1±9.33 16.2±11.05 -1.0±8.27 -0.44 (.971)
Middle city 17.5±10.64 15.0±10.81 2.5±10.37 3.02 (.003)
Rural 18.8±11.24 17.5±10.16 1.2±8.74 0.83 (.414)
Medical expense (1,000 won) Type of medical institutions Health institution 4,217±2,954 7,643±8,973 -3,425±9,016 -0.76 (.503)
Clinic 5,437±3,704 6,897±5,613 -1,460±5,650 -2.61 (.010)
Hospital 7,991±7,741 10,489±8,765 -2,497±6,864 -2.33 (.025)
General hospital 6,841±4,636 6,433±4,267 408±4,676 0.56 (.580)
Senior general hospital 10,590±9,216 10,686±11,944 -95±7,603 -0.04 (.966)
Medical department Internal medicine 5,993±4,441 6,965±5,734 -972±6,182 -1.47 (.146)
Orthopedic 5,695±4,198 7,941±6,440 -2,246±6,028 -2.50 (.016)
Neurology 10,076±7,882 12,815±9,986 -2,739±6,929 -1.94 (.065)
Others 6,526±6,427 6,483±6,218 42±4,603 0.06 (.951)
Region Big city 11,063±9,958 11,625±10,724 -562±3,039 -0.61 (.553)
Middle city 6,328±5,284 7,388±6,673 -1,060±5,971 -2.23 (.028)
Rural 5,981±3,792 8,384±5,832 -2,402±6,650 -2.04 (.050)

One year before the introdution of designated doctor system; One year after the introdution of designated doctor system.

Table 5

Factors related to Change of Total Beneficial Day and Outpatient Day

jkachn-26-278-i005
Dependent variable Independent variables B SE β t p
Total benefit day Gender (Male=1) 18.01 67.65 .01 0.27 .790
Age 0.37 2.81 .01 0.13 .897
Disability (Existence=1) 102.31 66.09 .11 1.55 .123
Mian disease (Chronic disease=1) -76.12 65.87 -.08 -1.16 .249
Type of medical institutions (Health institution/Clinic=1) -130.06 139.61 -.06 -0.93 .353
Medical department (Internal medicine=1) 38.44 65.56 .04 0.59 .558
Outpatient day Gender (Male=1) -10.01 10.43 -.06 -0.96 .339
Age 0.22 0.43 .03 0.50 .621
Disability (Existence=1) 20.81 10.19 .14 2.04 .043
Mian disease (Chronic disease=1) -17.67 10.16 -.12 -1.74 .084
Type of medical institutions (Health institution/Clinic=1) -9.77 21.53 -.03 -0.45 .651
Medical department (Internal medicine=1) 17.72 10.11 .12 1.75 .081
Total benefit day F=0.77, p=.597, R2=.023, Modified R2=.007
Outpatient day F=1.55, p=.163, R2=.046, Modified R2=.016

Notes

This article is a revision of the first author's master's thesis from Inje University.

References

1. Ministry of Health & Welfare. 2014 guideline of medicaid management. Sejong: Ministry of Health & Welfare;2014. p. 510.
2. Shin HU, Shin YS, Hwang DK, Yoo YS, Choi GC, Lim SJ. Report No.: 2008-18-5. Monitoring the designated doctor system. Research Report. Seoul: Korea Institute for Health and Social Affairs;2008. 12.
3. Ministry of Health & Welfare. From July implementation of type 1 medicaid beneficiaries copayments and designated doctor system, operation of medical aid qualification management system [Internet]. Gwacheon: Ministry of Health & Welfare;2007. cited 2015 August 16. Available from: http://www.mohw.go.kr/user.tdf?a=user.tbdata.BoardApp&c=2002&board_id=gp_tb_data&seq=41480&cp=2&pg=1&npp=10&mc=P_04_01&skin=p_new_m4_common&.
4. Ministry of Health & Welfare. Findings of research paper on "actual status of health care utilization by medical aid beneficiaries" [Internet]. Gwacheon: Ministry of Health & Welfare;2007. cited 2014 August 22. Available from: http://www.mohw.go.kr/user.tdf?a=user.tbdata.BoardApp&c=2002&board_id=gp_tb_data&seq=41707&cp=2&pg=1&npp=10&mc=P_04_01&skin=p_new_m4_common&silkuk.
5. Shin YS, Choi BH, Shin HU, Hwang DK, Eun SJ. Report No.: 2005-30. The research regarding the healthcare expenditure and medical treatment material service use actual condition and a improvement program. Policy Report. Seoul: Ministry of Health & Welfare. Korean Institute for Health and Social Affairs;2005.
6. Gwon GS. Report No.: MONO1201508314. Development of platforms for therapeutic technologies to control age-related chronic disessest. Research Report. Daejeon: Korea Research Institute of Bioscience & Biotechnology;2014.
7. Jung YH, Ko SJ, Kim EJ. Report No.: 2013-31-19. A study on the effective chronic disease management. Research Report. Seoul: Korea Institute for Health and Social Affairs;2013.
8. Lee JH. Introduction of familiy doctor system [Internet]. Seoul: Health Right Network;2009. cited 2014 August 22. Available from: http://www.konkang21.or.kr/bbs/board.php?bo_table=pds1&wr_id=965.
9. Lee JH, Choi YJ, Choi JS, Kim SR. Patient assessment of primary care under the designated practice scheme for medical aid beneficiaries, using the Korean Primary Care Assessment Tool (K-PCAT): A district of Seoul, South Korea. J Korean Med Assoc. 2012; 55(2):187–197. DOI: 10.5124/jkma.2012.55.2.187.
crossref
10. Lee JW, Yang SI, Kim KH. A study on influential factors on satisfaction with the use of medical services by the qualified recipients of medical aid (focusing on the period after the introduction of the selected medical center system). J Digit Convergence. 2014; 12(3):289–297. DOI: 10.14400/JDC.2014.12.3.289.
11. Lim SJ. The effect of case management for medicaid on healthcare utilization by the medicaid system. J Korean Acad Community Health Nurs. 2010; 21(4):375–385. DOI: 10.12799/jkachn.2010.21.4.375.
12. No SS. Medicaid recipients in accordance with the selection of medical aid agency change in health care utilization [master's thesis]. [Gwangju]: Chonnam National University;2013. 37.
13. Ministry of Health & Welfare. National Health Insurance Corporation. Medical care statistics. Seoul: National Health Insurance Corporation;2012. p. 723.
14. Hong SO. The effects of copayments on healthcare utilization in the type I medicaid beneficiaries [dissertation]. [Seoul]: Seoul National University;2009. 103.
15. Kim YO. Impact of implementing outpatient cost-sharing system to medical type 1 recipient on the health utilization and expenditure [master's thesis]. [Seoul]: Yonsei University;2008. 66.
16. Choi J, Oh JJ. The effects of designated doctor system on the health of medical aid beneficiaries. J Korean Acad Community Health Nurs. 2012; 23(4):438–445. DOI: 10.12799/jkachn.2012.23.4.438.
17. Shin YS. Direction to go for medical aid. Health Welf Policy Forum. 2010; 167:28–38.
18. Hong SW. Factors influencing health-related quality of life in Korean medicaid beneficiaries. J Korean Acad Nurs. 2009; 39(4):480–489. DOI: 10.4040/jkan.2009.39.4.480.
crossref
19. National Health Insurance Corporation. The first half of 2014 health insurance key statistics [Internet]. Seoul: National Health Insurance Corporation;2014. cited 2015August 16. Available from: http://www.nhis.or.kr/bbs7/boards/B0039/3156.
20. Korea Human Resource Development Institute for Health & Welfare. Quarternary period medical aid management experienced job training course. 1st ed. Cheongwon: Korea Human Resource Development Institute for Health & Welfare;2013. p. 129.
TOOLS
Similar articles