

 PDF
PDF ePub
ePub Citation
 Print
Print


Introduction
Caffeine is a naturally occurring mild central nervous system stimulant that is found in plant constituents such as coffee, cocoa beans, and tea leaves. Caffeine has a long history of human consumption, and is currently used worldwide for enhancing wakefulness, relieving fatigue, and improving mental concentration. Generally, consumption of 400 mg of caffeine per day is safe for healthy adults, which is approximately the amount of caffeine in four cups of brewed coffee, 10 cans of cola, or two caffeinated drinks.[1] Although typical caffeine use is safe for healthy adults, its effects can be significantly different in caffeine-sensitive groups such as low-weight people including children and adolescents, and the consumption of caffeinated drinks is rapidly growing in these groups.[2] Consequently, caffeine-related toxicities are growing in number as well[3]; effects of caffeine intoxication include hallucinations, seizures, metabolic acidosis, rhabdomyolysis, and arrhythmias.[4] and several reports have associated caffeinated-drink ingestion with serious caffeine intoxication.[56] In most of cases of emergency room visits related to caffeine intoxication, the patients present with tachyarrhythmia and involves consumption of extremely high doses of caffeine (> 3 mg/kg).[3] Recently, a series of investigations of high caffeine exposure in adolescents revealed behavioral consequences including sleep-pattern change.[78]
To better explain the relationship between caffeine and its toxicities, a population-pharmacokinetic model was previously established, and Monte Carlo simulations successfully predicted maximal plasma caffeine-concentration profiles after ingestion of a single caffeinated drink.[91011] It enables researchers to explore the permissible dose range of caffeine, especially for those who are vulnerable to caffeine overdose. However, a quantitative and interactive tool for predicting and simulating plasma caffeine concentration leading to caffeine intoxication has yet to be developed.
Using the previously established population-pharmacokinetic model and its parameters.[11] we developed “caffsim” R package and its web-based applications using Shiny and EDISON (EDucation-research Integration through Simulation On the Net, https://www.edison.re.kr/). The primary aim of the software is allowing for easy prediction of plasma caffeine concentration and visualizing its changes after single or multiple ingestions of caffeine.
Methods
Pharmacokinetic model of caffeine
A population-pharmacokinetic analysis was previously established based on a study of 30 healthy adult male volunteers of South Asian and European ancestry.[910] and Lee et al.[11] further investigated the model using Monte Carlo simulations to predict Cmax and AUC of caffeine in children.One-compartment model with first-order absorption kinetics and first-order elimination kinetics was shown to be well-fitted to the pharmacokinetic data, and the final pharmacokinetic parameters were adopted from the previous study[11] for development of the package.
Caffsim R package
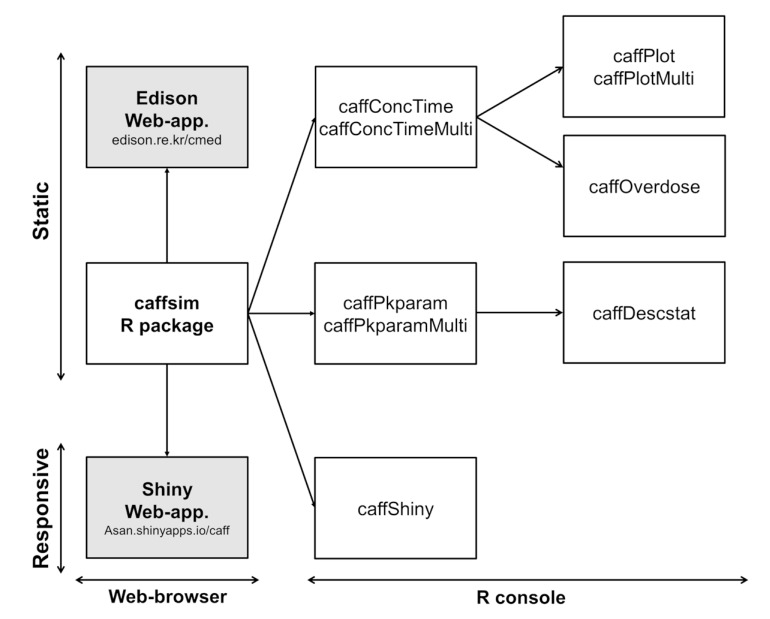
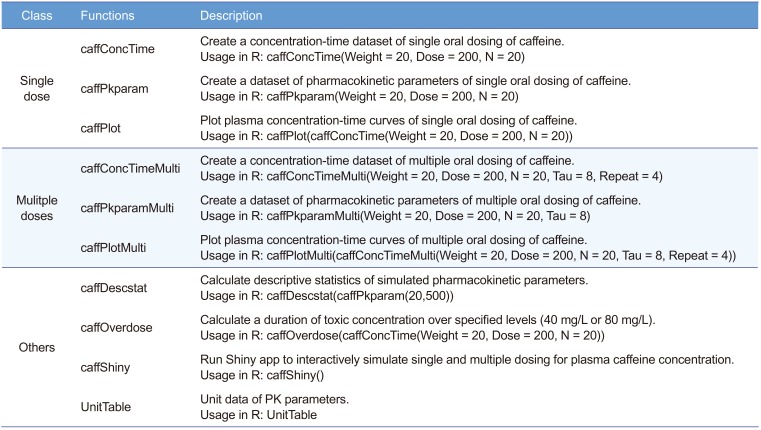
Caffsim was developed in the open-source R programming language in order to allow contribution from anyone interested in the study (https://github.com/asancpt/caffsim). It is freely available for download on the CRAN repository (https://CRAN.R-project.org/package=caffsim), and the installation can be carried out by typing  in the R console. The package utilizes data manipulation or visualization packages such as dplyr, tidyr, ggplot2[12] and Shiny. Contents of the caffsim R package can be broadly categorized into three main functions—single dosing simulations, multiple dosing simulations, and the other functions including descriptive statistics of pharmacokinetic parameters and a duration of toxic concentration, and execution of Shiny application (Table 1). Detailed documentation and examples for each function can be found on the online user manual on the CRAN repository, a package website (https://asancpt.github.io/caffsim) or directly within the R console by entering ?function (
 and
and  ) after the installation.
in the R console. The package utilizes data manipulation or visualization packages such as dplyr, tidyr, ggplot2[12] and Shiny. Contents of the caffsim R package can be broadly categorized into three main functions—single dosing simulations, multiple dosing simulations, and the other functions including descriptive statistics of pharmacokinetic parameters and a duration of toxic concentration, and execution of Shiny application (Table 1). Detailed documentation and examples for each function can be found on the online user manual on the CRAN repository, a package website (https://asancpt.github.io/caffsim) or directly within the R console by entering ?function ( and ) after the installation.Results
Usage of caffsim R package
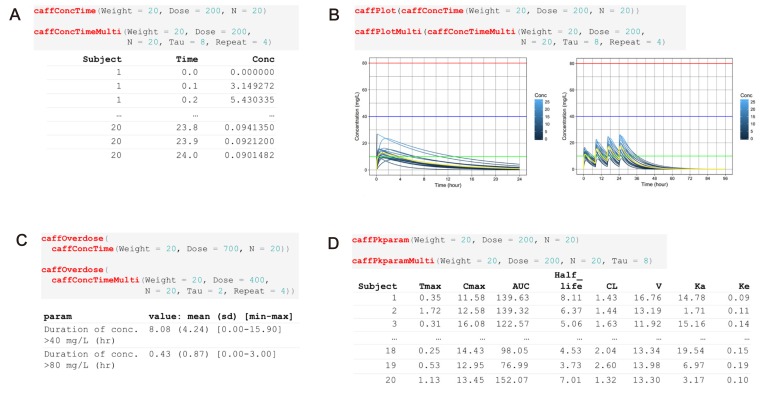
Workflow of the caffsim R package and examples of its main functions are shown in Fig. 1 and 2 The process starts with generation of the concentration-time data by  for single dosing simulations and
  for multiple dosing simulations (Fig. 2A). The generated data frame can be then used as an input argument of
  function or
  function, which generates concentration-time plots (Fig. 2B) The properties (log-y scale, line colors, shape of points, etc.) of the plots can be further manipulated or overwritten by adding ‘+’ pipe and functions of ggplot2. The data generated by functions and can be passed to
  , which calculates the duration of concentration over certain levels that may lead to fatal toxicities, while showing the proportion (%) of population which exceeds such levels (Fig. 2C, Supplementary Table 1).
for single dosing simulations and for multiple dosing simulations (Fig. 2A). The generated data frame can be then used as an input argument of function or function, which generates concentration-time plots (Fig. 2B) The properties (log-y scale, line colors, shape of points, etc.) of the plots can be further manipulated or overwritten by adding ‘+’ pipe and functions of ggplot2. The data generated by functions and can be passed to , which calculates the duration of concentration over certain levels that may lead to fatal toxicities, while showing the proportion (%) of population which exceeds such levels (Fig. 2C, Supplementary Table 1).Application of caffsim R package to investigate pharmacokinetics of multiple oral dosing
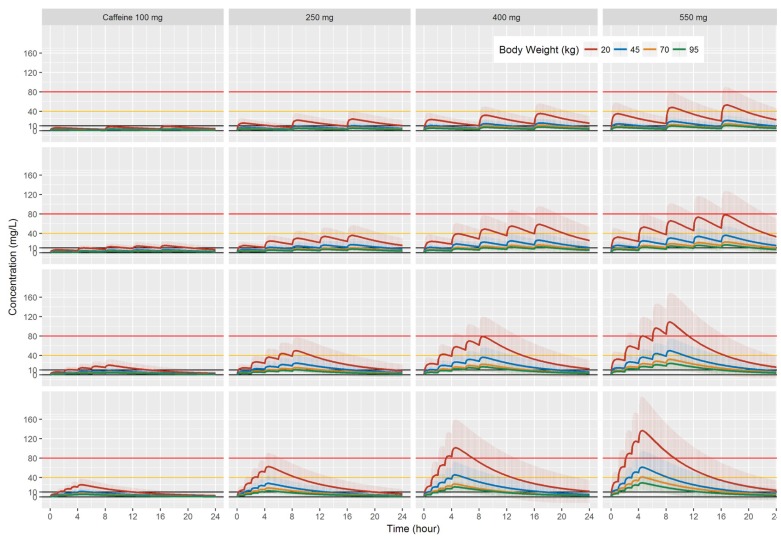
The concentration-time profiles of caffeine following 5-times multiple oral doses of 100, 250, 400, and 550 mg (n = 200 each) in combination with dosing intervals 8 hr, 4 hr, 2 hr, and 1 hr with respect to body weights are shown in Fig. 3 The known covariate, body weights.[11] were shown to affect the clearance of caffeine, volume of distribution and ka (absorption rate constant); low-weighted population was found to have significantly high AUC, but subjects with body weights > 70 kg generally maintained low Cav,ss (average concentration at steady-state) levels (< 10 mg/L). We also observed that multiple larger doses of caffeine (> 400 mg) increased its steady-state concentration, which was generally maintained above 10 mg/L, a level considered safe for the multiple dosing of less than 250 mg.
Application of caffsim R package for developing web-based applications
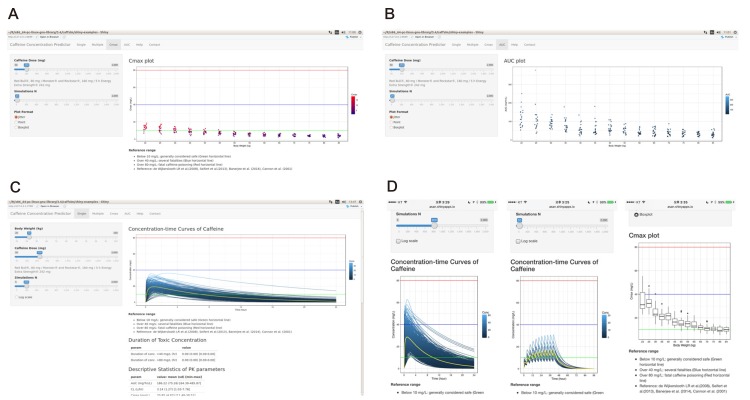
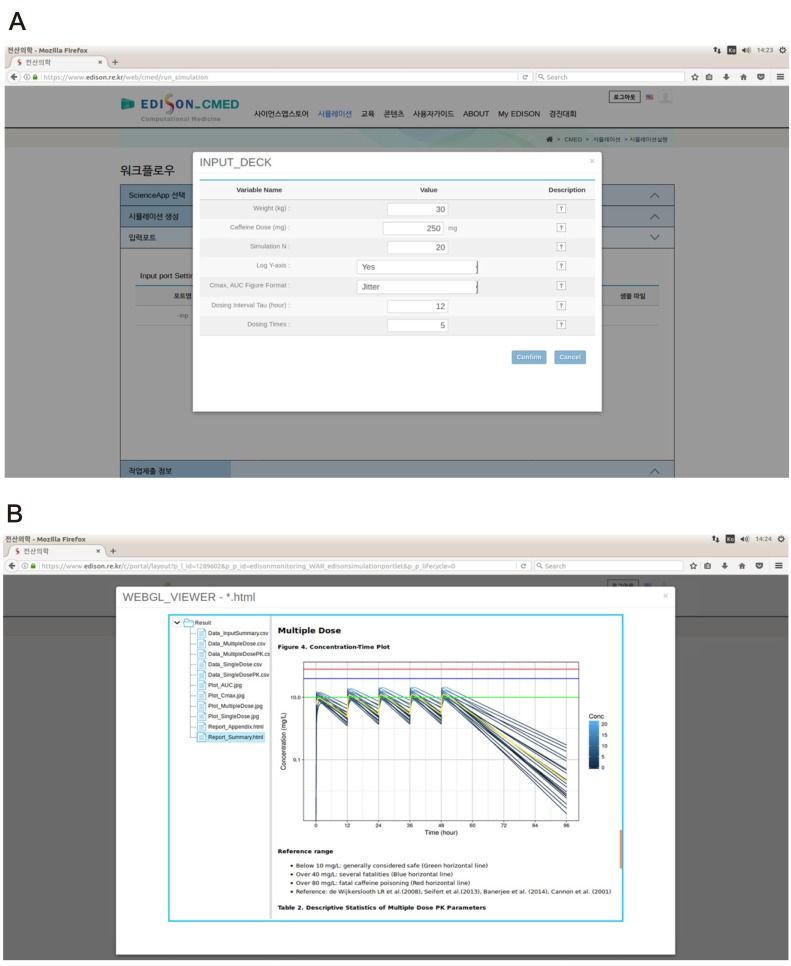
The Caffeine Concentration Predictor Shiny web-application is freely available online (https://asan.shinyapps.io/caff) for a responsive simulation of the data; it can also be obtained by typing  in the R console as shown in Fig. 4 The web-application is fully supported in mobile web-browsers (Fig. 4D) as well as desktop web-browsers (Fig. 4A-C). The source R script of the Shiny web-application is open to the public (https://github.com/asancpt/shiny-caff). For education purposes, the EDISON Science App, CaffeineEdison (https://www.edison.re.kr/web/cmed/run_simulation) was generated based on the caffsim R package. Although EDISON Science App does not support responsive web designs and mobile web browsers, registered students can easily perform a simulation in desktop computers, and each simulation can be recorded and reviewed later (Fig. 5). The source R script of the EDISON Science App is also open to the public (https://github.com/asancpt/edison-caff).
in the R console as shown in Fig. 4 The web-application is fully supported in mobile web-browsers (Fig. 4D) as well as desktop web-browsers (Fig. 4A-C). The source R script of the Shiny web-application is open to the public (https://github.com/asancpt/shiny-caff). For education purposes, the EDISON Science App, CaffeineEdison (https://www.edison.re.kr/web/cmed/run_simulation) was generated based on the caffsim R package. Although EDISON Science App does not support responsive web designs and mobile web browsers, registered students can easily perform a simulation in desktop computers, and each simulation can be recorded and reviewed later (Fig. 5). The source R script of the EDISON Science App is also open to the public (https://github.com/asancpt/edison-caff).Discussion
We developed an R package: caffsim as a comprehensive tool for simulating plasma caffeine concentration. It is mainly targeted for researchers who study caffeine or other stimulants, and particularly those who have only basic knowledge of R, visualization, or web-based applications. We aimed to implement the following functionalities to perform a simulation: 1) An easy and straightforward generation of concentration-time data; 2) visualization of changes of concentration in single and multiple dosing; 3) a cross-platform software that can be operated in both desktop and mobile web browsers as well as in the R console; 4) an open-source software on which discussion and suggestions from users can be freely exchanged. Based on our results, we believe that the caffsim R package meets the objectives described above.
Predicting the exact plasma caffeine concentration at a given time is critical for assessing the effect of caffeine exposure to certain sensitive groups including children, adolescents, and low-weight adults. Although the data on plasma caffeine concentrations are mainly derived from reports of severe caffeine toxicities, these observations are decidedly relevant to clinical prediction. A quantitative relationship among plasma caffeine concentrations, pharmacokinetics, and toxicities is yet to be clearly concluded, but well-documented case reports studying caffeine concentration have indicated the following:
Plasma caffeine concentrations < 10 mg/L are generally safe, but caffeine concentrations of > 15 mg/L may exert toxicity.[5]
Fatalities from caffeine intoxication have been reported with plasma caffeine concentrations of < 40 mg/L.[513]
Fatal caffeine poisoning cases are usually reported when the concentration is > 80 mg/L.[14151617]
The physiological and pathological effects of caffeine ingestion in individuals can be more properly interpreted once the information on toxic caffeine concentration levels from case reports are aptly combined with the concentration-time data simulation obtained through the caffsim R package.
The caffsim R package also broadens the perspective on accessibility by creating and utilizing diverse web-based open-science applications such as Shiny app and EDISON Science App. We expect that the EDISON Science App based on the caffsim R package will have significant impact on relevant education, and further stimulate the development of open-science applications. This approach makes innovative and state-of-the-art technologies more accessible to both students and the public; also, physicians in training may benefit from it for understanding the pharmacokinetics following one compartment model, and for recognizing caffeine intoxication or caffeine-related syndromes.
In conclusion, we report that our newly-developed caffsim R package and its web-applications enable researchers and clinicians to perform fast, easy-to-use, and versatile simulations of caffeine dosing in various settings (in R console or in desktop and mobile web-browsers). This software will expand our knowledge of the relationship between the plasma caffeine concentration and caffeine intoxication in caffeine-sensitive groups. The caffsim R package may help people understand how plasma caffeine concentration changes over time and how long toxic caffeine concentration can last in the plasma of caffeine-sensitive groups. It may also help clinical evaluation of the relationship between caffeine intake and toxicities when suspicious acute symptoms occur.


 XML Download