

 PDF
PDF ePub
ePub Citation
 Print
Print


INTRODUCTION
Alzheimer's disease (AD) is the most common cause of dementia. In the current clinical setting, AD is diagnosed by clinical criteria proposed by McKann et al.1 Development of disease modifying drugs requires accurate diagnostic tools. The crerbrospinal fluid (CSF) amyloid beta (Aβ1-42), total tau (t-tau), and phosphorylated tau (p-tau181) are promising diagnostic biomarkers.2 They are correlated with the pathogenesis of AD. CSF biomarkers are not only an important diagnostic tool for AD, but also an important prognostic indicator of the disease decades before its onset.23
Because the concentrations of CSF biomarkers are continuous values, arbitrary cut-off values should be determined for easy diagnosis. For example, AlzBio3 immunoassay kit (Innogenetics, Ghent, Belgium) is one of the most popular kits for CSF protein assay.4 The cut-off points include: Aβ1-42<192 pg/mL, t-tau>93 pg/mL, p-tau181>23 pg/mL, t-tau/Aβ1-42>0.39, or p-tau181/Aβ1-42>0.1 for the diagnosis for AD.2 Although the cut-off points were determined after considering the diagnostic accuracy, the values of patients and controls are centered around the cut-off points. In addition, the CSF biomarkers of controls who represent a high-risk group show an AD signature pattern. Therefore, we need to determine other ways to define the cut-off values for the CSF biomarkers.
The results of CSF biomarkers in AD are homogenous compared with those of the controls.5 In this study, we determined the factors associated with CSF biomarkers in AD. We then defined new cut-off values using appropriate models based on those factors.
METHODS
Participants6
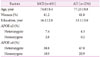
We included subjects who had data involving CSF Aβ1-42, t-tau, or p-tau181 in the Alzheimer's Disease Neuroimaging Initiative (ADNI) database. The participants included 631 patients with amnestic mild cognitive impairment (aMCI) and 234 patients with AD whose diagnoses were determined at baseline. Among patients with AD, a patient who reverted to aMCI during a follow-up visit was excluded. The participants' ages ranged between 55 and 90 years (inclusive), good overall health to be included in the study. Other inclusion criteria were: treatment with medications stably for 4 weeks, appropriate visual and auditory acuity for neuropsychological testing, and scores on modified Hachinski scales ≤4 and geriatric depression scales <6.78 The patients with aMCI met the criteria proposed by Petersen et al.9 They had abnormal memory function which was tested by delayed paragraph recall of logical memory II. In addition, their Mini-Mental State Examination (MMSE) scores were 24–30 with a memory Clinical Dementia Rating (CDR) score of at least 0.5. Patients with AD met the ‘probable’ criteria of the National Institute of Neurological and Communicative Disorders and Stroke and the Alzheimer's Disease and Related Disorders Association.1 The ADNI includes patients with early stages of AD and MMSE scores of 20–26 and a sum-of-box CDR of 1–9 at their baseline visits. The exclusion criteria were: absence of other neurologic diseases such as Parkinson's disease, multi-infarct dementia, brain tumor, Huntington's disease, normal pressure hydrocephalus, brain tumor, progressive supranuclear palsy, seizure disorder, subdural hematoma, multiple sclerosis, or history of significant head trauma followed by persistent neurologic defaults or known structural brain abnormalities. Participants did not have major depression or bipolar disorder within the past 1 year, or alcohol/drug abuse within the past two years. They had no history of schizophrenia. Subjects who were contraindicated for MRI due to the presence of aneurysmal clips or pacemakers were excluded. We downloaded ADNI data on June 2014. The characteristics of people with normal cognition, aMCI and patients with AD including age, sex, years of education, APOE ε2 status, and APOE ε4 status are summarized in Table 1.
Baseline assessment and longitudinal assessment10
All subjects underwent neurological examination, physical examination, and neuropsychological assessments at baseline. Furthermore, CSF and blood samples were drawn, and MRI and FDG-PET scans were obtained. The protocols for cognitive testing, CSF, MRI, and PET are described in detail at http://adni.loni.usc.edu/. The follow-up interval was 6–12 months. In the present study we used results from the baseline and longitudinal results of CSF Aβ1-42, t-tau, or p-tau181.
CSF biomarkers
The patients underwent lumbar puncture (LP) in the morning after overnight fast.211 LP was carried out after MRI and before PET scan. If the test sequences of MRI and PET scan were reversed with LP, at least a three-day window was required between MRI and LPs, and at least a 12-hour window between PET scan and LPs. The patients repeated LPs annually. The “Run” means the test run which was assayed with the same kit and batch at the same time.
CSF Aβ1-42, t-tau, or p-tau181 were assessed using the multiplex xMAP Luminex platform (Luminex Corp., Austin, TX, USA) and Innogenetics/Fujirebio AlzBio3 immunoassay kits (Innogenetics).4
Statistical analysis
First, we developed mixed models with a random intercept and random slope, using age, sex, time from baseline, APOE ε2 alleles, and APOE ε4 alleles as fixed effects and run as a random effect. We used the compound symmetric as the covariate matrix. We also tested other covariate matrices, without any differences with the compound symmetric. The purpose of the first analysis was to identify the biological factors affecting the concentrations of CSF Aβ1-42, t-tau, or p-tau181 in AD. The allele number of APOE ε2 homozygote was regarded as 1, because APOE ε2 homozygotes were few. We arbitrarily selected the factors with p≤0.10 and used them in the final fitting models. In addition, we monitored the interactions among the significant factors. In the event of significant interactions among factors, we created fitting models by stratifications. We defined the upper 95% confidence interval curve for Aβ1-42, the lower curve for t-tau, or p-tau181 as new cut-off lines.
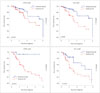
We compared MCI conversion to AD between old and new cut-off values using Cox proportional hazards model. The time variables included years from baseline visit to follow-up visit at the time of conversion.
The statistical analyses were conducted using PASW (version 21.0; IBM Corp., Armonk, NY, USA). Graphical presentations were performed using R (version 3.0.1).
RESULTS
Table 2 displays the selection of the factors affecting CSF biomarker concentrations of patients with AD, using the mixed models. We selected factors with p≤0.10 and determined the interaction between the factors. Based on significant interactions, we separated factors to create a fitting model. We selected APOE ε4 status (p<0.001) and age (p=0.10) as the factors significantly related with CSF Aβ1-42. For CSF t-tau, APOE ε2 status (p=0.009) and sex (p<0.001) were significant factors. Age (p=0.005) and time from diagnosis (p=0.004) were the significant factors for CSF p-tau181. We identified interactions between CSF Aβ1-42 related factors (APOE ε4 status and age, p=0.020) and between t-tau related factors (APOE ε2 status and sex, p=0.034).
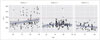
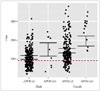
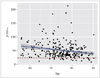
As shown in Fig. 1, the distribution of CSF Aβ1-42 according to the number of APOE ε4 varies with respect to age. In the absence of APOE ε4, a linear increase was observed in age. In APOE ε4 heterozygotes, a parabolic shape with apex at about 67 was observed. In APOE ε4 homozygotes, the CSF Aβ1-42 decreased linearly with respect to age. The CSF t-tau is related to gender by APOE ε2 (Fig. 2). The distribution of CSF p-tau181 decreased linearly with age at baseline visit (Fig. 3).
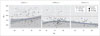
We assumed that the conversion to AD may be predicted accurately in patients with MCI using the new models. To test this hypothesis, the CSF results of MCI, based on age, sex, APOE ε2, and APOE ε4 were used to distinguish the normal/abnormal conditions as shown in Fig. 4. As shown in Fig. 5, in MCI without APOE ε4, our cut-off methods showed lower false positives in the predicted normal group and lower false negatives in the predicted AD group (Fig. 5). However, in MCI with APOE ε4 heterozygotes, our cut-off methods produced higher false negative rate in the predicted normal group. In APOE ε4 homozygotes, it played no role in predicting the conversion, because APOE ε4 homozygote itself was a significant predictor of disease.
DISCUSSION
In our study, we considered only patients with AD for the determination of the cut-off values for the CSF biomarkers. In addition, conversion from MCI to AD can be more accurately predicted by considering age, sex, APOE ε2, and APOE ε4 status. The new cut-off methods were particularly accurate for subjects without APOE ε4.
Our study provided insight into the role of CSF biomarkers by plotting their concentrations according to the related factors. The interaction between age and APOE ε4 affected the concentrations of CSF Aβ1-42, and therefore, age and the APOE ε4 status were analyzed separately (Fig. 1). In the APOE ε4 non-carriers, the concentration of CSF Aβ1-42 was correlated linearly with age, although it showed a negative quadratic curve according to age in the APOE ε4 heterozygotes. In the APOE ε4 homozygotes, it was reduced to a negative correlation depending on age. Interestingly, the t-tau levels varied between patients with and without APOE ε2 (Fig. 2). The levels of t-tau also differed according to sex. The CSF p-tau181 concentration was decreased according to age.
Our cut-off methods were accurate predictors of conversions particularly in MCI without APOE ε4 (Fig. 5). Introduction of preventive medicines may decrease the cost of our methods by decreasing falsely classified MCI with AD signatures. In addition, it increases the effectiveness of preventive medicines by decreasing the falsely classified MCI without AD signatures. However, our methods may decrease the specificity for MCI with APOE ε4.
Age was an important factor associated with CSF Aβ1-42 in AD without APOE ε4 and with p-tau181. The older patients with AD show mixed pathologies of subcortical vascular dementia, hippocampal sclerosis, argyrophilic grain disease, and suspected non-amyloid pathology.121314 The additional pathologies can cause dementia in patients with less severe amyloid or tau burden in their brain. However, further studies are required to elucidate the role of gender in CSF t-tau. In addition, the further studies are needed to account for the age-related changes in CSF Aβ1-42 found in the APOE ε4 heterozygotes, because of the lower number of patients in young (<70) and old (>80) groups compared with the 70–80 year age group.
We found two noble points. First, we found factors that affect CSF biomarkers in patients with AD. Recently, Li et al.15 and Lautner et al.16 reported that age, sex, and APOE ε4 are factors that affect CSF Aβ1-42 in subjects with normal cognition. These two studies overlooked that the CSF biomarkers in subjects with normal cognition showed average results for two completely different groups–high risk and low risk groups for AD. The proportion of high risk patients for AD increased with age in subjects with normal cognition. Second, we have redefined the cut-off methods of CSF biomarkers using factors that affect CSF biomarkers. In this study, we indicated that the current cut-off values for APOE ε4 noncarrier was less specific and resulted in several false negatives.
In conclusion, we established better cut-off values of CSF biomarkers, which were made only from patients with AD, and not from controls. In addition, age, sex, and APOE genotype play a key role in the interpretation of the cut-off values of CSF biomarkers.

 XML Download