

 PDF
PDF ePub
ePub Citation
 Print
Print


INTRODUCTION
White matter hyperintensities (WMHs) are commonly observed on magnetic resonance imaging (MRI) of the brain in the elderly subjects and have been considered associated with ischemic damages in the white matter. Age is the strongest predictor [1], and additional risk factors include hypertension, atherosclerosis, diabetes, smoking, hypercholesterolemia, and elevated homocysteine [2-4]. WMHs have been considered as a reliable biomarker of small vessel damages in cerebrovascular disease and Alzheimer's disease. However, a substantial proportion of the variation in the load and the progression of WMHs cannot be simply explained by conventional vascular risk factors. Apart from the effects of the factors that are yet unidentified [5], this might point to a significant genetic component [6-8]. WMHs have been noted to be associated with cognitive impairment, with a suggestion that a certain threshold of their extent must be reached before this becomes clinically apparent [9]. WMHs have also been linked to neuropsychiatric disorders such as major depression, bipolar disorder and schizophrenia [10, 11]. Although findings do converge in demonstrating that increased cerebrovascular disease burden is not beneficial and is most likely harmful, inconsistencies also exist in the literature up to now, regarding the exact relationship among the AD pathological characteristics, vascular abnormalities, and cognition.
Both qualitative and quantitative techniques have been used to measure WMHs. The qualitative approach used visual rating scales, which had the advantage of ease of use and insensitivity to artifacts that commonly limit quantitative method, making such approaches attractive to large epidemiological studies [12-18]. Unfortunately, qualitative scales have a number of limitations. For example, categorical ratings have a restricted range of values that limit the power to detect small volume changes. Moreover, qualitative scales are often subjective in their interpretation, limiting inter-rater and intrarater reliability. Reliability is particularly poor with longitudinal studies [15]. Furthermore, it was clear that some of the scales were limited by the ceiling effects. In the Leukoaraiosis and Disability study, it was also mentioned that visual rating scales have poor discrimination of absolute lesion volume [19]. Therefore, in researches on cognition and WMHs, using the visual rating scale techniques has enough inconsistency to be problematic. Volumetric lesion-detection methods largely overcome these shortcomings. Algorithm techniques replace the human eye, and 3D reconstruction and computation allow quantitative data on WMHs. Thus, volumetric WMHs measurements are more objective and reliable, in addition to providing exact measurements of WMH volume compared to that of the visual ratings [20]. There were some automated or semi-automated volumetric methods developed to measure WMHs. Although the automated volumetric measurements are time-saving and are better for large data, they have disadvantages to need the volume data such as Spoiled Gradient Recall (SPGR) or Magnetization Prepared RApid Gradient Echo (MPRAGE) other than Fluid Attenuated Inversion Recovery (FLAIR), and do not open for public uses.
To evaluate the severity of small vessel damages in cross sectional and longitudinal studies, it is vital to develop reliable methods to measure the severity or volume of WMHs. We applied open source software to measure WMH volume with FLAIR MRI, and investigated the reliability and validity of the semi-automated volumetric method, and compared them with the gold standard WMH volume and commonly used visual rating scale, Scheltens' visual scale [21].
MATERIALS AND METHODS
Subjects
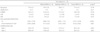
Twenty five subjects with dementia or cognitively impairment with variable WMHs were recruited from dementia clinic of Seoul St. Mary's Hospital, The Catholic University of Korea. Each subject was assessed by the Mini-Mental State Examination (MMSE), Clinical Dementia Rating (CDR) and the MRI used in the current analyses was obtained at the time of enrollment process of the subjects. To be included, subjects had to have: (a) age between 65 and 90, (b) WMHs on MRI of any degree, according to the categorization into the three severity classes of the Clinical REsearch for clinical Dementia Of South Korea (CREDOS) criteria [22], and (c) agreement to sign an informed consent. Exclusion criteria were: (a) the presence of severe illnesses (cardiac, hepatic, or renal failure, cancer or other relevant systemic diseases), (b) severe unrelated neurological diseases, (c) leukoencephalopathy of nonvascular origin (immunologic-demyelinating, metabolic, toxic, infectious, other), (d) severe psychiatric disorders, and (e) inability or refusal to undergo cerebral MRI. They were composed of 8 minimal, 9 moderate, and 8 severe WMHs, according to the CREDOS criteria. The mean age of the study subjects was 77.6±6.2 years (65-88 years, male 8 and female 17). The mean MMSE score was 16.4±5.7 (range, 8-29) and CDR was 1.2±0.7 (range, 0.5-2) (Table 1). This study was approved by the Catholic University of Korea, Catholic Medical Center Institutional Review Board.
MRI Scans
MRI examinations were performed using a 1.5 Tesla MR imaging unit (CVi; GE Medical Systems, Milwaukee, WI, USA). The common MRI parameters for FLAIR, T2-weighted images were a slice thickness of 5 mm, an inter-slice gap of 2 mm, and 22 axial slices. FLAIR image was obtained using a fast-spin echo sequence having TR/TE=9902/125.8 msec, inversion time=2,400 msec, a field-of-view of 220 mm and a 320×256 matrix. The TR/TE of T2-weighted image was 4,000/100.3 msec. T1-weighted Fast Spoiled Gradient Recall (FSPGR) images were also acquired in the coronal plane (TR=12.4 msec, TE=4.2 msec, TI=650 msec, 256×256 matrix, slice thickness=1.57 mm, flip angle=15, no interslice gap), yielding 124 slices through the brain.
WMHs measurements
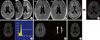
DICOM files of FLAIR image were converted to Analyze files, by using the MRIcro software (http://www.cabiatl.com/mricro/mricro/index.html). Semi-automated volumetric measurement of WMHs was performed on ANALYZE 10.0 (Mayo Clinic, KS, USA; http://www.analyzedirect.com/) on the axial FLAIR images by two trained and blinded raters. The skull and the soft tissue were removed manually, and the inhomogeneity and artifacts of the signal were corrected with Insight Segmentation and Registration Toolkit (ITK) in ANALYZE. After measuring voxel intensity of the whole brain with histogram, WMHs were selected with the threshold method. Lesions were marked and the borders were set, using a local threshold on each slice. All deep white matter lesions as well as periventricular lesions were included. When all lesions were delineated, the program calculated the total surface of the outlined area. A total volume of WMHs was established by multiplying the area with the inter-slice distance (Fig. 1). To correct for inter-individual variation in the brain size, a total intracranial volume (TICV) was manually outlined and ratios of the respective WMH volumes to TICV are referred to as normalized lesion volumes. The TICV was measured both on FLAIR and SPGR images, and these values from FLAIR and FSPGR images were correlated well (r=0.927, p<0.001). The TICV performed in FLAIR images was used in this study. The volumetric measurement was repeated after an interval of 7 days to determine intra-observer reliability.
For the gold standard of the WMH volumetric measurement, threshold method was applied with consensus of manual editing on each slice of the MRI images by the two raters. Histogram of the all slices of the FLAIR MRI was generated to calculate the optimal voxel intensity of the threshold, and the lowest voxel threshold was calculated as mean+1.3, 1.4, and 1.5 SD. After comparing the images of these values, with the gold standard image, the optimal threshold was decided as mean+1.4 SD. Miss-classified regions, out of white matter, were manually edited and the volumes of WMHs were generated by multiplying the area and the thickness of each slice.
The qualitative WMHs severity ratings were attained from FLAIR and T2-weighted images, which used the Scheltens' scale. The Scheltens' scale is a visual rating scale that includes anchored 7-point severity ratings in periventricular (ie, frontal horn, occipital horn, and lateral bands), cortical (ie, frontal, temporal, parietal, and occipital lobes), subcortical (ie, caudate, putamen, globus pallidus, internal capsule, and thalamus), and infratentorial (ie, mesencephalon, pons, medulla, and cerebellum) regions. Lesions connected to the lateral ventricles were labeled as periventricular WMHs. Inferior and superior boundaries for periventricular WMHs were within two sections caudal to the most caudal section and cranial to the most cranial section that showed the lateral ventricles. The WMHs severity measure for the current study was the sum of ratings for the 4 regions, and reviewed by the two trained raters.
Statistical analysis
The distribution of age, gender, K-MMSE score, and CDR score was compared by Kruskall-Wallis test, according to the severity of WMHs. And then, the association of the semi-automated volumetric methods (the gold standard and the method at the threshold of 1.4 SD) with the Scheltens' visual scale of WMHs was expressed as Spearman's correlation or Spearman rank correlation.
Inter- and intra-rater reliability of the semi-automated volumetric methods including the method at the threshold of 1.4 SD and the gold standard, and the Scheltens' visual scale were determined by intra-class correlation coefficient (ICC). The analysis was performed with the mean values. Computation was performed with the SPSS (version 15.0) for Windows (SPSS, Chicago, IL, USA), and the statistical p level was set at 0.05 for all analyses.
RESULTS
Processing of WMH lesions of one subject took 25 to 30 min including 15 min of preprocessing such as skull removal, depending upon the quality of the scan and the lesion burden. For all 25 subjects, the mean volume of white matter lesions, which was measured by using the gold standard volumetric method, was 25.26±22.75 mL, and those by using semi-automated methods were 27.23±22.82 mL at the threshold of 1.3 SD, 24.84±21.71 mL at the threshold of 1.4 SD, and 22.87±21.06 mL at the threshold of 1.5 SD. The volume measured semi-automatedly at the threshold of 1.4 SD was the most close to that by the gold standard volumetric method.
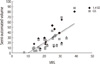
Among 3 groups according to their WMH severity, the distribution of age, gender, K-MMSE score, and CDR score was not different (Table 1). The mean ratings of Scheltens' visual scale were correlated with the mean volumes of the semi-automated (r=0.75, p<0.001) and the gold standard (r=0.75, p<0.001) volumetric method (Fig. 2). ICC between the gold standard and the semi-automated volumetric method at the threshold of 1.4 SD was 0.9822 (95% CI, 0.9506-0.9927).
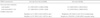
Test-retest reliability of the gold standard volumetric method was excellent (ICC=0.9929; 95% CI, 0.9840-0.9968). What is more, ICC for the intra-rater reliability of the semi-automated volumetric method at the threshold of 1.4 SD was 1.00 (95% CI, 0.9999-1.0000). Those were superior to those by the Scheltens' visual rating scales (in rater 1, weighted κ=0.772; 95% CI, 0.654-0.891 and in rater 2, weighted κ=0.751; 95% CI, 0.631-0.871). Inter-rater reliability in the gold standard volumetric method was ICC 0.9929 (95% CI, 0.9840-0.9968). Those of the Scheltens' visual rating scales were weighted κ 0.772 (95% CI, 0.654-0.891) and 0.751 (95% CI, 0.631-0.871). Intra- and inter-rater reliability of the semi-automated WMH volumetry at the threshold of 1.4 SD was excellent and the Scheltens' visual rating scale had a lower ICC than that of the semi-automated volumetric methods (Table 2).
DISCUSSION
This study illustrates an efficient, reliable lesion quantification method that can be performed in the elderly MRI scans. This method was also found to be well correlated with qualitative lesion rating measures. Reliability ICCs above 0.9 showed that this lesion quantification method was highly reproducible. Lesion processing times, which ranged from 25 to 30 minute, were also considered acceptable. It was not possible to compare the processing times between this and the previously published methodologies, since most articles did not state the time required. Of the methods that did not indicate an image analysis time per scan, none was shorter than 30 minute.
Hirono et al. [22] used FLAIR image for the quantification of WMHs in AD. They performed a semi-automated segmentation with intensity threshold for the determination of WMH volume, and achieved a high inter-rater reliability. Semi-automated segmentation methods have been used in a variety of multiple sclerosis (MS) lesion studies [23-27]. Some methods begin with the selection of lesion-intense regions, which uses a semi-automated feature [23-25]. This step is followed by a manual selection of the lesions in the segmented image. This type of method allows for a rapid identification of the regions with potential lesion, while providing for guidance from a trained analyst in the final selection of the lesions. This is critical because the regions with a lesion are often isointense with other brain areas, primarily due to partial voluming of the cerebrospinal fluid with brain parenchyma. More recent MS studies have relied upon the identification of the lesions on MRI films by a neuroradiologist, prior to the computer-assisted quantification of these identified lesions [26, 27]. In addition to being prohibitively time-consuming and expensive, this type of method is dependent on the initial subjective assessment of the MRI films.
In comparing our lesion quantification method with qualitative rating scales [28-31], the current method is less subjective, more reliable, and provides for more detailed information. Reliability results also indicate that our lesion quantification method is highly reproducible between the raters. Inhomogeneity of signal intensity is a feature of MRI scans and may impair the diagnostic interpretation of the images and the performance of intensity-based segmentation algorithms. The bias correction method that is performed in this study is a novel approach to the inhomogeneity problem that only relies on the information, which is present within the images [32]. It provided a better edge preservation than the previous methods such as Homomorphic unsharp masking, and substantially improved the accuracy of such segmentation.
This study did not separate deep white matter from periventricular lesions. However, future methods may provide guidelines for distinguishing these often confluent regions. In addition, this endeavor was limited by the current knowledge of neuropathology. As more research is done on the nature of hyperintense foci and lesions, it may be possible to more clearly identify which lesions are related to the disease and also to subdivide such lesions into more specific subtypes. In addition to the quantitative correlation in the present study, the qualitative analysis such as the voxel overlap would strengthen the study results [34].
Ideally, an automated volumetric method would be preferred to assess WMHs changes, as it provides the most detailed and objective information. While a fast fully automated method for measuring WMHs cross-sectionally is available [35], it has barely been examined for its reliability to measure the changes of WMHs. Moreover, all volumetric methods have been evaluated in studies with only involving a single-center, but are more difficult to implement in large longitudinal multicenter studies, using several MRI scanners. A semi-automated volumetric method has been proven to be reliable for measuring the progression of WMHs, especially in the multicenter studies [36].
This study has the strength that allow for just the FLAIR images to be used without the various MRI sequences. Because new protocol would not be needed, images from the multicenters, also routine images performed previously, might be used for the WMH volumetric studies. Although there are also some reports about the measurements of WMHs by using the intensity histogram of FLAIR [37, 38], the present study used the commercial image software, open to public. Therefore, anyone who is interested in this kind of study can use this method easily. We have a plan to study whether the images performed from the various MRI machines could be used together. Through these studies, we can perform the prospective studies involving multiple centers.
The semi-automated volume measuring method of WMHs, with ANALYZE, was a valid and reliable method to quantify subcortical white matter damages from various etiologies. A longitudinal study will be needed to validate its accuracy and usefulness to measure the change of WMH volume over time.
 XML Download