

 PDF
PDF ePub
ePub Citation
 Print
Print


INTRODUCTION
Import of coffee - one of the iconic favorite foods and pillars of the food service industry – rises rapidly each year in Korea.[12] According to an analysis of coffee consumption around the world, Northern Europeans drink three cups a day on average whereas Koreans drink 1.8 cups. It is also reported that coffee ranks the 24th among daily foods in terms of their contribution to energy intake and Koreans drink coffee more often than they eat rice and cabbage kimchi which represent staple diet for Koreans.[1] One of the causes underlying such trend is the extensive penetration of franchise coffee shops that have become cultural icons as they are extremely popular among college students and young office workers. Such preference for coffee can be understood as a lifestyle, yet, concerns associated with coffee such as intake of excessive calorie, imbalance in nutritional intake, decrease in bone density due to intake of caffeine contained in coffee, and increase in bone loss cannot be shrugged off.[3456] Hence, this study was conducted to identify the impact of coffee intake on bone health and present proper recommendations for coffee intake by comparatively analyzing lifestyles and vitamin D concentration in connection with the frequency of coffee intake among young adults in Korea.
METHODS
1. Subject
For analysis, this study used the database of the 5th Korea National Health and Nutrition Examination Survey (KNHANES V) 2010–2012, database. KNHANES is a countrywide survey conducted by the Korea Centers for Disease Control and Prevention (KCDC) under the Ministry of Health and Welfare. For statistical data representing whole country, stratified sampling used. All the research has been approved and designated by the government and executed the research subjects. Also, this study has been approved for using data from KCDC. Twenty to 39 years old, who participated in KNHANES providing data of their health medical examination, dietary lifestyle, physical examination and health, and their food in the years 2010, 2011, and 2012, were chosen as sample. First, among all respondents, a total of 25,534, from 2010 to 2012, subjects under 20 and over 40 years old (20,331) were excluded. Next, respondents who answered as non-descripted, none, and not applicable (2,680) were not considered either. As a result, a total 2,523 individuals were included in the final analysis. Based on the statistical report that average coffee consumption is 1.8 cups, the research subjects were categorized into 4 groups, according to the frequency of coffee consumption as Coffee A (less than 1 time/week), Coffee B (2–6 times/week), Coffee C (1 time/day), and Coffee D (more than 2 times a day). The questionnaire was from food intake frequency survey included in the KNHANES V.
2. Variables measurements
Variables used in research analysis focused on understanding lifestyle and serum vitamin D concentration. Variables used in the analysis were classified into different categories in reference to preceding studies – six socio-demographics factors (age, sex, body mass index [BMI], household income, education level, and marital status), four lifestyle factors (drinking status, smoking status, regular physical exercise, and eating-out frequency), and serum vitamin D level.
3. Statistical analysis
SPSS 18.0 programs (SPSS Inc., Chicago, IL, USA) was used for the statistical analysis and, to identify differences among the four groups in relation to coffee intake, means and standard deviations were analyzed by one-way analysis of variance (ANOVA) and frequency was analyzed by χ2 test. When significant difference appeared among the groups, turkey's multi-range test was conducted as post-hoc test. Statistical significance was determined at P<0.05.
RESULTS
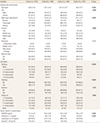
When the frequency of coffee intake by 2,523 young Korean adults was examined, it was found that 550 adults drank one cup a day (21.8%) and 973 drank no fewer than two cups (38.6%). The average age of the total subjects was 30.6±5 years. The average age of coffee C and coffee D was significantly higher than coffee A and coffee B who drank comparatively less coffee and the ratio of male was significantly highest in coffee D among the four groups. BMI was significantly higher in D than in coffee A and, in terms of the distribution of obesity, the ratio of obese subjects was significantly high at 27.7% in D. Most young Korean adults in their 20 to 30s were found to have received tertiary education. Higher frequency of coffee consumption was found in subjects with higher educational level, however, there was no significant difference between the 4 groups. When the frequency of coffee consumption according to marital status was examined, coffee D, the people with higher coffee consumption tended to be more in married people, which was statistically significant. The analysis of lifestyle factors shows a similar distribution of coffee intake frequency for subjects with 2 or more times alcohol consumption. However, coffee A members who only drank coffee had a significantly higher rate of non-drinking. Smoking was also a factor of lower coffee consumption frequency among non-smokers. In terms of regular exercise, there was no difference of coffee consumption frequency. The frequency of coffee D was significantly high among a group of higher frequency of dining out.
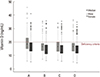
Potential difference in vitamin D concentration in blood was analyzed in connection with the frequency of coffee intake. Average concentration of vitamin D in the entire subjects was 16.2±5.3 ng/mL, with coffee D showing the lowest vitamin D concentration and coffee B, coffee C, and coffee D showing significantly lower vitamin D concentration than in coffee A who drank little coffee. Coffee B showed the highest vitamin D deficiency ratio but the combined ratio of vitamin D insufficiency and deficiency was found to be 70.7% in coffee A, 83.8% in coffee B, 82% in coffee C, and 84.5% in coffee D. In terms of gender, vitamin D concentration was found to be very low in heavy female coffee drinkers (Table 1, Fig. 1).
DISCUSSION
To Koreans, coffee now means a popular icon rather than being just one of the favorite foods. Caffeine contained in coffee has various physiological and pharmacological impacts on human body and some studies report caffeine has positive influence on human health.[789] However, it is reported in Korea that frequent intake of coffee is one of the factors aggravating dietary issues of college students and concerns about bone loss among young adults have been studied.[1011] This study analyzed potential difference in lifestyle and vitamin D concentration, targeting young adults in their 20 to 30s who constitute a new coffee consumer group. In results, age and the ratios of drinkers and smokers as well as the degree of obesity were high in the group who drank coffee most frequently, which shows a similar trend to other studies.[411] And the biggest significant difference appeared in coffee D who drank more than two cups of coffee a day. Furthermore, it was found a new in this study that the concentration of vitamin D in blood of those in their 20 to 30s was significantly low in coffee D drinking coffee frequently and among women. Moreover, it is noticeable that among all young adults, the rate of vitamin D deficiency is 80.3%. The study investigated vitamin D concentration following the frequency of coffee consumption, however it is limited since type of coffee, the use of vitamin D supplements, and other factors affecting meals were not considered.
In conclusion, according to the study, among young Korean male adults, high income, frequent social activity followed by alcohol consumption and smoking, and high rate of dining out showed a high frequency of coffee consumption. Also, women with higher coffee consumption frequency had the lowest vitamin D concentration. However, except for men with no coffee consumption, all the groups appeared to be vitamin D deficient regardless of coffee consumption frequency. Further studies are required to determine whether coffee intake itself is associated with vitamin D level, and coffee consumption needs to be managed to maintain serum vitamin D level related to bone health in young adults.
 XML Download