

 PDF
PDF ePub
ePub Citation
 Print
Print


INTRODUCTION
Osteoporosis is characterized by a low bone mass combined with a bone microarchitecture alteration increasing the overall bone fragility and consequently the fracture risk.[1] Multiple factors contribute to the structural integrity of the entire bones: total bone mass, bone geometry, and constituent tissue properties.[2] Despite the many contributors to bone strength, bone mineral density (BMD) measured by dual energy X-ray absorptiometry (DXA) remains the cornerstone for the assessment of fracture risk and drug treatment effect in the clinical setting.[34] However, BMD alone is insufficient to predict fracture risks because most individuals with a fragility fracture will have BMD values in the osteopenic or even normal range.[567] In addition, only a small part of the fracture risk reduction during drug treatment was linked to the BMD increase. Indeed, only up to 30% to 40% of the reduction of vertebral fracture risk was explained by the BMD increase at the spine with teriparatide treatment,[8] which dropped to 3% to 4% with raloxifene.[9] This suggests that factors other than BMD, such as bone microarchitecture, contribute to the reduction of the fracture risk.[10]
The trabecular bone score (TBS) is a novel gray-level texture metric, which is based on the analysis of two-dimensional spine DXA images. It is known that the TBS is highly correlated with trabecular bone microarchitecture independent of the BMD.[11] Recently, the spine TBS is a highly anticipated novel tool for osteoporosis diagnosis and fracture risk assessment.[121314] However, it is unclear whether the TBS is useful in evaluating the osteoporotic treatment effects. Several relatively small studies have examined the treatment-induced effects on spine microarchitectural texture as assessed by the TBS. Krieg et al. [15] reported that in women aged ≥50 years, the TBS is responsive to non-estrogen anti-resorptive drug therapy, and the treatmentrelated increase in the TBS is less than the increase in the BMD. These results confirmed the preservation effect of bisphosphonates (BPs) on microarchitecture at the iliac crest.[16] A sub-analysis of the Health Outcomes and Reduced Incidence with Zoledronic Acid Once Yearly (HORIZON) trial on 54 postmenopausal women [17] has demonstrated a significant increase in the BMD (+9.6% at 36 months) at the spine in a patient treated with zoledronic acid, whereas a slight but significant effect was observed in the TBS (+1.41% at 36 months) when compared to the placebo group (n=53). Finally, Senn et al. [18] reported that in postmenopausal women with osteoporosis, a 2-year treatment with teriparatide led to a significantly larger increase in the lumbar spine BMD and TBS (+7.6% and +4.3%, respectively) than that with ibandronate (+2.9% and +0.3%, respectively). The TBS tends to increase with treatments; however, the change in the TBS is less marked than that in the BMD.
BPs have been the most widely used agent in South Korea (about 80%) for the treatment of osteoporosis.[19] Robust data have demonstrated the efficacy of BPs in fracture risk reduction with a vertebral fracture risk reduction rate ranging from 40% to 70% and relative hip fracture reduction rate of 40% to 70% over 3 to 5 years of treatment.[20] BPs accumulate in the bone; therefore, their inhibitory effects on osteoclasts may persist for years after drug discontinuation.[2122] This mechanism has led to controversies regarding the ideal duration of the therapy and whether the drug provides protection after being discontinued.[23] Furthermore, the effect of BPs withdrawal on the spine TBS is still unclear. Therefore, we conducted a retrospective cohort study on postmenopausal Korean women who received BPs and evaluated the changes in the BMD and TBS during and after treatment.
METHODS
1. Subjects
The present study enrolled 239 postmenopausal Korean women who visited the outpatient clinic of Kangwon National University Hospital between January 2010 and December 2015. The participants were treated with BP therapy (PO alendronate 70 mg/week, PO risedronate 35 mg/week, PO ibandronate 150 mg/monthly, or IV ibandronate 3 mg/3 months) or they took drug holidays during their follow-up period according to the physician's decision.
The main inclusion criteria were as follows: >70% of drug compliance throughout the study, >2 BMD tests, regular BMD tests per year, and drug initiated or finished at the time of the BMD tests. The exclusion criteria were as follows: abnormal laboratory evidence of renal, hepatic, and thyroid function and secondary causes of osteoporosis (i.e., any drugs that could affect bone metabolism, such as glucocorticoid or anticonvulsant therapy, and any diseases that might affect bone metabolism, such as malabsorption, cancer, hyperparathyroidism, and rheumatoid arthritis). Also, the patients with side effects to BPs were excluded. Ultimately, 191 subjects were deemed eligible and were included in the study. Eligible women underwent an additional evaluation, such as assessment of the history of clinical fractures. The weight, height, and body mass index (BMI; expressed in kg/m2) of all patients were recorded. The Institutional Review Board of Kangwon National University Hospital reviewed and approved this study.
2. BMD and TBS
The areal BMD of the anteroposterior lumbar spine (L1–L4) and proximal femur (femoral neck and total hip) was measured annually in all patients using DXA (Lunar Prodigy Advance, GE Lunar, Medison, WI, USA), software version 9.30.044. The results of BMD values were expressed in g/cm2 as well as in T-scores. The in vivo precision rate of the machine was 1.25% for the femoral neck and 0.67% for the lumbar spine. All TBS measurements were performed retrospectively using the TBS iNsight Software, ver. 2.0.0.1 (Med-Imaps, Needham, MA, USA) using spine DXA files from the database to ensure blinding of the investigators to all clinical parameters. The software uses the raw DXA images of the anteroposterior spine for the same region of interest as in the lumbar spine BMD measurement.
3. Statistical analyses
Descriptive analysis included mean±standard deviations or as numbers and percentages. Changes in the BMD and TBS from the baseline were calculated for each patient as the absolute changes divided by the baseline value and converted into percentages. The results were expressed as mean±standard error of the mean (SEM). Correlations between BMD and TBS were evaluated with Pearson correlation test. All statistical analyses were performed using the SPSS statistical software (SPSS Inc., Chicago, IL, USA), and P<0.05 was considered statistically significant.
RESULTS
1. Baseline characteristics of the study subjects
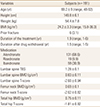
The mean age of the patients was 69.2 years (range, 48-92 years). Their mean BMI was 24.2±3.3 kg/m2 (range, 15.8-36.3 kg/m2), and only 6 (3.1%) patients had previous fractures. Among the 191 patients, 131 patients were treated with alendronate. The remaining patients were treated with risedronate (n=19) and ibandronate (n=59). Some of the patients' drug therapy was changed during follow-up. The baseline BMD and TBS of the patients are described in Table 1.
2. Changes in the BMD and TBS from the baseline during the BP treatment
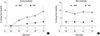
In the 191 patients treated with BPs, the changes in the BMD and TBS from the baseline were monitored. As shown in Figure 1, the lumbar spine BMD increased (3.65±0.50%), and the TBS also increased (0.26±0.40%) from the baseline during the first year. The correlation between the changes in the BMD and TBS was statistically non-significant (r=0.047; P=0.514) during the first year. At the second to the fourth year, the changes in the BMD and TBS from the baseline gradually increased, and the correlation between both results was statistically significantly (r=0.318, 0.369, and 0.485, respectively; P<0.001, 0.002, and 0.004, respectively) (Table 2). There were slightly lesser changes in the femoral neck and total hip BMDs than in the lumbar spine BMD during the follow-up period. Although annual BMD tests were performed 2 to 6 times per patient, the fifth and sixth year follow-up findings were excluded owing to the small number of patients (10 and 1 patient[s], respectively).
3. Changes in the BMD and TBS from the baseline after the BP withdrawal
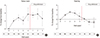
The changes in the BMD and TBS from the baseline during the drug holiday were evaluated in 86 patients (Table 3). After 1 year, the lumbar spine BMD decreased (-1.32±0.53%), and the TBS increased (0.09±0.59%). The correlation between the changes in the BMD and TBS was statistically non-significant (r=0.055; P=0.617). At the second year, both lumbar spine BMD and TBS decreased (-0.11±0.69% and -0.23±1.03%) from the baseline, without a statistically significant correlation (r=0.291; P=0.140). At the 3rd year, the TBS slightly increased again (0.33±1.96% from the baseline). Although annual BMD tests were performed for 5 years after BP withdrawal, the fourth and fifth year follow-up findings were excluded owing to the small number of patients (4 and 1 patient[s], respectively).
DISCUSSION
In the present study, we have evaluated the effect of BPs treatment and withdrawal on the BMD and TBS. We observed that the lumbar spine, femoral neck, and total hip BMDs increased significantly during treatment and minimally decreased after drug withdrawal. The TBS showed the same tendency as the BMD, although the changes were lesser than those of the BMD. The results of the two tests showed a significant correlation during treatment but not during drug withdrawal.
It is well known that not only low bone mass but also microarchitectural deterioration of the bone tissues increases bone fragility and causes fractures. Although BP is known to increase bone mass, previous studies have shown that bone quality is also improved when the effects of BP are assessed using conventional tools, such as quantitative computed tomography (QCT) and femur geography to evaluate bone microstructure.[2425] Although the TBS is not a direct measurement tool in evaluating bone microarchitecture, it is known to be associated with the three-dimensional characteristics of the bone, such as trabecular volume, number, thickness, spacing, and connectivity density. [1226] In fact, a high TBS reflects a strong, fracture-resistant microarchitecture, whereas a low TBS reflects a weak, fracture-prone microarchitecture. Therefore, as with other tools, the TBS was expected to improve with BP treatment; however, the TBS change in our study was unexpectedly insignificant. Nevertheless, the results of our study are also consistent with those of other studies. Several studies have examined the role of the TBS in determining the efficacy of BP therapy in osteoporosis. After treatment with alendronate, risedronate, and ibandronate, the TBS increased by 1.4%, 1.4%, and 0.03% at the 2-year follow-up, respectively. [1827] When zoledronic acid was administered, the TBS increased by 1.4% during the 3-year follow-up.[17] In our study, the lumbar spine TBS increased by 1.4% at the 2-year follow-up and 1.89% at the 3-year follow-up, which are consistent with those of previous studies.
Theoretically, the recovery of trabecular bone tissue loss is considered impossible. New trabeculae will be difficult to be reproduced, and it is likely that the trabecular thickness will increase instead. However, the trabecular thickness would be thick enough to be reflected in the TBS; it must be very thin before the treatment.[15] In fact, in a previous study that evaluated bone microarchitecture with high resolution peripheral QCT (HR-pQCT), trabecular thickness and trabecular density changes were very low at 0.9% and 0.4%, respectively, at the 2-year follow-up after alendronate administration.[28] Nonetheless, the improvement in the TBS after BP administration may be due to the following reason. If BP is administered and the bone mass increases, the overall trabecular gap will also improve. Consequently, the trabecular regularity and TBS will also improve. Because the TBS is derived from the texture of DXA images, an increase in the bone mass may also affect the trabecular volume, number, spacing, and connectivity density; therefore, the TBS may also increase. In fact, among BPs, the agents with a high potency in increasing the bone mass also further increased the TBS (zoledronic acid>alendronate=risedronate>ibandronate), although they are not compared directly.[171827] Recent studies with denosumab and teriparatide also support this hypothesis. New agent denosumab increased the TBS by 2.8% during a 2-year follow-up period.[27] Two studies on teriparatide reported that the TBS increased by 3.6% and 4.3%, respectively, during a 2-year follow-up period.[1827] Taken together, all anti-osteoporosis medications appear to increase the TBS as well as the BMD, although the TBS changes are insignificant compared to the BMD changes. However, bone formation agents and high-potency agents for BMD showed greater increases in the TBS. If we included those with zoledronic acid, the change in the TBS would have been greater.
As the bone effect of BP is retained for several years after BP withdrawal,[222930] we expected that the TBS remains after drug withdrawal in the same vein. Indeed, the TBS increased by 0.33% after 3 years of drug withdrawal in our study, which is different from that of the study by Krieg et al. in which the TBS of untreated patients decreased by 0.3% over a mean follow-up period of 3.7 years.[15] Thus, this study suggests that BP may preserve the bone microarchitecture measured by the TBS for several years after drug withdrawal. If so, the TBS is expected to decrease significantly in the case of selective estrogen receptor modulator (SERM), which is known to decrease the BMD drastically after discontinuation of the drug.[3132] Unfortunately, it has not been evaluated in our study; however, it is expected to be interesting if additional research studies are conducted in the future.
Previous studies showed no significant correlation (r=0.01) [18] or a weak correlation (r=0.20-0.25) [151733] between the BMD and TBS during anti-osteoporosis medication administration, which suggests that the two indices are partly independent measures of the bone structure. In our study, the two indices showed a significant correlation (r=0.32-0.49) from the second to the fourth year, although they showed no correlation (r=0.047) during the first year. This finding is different from those of other studies; however, as previously discussed, such correlations are also possible because the BMD increases the TBS.
The present study has several limitations owing to the small number of patients and retrospective nature of the analysis. It is also limited, since the mean follow-up period was only 1.9 years during treatment and 1.5 years after treatment, although we followed up the patients for 6 years. Furthermore, the evaluation of the treated and drug withdrawal patients was not the same; some patients were only evaluated during the treatment and some patients only after drug withdrawal. Finally, the important concern is whether a treatment-related increase and preservation of the TBS provide a fracture risk reduction. Unfortunately, we did not evaluate how these changes correlate with the fracture risk in this study. Moreover, this study did not include laboratory data associated with osteoporosis. Nevertheless, the strength of our research is that we only included the patients whose follow-up interval was constant and who started or changed their drugs after undergoing the BMD tests.
In conclusion, this study is the first to evaluate the effects of BP withdrawal on the TBS. We observed that the lumbar spine TBS increases significantly over time with BPs treatment; such an increase is preserved for years after discontinuing the treatment as also observed in the lumbar spine BMD. Further large-scale studies including other anti-osteoporosis medications are needed.


 XML Download