

 PDF
PDF ePub
ePub Citation
 Print
Print


INTRODUCTION
Body mass index (BMI) is an indicator of obesity that is the most widely used as it is easy and convenient to measure and calculate. However, there are limits of using BMI only to assess obesity, because when a case has a large body fat mass but appropriate overall weight (Wt) is classified as normal. On the contrary, any case with a small fat percentage can be classified as obese if having more muscle mass.[1] Therefore there are limits in predicting the risks of cardiovascular diseases and other metabolic diseases by defining obesity only using a simple BMI. In order to supplement those limits, in recent days, those with normal BMI but higher morbidity to metabolic diseases are defined as metabolically obese normal-Wt (MONW).[2]
As getting old, the body fat mass is increased and appendicular skeletal muscle mass (ASM) is reduced even if there is no change in the Wt.[3] Such loss of muscle mass and decreasing of strength is defined as sarcopenia.[4] When the muscles are reduced, it becomes frailty and its function is deteriorated,[5] so, it is known to ultimately increase mortality.[6] When reviewed studies conducted so far, there are some cross-sectional studies reported that the prevalence of metabolic syndrome and cardiovascular diseases has been increased in sarcopenia,[7] and some studies presented that the reduction of muscle mass did not have any independent associations with metabolic syndrome in the aged people.[8] Sarcopenia and the prevalence of metabolic syndrome had shown a large difference depending on various ways of defining sarcopenia, and according to a study, it had reported when defined sarcopenia by using the ASM adjusted for Wt, the level of insulin resistance and cholesterol was displayed as high in the group with sarcopenia, but when defined sarcopenia by using the value adjusted for height (Ht), there was no association presented.[9] Like this, the association of muscle mass with the risk of metabolic diseases is stirell controversial.
When BMI is normal, there is a possibility that obesity is not diagnosed in primary care so that it is difficult to control lifestyle such as diet and exercise, and is likely to have delayed diagnosis and treatment of chronic diseases. Therefore, studies analyzing the groups vulnerable to the chronic diseases despite normal Wt are required, but there are no studies so far, performed in Korean population to analyze the association between the metabolic syndrome and the presence/absence of sarcopenia. To this end, this study aimed to identify how skeletal muscle mass adjusted for Wt influence on the metabolic syndrome in those aged ≥65 years with normal BMI, based on the Korea National Health and Nutrition Examination Survey (KNHANES) that has representativeness in Korean population.
METHODS
1. Study subjects
The KNHANES was started in 1998, and currently it is conducted by the Korea Centers for Disease Control and Prevention (KCDC). It had introduced a rolling sampling survey so that it can represent the entire population of Korea. This nationally representative survey is composed with three component surveys: health interview, health examination including anthropometric measures and clinical profiles with three component surveys: health interview, health examination and nutrition survey to identify the actual status of nutrition. The KNHANES had measured bone density, muscle mass and body fat mass using a dual energy X-ray absorptiometry (DXA; Hologic Inc., Bedford, MA, USA) from July, 2008 to May, 2011. This study was conducted in adult men and women aged ≥65 years who are applicable to BMI ≥18.5 kg/m2 and <23.0 kg/m2 which is the Asia-Pacific Region Criteria of World Health Organization (WHO) among those who had completed DXA measurement within applicable period. Among the study population, patients with myocardial infarction, angina pectoris, stroke, renal failure, liver cirrhosis, or malignant tumor were excluded from analysis, so that a total of 674 men and 733 women were included in the analysis. All of the study participants were fully briefed about the study, and submitted informed consents for participation in health interview, health examination and nutrition survey.
2. Study method
The skeletal muscle mass was evaluated using the value (ASM/Wt, %) obtained by dividing ASM measured through DXA modified the definition of sarcopenia presented by Jassen, by Wt.[1011] Among adults aged between 20 to 39 years old who had participated in the KNHANES of the same period, the healthy men and women were set as the reference group, except patients with malignant tumor, stroke, myocardial infarction, angina pectoris, liver cirrhosis, heart failure, diabetes, hypertension, tuberculosis or asthma. Low muscle mass class 1 was defined as ASM divided by Wt 1 to 2 standard deviation below the mean ASM /Wt (%) value of gender specific young healthy adult and class 2 was defined as below 2 standard deviations.[912] According to the defining method of this study, those men with ASM/Wt (%) ≥30.52% were classified as normal group, whereas those men with ASM/Wt (%) ≥27.85% and less than 30.52% were classified as low muscle mass class 1, and with ASM/Wt (%) less than 27.85% were classified as low muscle mass class 2. In women, they were classified as normal and low muscle mass class 1 and 2, having 23.80% and 21.35% as references.
Among a variety of diagnostic criteria for metabolic syndrome, this study had adapted the National Cholesterol Education Program Adult Treatment Panel III (Modified NCEP ATP III) Criteria revised in 2004, and applied the Waist Circumference cut-off points for defining abdominal obesity in Koreans. When satisfied three or more of the following 5 criteria, the case was defined as metabolic syndrome.[1314] 1) Abdominal obesity: the waist circumference ≥90 cm for men, ≥85 cm for women respectively, 2) Hypertension: systolic blood pressure (BP) ≥130 mmHg or diastolic BP ≥85 mmHg or taking anti-hypertensive medication, 3) Hypertriglyceridemia: the level of triglyceride ≥150 mg/dL or taking medication for dyslipidemia treatment, 4) Low high-density lipoproteins (HDL) cholesterolemia: HDL cholesterol less than 40 mg/dL for men, less than 50 mg/dL for women, or taking medication for dyslipidemia treatment, 5) Diabetes: fasting blood glucose ≥100 mg/dL, taking hypoglycemic agent or insulin therapy.
3. Statistics
Taking into account the Wt per investigation area and the number of subjects for each test item per year, suggested by the KNHANES according to the test items, Integrated Wt was generated and used in the study analysis. Continuous variables had presented the calculated values using the mean±standard deviation (SD), whereas categorical variables had presented them using the estimated percentage. Through multiple logistic regression, variables that were likely to affect the metabolic syndrome were calibrated and the association of the ASM adjusted for Wt with the metabolic syndrome in normal Wts.
The study had used SPSS version 20.0 (SPSS Inc., Chicago, IL, USA) software, if the P-value (P value, P) and the trend value P (P for trend) of less than 0.05 was considered statistically significant.
RESULTS
Out of 674 male participants in the study, it was presented that 18.8% was low muscle mass class 1 and 5.2% was low muscle mass class 2. Among 733 female participants, 11.2% and 2.2% were classified as low muscle mass class 1 and 2 respectively.
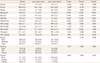
In men, the mean age of normal group was 71.8 years old, low muscle mass class 1 was 73.3 years old, and low muscle mass class 2 was 75.0 years old, indicating when higher the low muscle mass class got, older the mean age was (P=0.001). There were differences in BMI between three groups, presenting 20.6 kg/m2, 21.4 kg/m2 and 21.6 kg/m2 in each group respectively (P<0.001). There were differences also in the waist circumferences between three groups, presenting 77.3 cm in men with normal skeletal muscle mass, whereas it was 81.2 cm in low muscle mass class 1, and 83.5 cm in low muscle mass class 2, and there were significant differences between three groups (P<0.001). Systolic BP was statistically significantly higher in the group with less skeletal muscle mass compared to the group with normal skeletal muscle mass (P=0.024), and when compared the group with low muscle mass class 2 to other groups, there were also significant differences presented (P=0.007). Fasting blood glucose in three groups were 99.4 mg/dL, 111.1 mg/dL and 104.3 mg/dL respectively, presenting there were differences between the group with less skeletal muscle mass and the normal group (P<0.001). The level of triglyceride had presented significant differences between (P=0.006), but the level of HDL cholesterol had presented statistically significant differences when compared the group with low muscle mass class 2 to other groups (P=0.028) (Table 1).
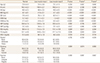
In women, there was no significant correlation presented from the skeletal muscle mass and age. The waist circumference was 74.5 cm in the normal group, while according to the levels of skeletal muscle mass, low muscle mass class 1 and 2 had presented 79.2 cm and 82.0 cm respectively, showing that low muscle mass class 2 presented the highest value (P<0.001). The levels of triglyceride in three groups were 137.1 mg/dL, 154.6 mg/dL and 177.7 mg/dL respectively, presenting there were differences between three groups (P<0.05), however, the items such as BP, fasting blood glucose and HDL cholesterol had not presented any statistically significant differences between three groups (P>0.05) (Table 2).
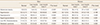
In men, as progressing from the normal, low muscle mass class 1 and low muscle mass class 2, the prevalence of metabolic syndrome components were significantly increased, such as abdominal obesity, hypertension, hyperglycemia, and Low HDL cholesterolemia (P<0.05), whereas in women, when the low muscle mass class was elevated, such as abdominal obesity, hypertension, hyperglycemia, and Low HDL cholesterolemia were presented with statistically significant increases (P<0.05). However, Low HDL cholesterolemia did not present any significant differences in both men and women (P=0.358, P=0.238). In men, the proportion of metabolic syndrome was presented from 14.3% of the normal group, 23.3% of the group with low muscle mass class 1 and 46.3% of the group with low muscle mass class 2. Such results indicated that the metabolic syndrome proportion was high in the group with reduction of skeletal muscle mass (P<0.001). Likewise in women, the prevalence of metabolic syndrome by each group was 36.8%, 59.0% and 64.2% respectively, presenting that the metabolic syndrome proportion was significantly increased as the low muscle mass class was progressed to higher level, similar to the men (P=0.002) (Table 3).
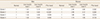
When didn't adjust relevant variables (Model 1), the odds ratio for metabolic syndrome in men and women with low muscle mass class 2 was presented as 5.15 and 3.08 (P<0.001, P=0.002). When adjusted for age (Model 2), the likelihood of occurrence of metabolic syndrome in men was presented as 1.92 times greater and 5.83 times greater in those with low muscle mass class 1 and class 2, compared to the normal group (P<0.001), while in women, they were presented as 2.49 times greater and 3.12 times greater than the normal group (P=0.002).
When adjusted for age and BMI (Model 3), the likelihood of occurrence of metabolic syndrome in men was presented as 1.53 times greater and 4.40 times greater in those with low muscle mass class 1 and 2, presenting that it was statistically significantly increased (P=0.004). In women, there were similar trends but with no statistical significance (P=0.074). (P<0.001, P=0.002). When additionally adjusted for smoking status, alcohol consumption, and exercise frequency (Model 4), it also presented a similar outcome to those adjusted for age and BMI (P=0.002, P=0.123) (Table 4).
DISCUSSION
According to this study which had analyzed the data of the KNHANES, 18.8% of adult men ≥65 years old with normal BMI was identified as low muscle mass class 1 and 5.2% as low muscle mass class 2. On the contrary, the low muscle mass class 1 and class 2 in women had shown 11.2% and 2.2% of prevalence respectively. When analyzed the aged subjects ≥65 years old whose BMI was ≥23.0 kg/m2 as collected from the data of the KNHANES conducted in the same period to this study, the men with low muscle mass class 1 was 39.5% and class 2 was 19.5% out of 883 male subjects. In comparison, out of 1,450 female subjects, 40.6% was low muscle mass class 1 and 14.5% was class 2, suggesting the aged with normal BMI presented lower prevalence of low muscle mass than the aged with obesity.
In this study, when adjusted for age, the low skeletal muscle mass was an independent risk factor of metabolic syndrome in both men and women, and as the low muscle mass class was progressed, the likelihood of metabolic syndrome was eventually increased. These findings were similar results to the studies that had analyzed the relationship between sarcopenia and metabolic syndrome without limiting BMI presented up to now. Kim et al.[7] had defined and analyzed sarcopenia in their study, using the ASM adjusted for Wt in the selected subjects aged ≥20 years old, also adjusted for BP, and presented that when adjusted for such as total cholesterol, fasting blood glucose and smoking status, the likelihood of developing metabolic syndrome in men with level 1 sarcopenia was increased by 3.5 times and in men with level 2, it was increase by 4 times with statistical significance. In women, the odd ratio was 1.5 and 2.7 respectively. Such results were presented in similar pattern in a study conducted in the aged, and in a study that had identified the association between sarcopenia and cardiovascular diseases in the aged ≥65 years old, sarcopenia had an independent association with cardiovascular diseases even if adjusted for the cardiovascular diseases-related variables.[10]
The pathophysiology of sarcopenia is not clear, yet, it has been known that it was developed by chronic inflammation status caused by reduction in producing testosterone, cortisol, and vitamin D and increase of resistance to them, decrease in muscular cells, muscle protein degradation and abnormalities of cytokine secretion regulation.[11] In sarcopenia state, the muscle mass is reduced which is primarily involved in glucose metabolism therefore the insulin resistance is to be increased regardless obesity status, and consequently, the person becomes vulnerable to diabetes and various metabolic diseases. Furthermore, due to the reduction of muscle mass, basal metabolic rate and physical activities are reduced resulting in increase of body fat, in addition to increase prevalence of fall, functional disability, and metabolism disorder as well as cardiovascular diseases, which will lead to increase of mortality.[5]
According to the results of this study, it presented that the likelihood of metabolic syndrome prevalence is increased as the low muscle mass class is progressed more particularly in men. It is also similar to the previous study, so the relevance with hormones should be considered.[15] Testosterone in men increases muscle mass and strength to activate the catabolism and assimilation path of protein. On the other hand, estrogen of women is primarily known to be involved in adipocytes.[16] As the secretion of male hormones is decreased and the low muscle mass class is progressed, there is a potential for increased prevalence of metabolic syndrome.
As for the limits of this study, first, it is a cross-sectional study using the data of the KNHANES, and by this study alone, it would be difficult to find out the prevalence of low skeletal muscle mass, and it was not possible to identify the causal relationship between the low skeletal muscle mass and metabolic syndrome. Secondly, in the European Working Group on Sarcopenia in Older People (EWCSOP) recently presented, it suggests deterioration of muscular strength or reduction of activities of daily living in addition to reduction in skeletal muscle mass as the conditions for defining sarcopenia.[17] Nonetheless, in this study, only the reduction of skeletal muscle mass was evaluated. But considering the correlation status of muscle mass and strength has been already well known,[18] if the low skeletal muscle mass was assessed by the criteria in accordance with this study, it is possible to predict that the muscle strength would also has been reduced. Thirdly, the skeletal muscle mass used in assessing sarcopenia is defined by a number of ways. The value obtained from dividing ASM by the square of Ht (ASM/Ht2, kg/m2) is also one of the marker to assess sarcopenia. However, with the ASM adjusted for Ht, it is difficult to adjust for the Wt appropriately so that it is difficult to adequately compensate the increase of muscle mass happening along with the increase of body fat mass to the greater level.[19] Also, there was an analysis reported that the ASM adjusted for Ht recently is inadequate to assess the functional impairment in the aged.[20] Also there was a study reported that the indicator of ASM adjusted for Wt had deeper association with metabolic diseases compared to the value adjusted for Ht [9] Therefore, this study had evaluated skeletal muscle mass by using the indicator of ASM adjusted for Wt, which was expected to reflect metabolic diseases relatively well among a variety of defining methods. Fourth, the inflammatory proteins such as C-reactive protein (CPR) and various cytokines had been known to cause sarcopenia.[21] Also, chronic inflammatory conditions are appeared to have association with metabolic disorders.[22] In addition, there was a lack of analysis on the argument that change in sex hormones has effects on the development of metabolic syndrome. In future research, it would require assessment of muscle strength and activities of daily living, coping with limitations of this study, and so would be a study that considers association of various inflammatory substances.
This study has its significance in terms that it had shown the reduction of skeletal muscle mass was a major risk factors of metabolic syndrome associated with future cardiovascular events even in the aged with normal BMI. When the BMI is normal, there are many cases that the assessment of obesity is not fulfilled not only by the person but also in primary care, thus, it is easy to have delays of appropriate education and changes in the lifestyle.
However, like the results of this study, the risk of metabolic syndrome can be elevated depending on the muscle mass, even if the BMI is normal. This indicates that there should be efforts to assess the muscle mass and obesity even in the aged with normal BMI, while since the skeletal muscle mass can be changed by adequate dietary and exercise methods, there should be educations available for those facts.
 XML Download