

 PDF
PDF ePub
ePub Citation
 Print
Print


Diabetes is one of the main risk factors of heart failure. Many patients with heart failure and hyperglycemic symptoms have accompanying abnormalities which lead to structural and functional abnormalities of the heart [1]. The association between diabetes and heart disease was first recognized in the late 1800s [2]. In 1974, the Framingham Heart Study [3] provided conclusive evidence of the role of diabetes in heart disease. In the same line, in a prospective study of 5,000 individuals, a two- and five-fold increase was observed in the risk of heart failure in diabetic men and women, respectively. The heart failure is now recognized as a major cause of death among the diabetics [4]. The accumulated evidences indicate that diabetic cardiomyopathy occurs from the coronary atherosclerosis commonly. Other features of diabetes can contribute to the injury to the heart musculature in these patients. The report by Rubler et al. in 1972 [5] supported this evidence based on the postmortem findings of heart failure in diabetic patients free of detectable coronary artery disease. These clinical findings plus many animal studies suggest that diabetes causes damage to the cardiac muscle. Pathologic findings have described diabetic cardiomyopathy as a microvascular disease, fibrosis and left ventricular hypertrophy, and increased myocardial stiffness leading to heart failure. This change occurs in diabetic patients independent of coronary artery disease or hypertension [6,7]. Although the pathological, physiological, and molecular bases of these changes have been reported, quantitative aspects of the structural changes of the diabetic heart have received less attention. In light of these many contributing studies, it remains uncertain how many cardiomyopathy changes occur in diabetic patients.
The present research is conducted to answer the following questions in an experimental type I diabetes mellitus model 56 days after diabetes induction using unbiased stereological methods: How many cardiomyocytes would be lost/remained after diabetes induction? Would the mean volume of the cardiomyocytes change? How much fibrous tissue would appear after diabetes induction? Would the length and diameter of the microvessels of the heart change? Would the volume of right and left ventricle change? A comprehensive understanding of the structural changes may lead to new and effective therapies toward prevention and amelioration of these changes, which is important for the millions of individuals who already have or are likely to develop the disease.
Materials and Methods
Experimental animals and diabetes induction
Ten adult male Sprague-Dawley rats weighing 200-250 g were used in this study. All the procedures were performed under the supervision of the Ethics Committee of Shiraz University of Medical Sciences, Shiraz, Iran. The animals were divided into two groups of five rats. In group I, the control animals received vehicle (citrate buffer). In group II, on the other hand, the animals were treated with streptozotocin (60 mg/kg) solved in citrate buffer to induce type I diabetes mellitus [1]. All the rats were housed under standard conditions (temperature: 22±2℃, relative humidity: 50%, with a 12-hour light/dark cycle) and had free access to laboratory food and water.
Isolation of heart
On the 56th day, anesthesia was done with an intraperitoneal injection of ketamine (60 mg/kg body weight) and xylazine (8 mg/kg body weight) [8]. The animals with blood sugar greater than 300 mg/dL were considered as diabetic [9]. Then, the thorax was opened and the hearts were removed and immersed in neutral buffered formaldehyde.
Estimation of the heart volume
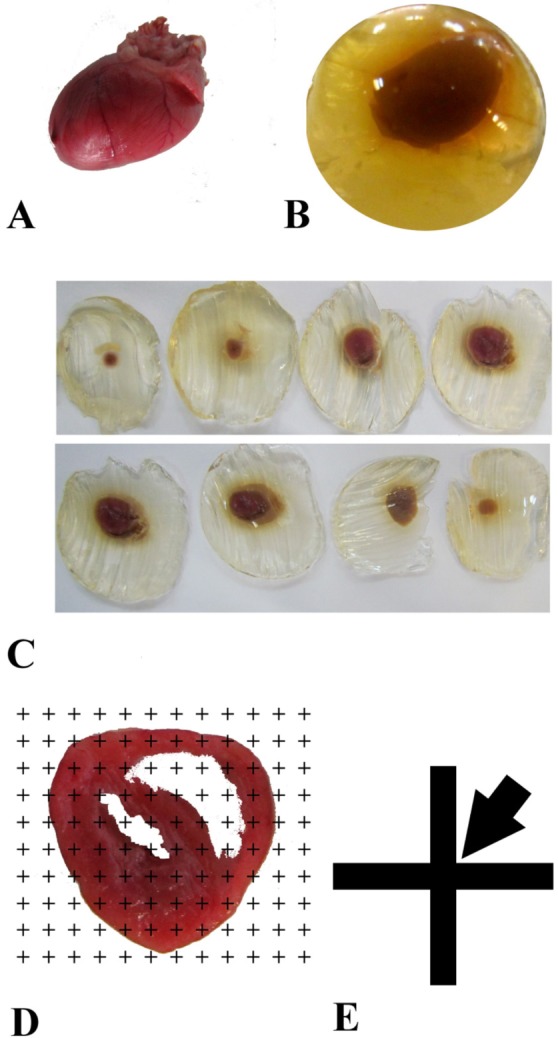
The heart volume was estimated according to the isotropic Cavalieri method as described by Mühlfeld et al. [10]. Isotropic uniform random sectioning was necessary for tissue shrinkage estimation. Briefly, the heart was embedded in a spherical agar block and placed in a tissue slicer (Figure 1). Starting at a random position outside the heart, the tissue was totally cut into slabs of 1.6 mm thickness. Eight to twelve slabs were obtained from each heart [10]. According to the Cavalieri principle and using the point-counting method, the primary volume of the heart was estimated using the following formula:
where "ΣP(heart)" was all the points hitting the cut surface of the heart tissue (302 points per animal on the average), "(a/p)" was the area associated with each point projected on the heart tissue (here 1.96 mm2), and "T" was the slab thickness (1.6 mm on the average) (Figure 1).
Small circular pieces of the heart tissues were punched from the slices using a trocar for further estimation of the tissue shrinkage. After processing and embedding the tissues in paraffin, 4 and 15 µm thick sections were obtained using a microtome. The slides were stained using hematoxylin and eosin. The mean degree of global tissue shrinkage "d(shr)" was calculated by:
where, "Area After" and "Area Before" were respectively the areas of the circle after and before the fixation, processing, sectioning, and staining [11].
Moreover, the final volume of the heart was estimated using the following formula:
Estimation of the volume of the vessels and connective tissue
The stereological counting equipment consisted of a Nikon E-200 microscope (Nikon, Japan) with a motorized stage and an electronic microcator (Heidenhain MT-25, Germany) connected to a computer and a monitor. By means of the software designed at Shiraz University of Medical Sciences, Shiraz, Iran, the stereological probes (point grids and counting frames) were superimposed onto the video images of the tissue sections and viewed on the monitor.
The volume density of the vessels and the connective tissue was estimated using the point-counting method [10-13]. Briefly, a grid of points was superimposed upon the images of the heart sections viewed on the monitor. The right upper corner of each cross point was considered as a point. The volume density "VV (structure/ref)" of the favored parameters was obtained using the following formula:
Estimation of the numerical density of cardiomyocyte nuclei
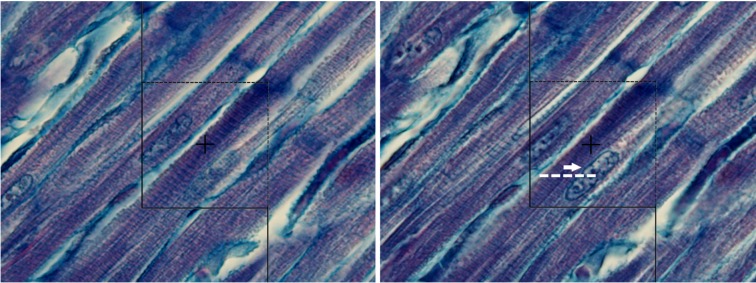
The fields of view in each section were sampled systematically randomly on each histological slide. Briefly, from a random starting point, the field of view was sampled with a fixed x- and y- distance from the previous field by means of the microscope stage micrometer. Using a 100 oil immersion objective lens at a final magnification of 1300x and a microcator, the numerical density and NV of the cardiomyocyte nuclei were estimated [12-14]. Briefly, using the optical disector method, an unbiased counting frame with an area of 2400 µm2 was used on the 15 µm thick sections (Figure 3). A guard zone was considered in each field of the sections; i.e., counting was started 5 µm below the upper surface of the section. Disector height or the distance between the first and the last optical sections was set as 5 µm. Any nucleus was counted when it was within the counting frame and did not touch any of the exclusion lines (left and lower borders) of the counting frame (Figure 3). The numerical density of cardiomyocyte nuclei in the heart, NV (nuclei/heart), was obtained using the following formula:
where "ΣQ-" was the total number of the counted nuclei (here 150 per animal on the average), "ΣP" was the total number of points falling on the myocardium tissue and it was placed at the center of the frame (here 120 points per animal on the average), "a/f" was the area of the counting frame, "h" was the height of the dissector, "t" was the mean section thickness which was measured at different places of the section and determined to be 14.92±0.24 µm, and BA was the setting of the microtome for sectioning of the block (15 µm).
Estimation of the number-weighted mean volume of the cardiomyocyte
The volume of the cells sampled with the disector method (number-weighted) was determined using the following formula (12):

where "mean ln3" was the average of the cubed intercept length across the cardiomyocyte through the center of the sampled nucleus (Figure 3).
Estimation of the length and diameter of the vessels
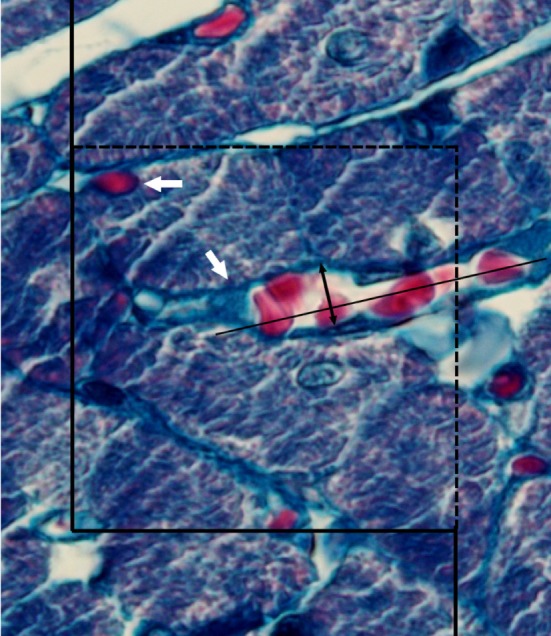
The length density of the vessels was estimated using the following formula:
where "ΣQ" denoted the total number of the vessel profiles counted per heart and "ΣP" and "a/f" were the total number of the counted frame and the area of the counting frame (2400 µm2), respectively (Figure 4).
Results
Fasting blood sugar, animal's weight, and heart weight
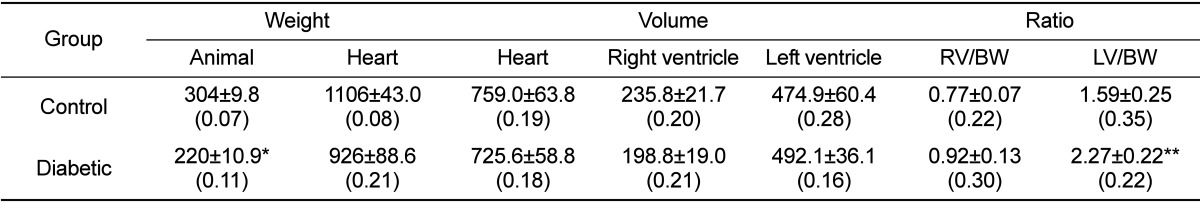
Fasting blood glucose level was 120.4±5.4 mg/dL in the control group, while 518.6±25.4 mg/dL in the diabetic rats (P<0.001). The animals' weight decreased in the diabetic group in comparison to the control group (P<0.01). However, no significant difference was found between the two groups regarding heart weight (Table 1).
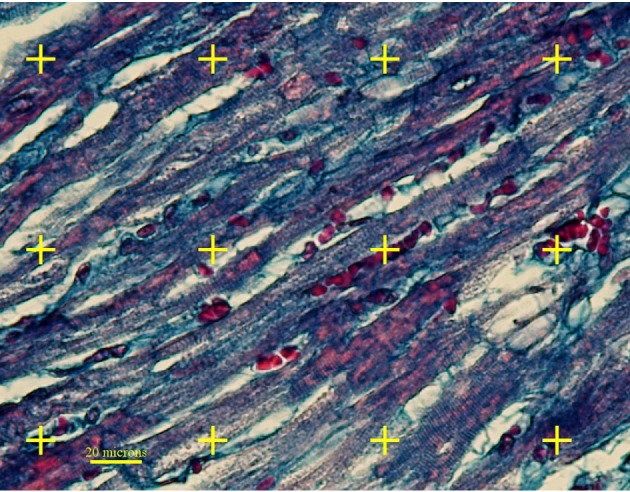
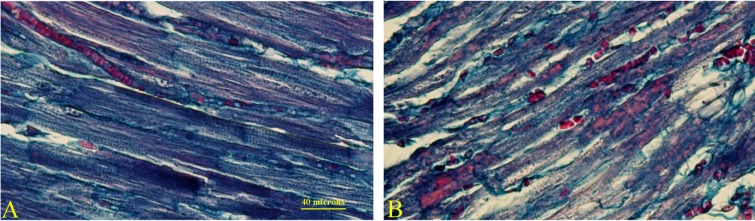
Moreover, qualitative microscopic evaluation of the diabetic heart showed more connective tissue and atrophic changes of the cardiomyocytes in comparison to the control group (Figure 5).
Volume of the hearts and ventricles
No significant difference was observed in the total volume of the heart and left and right ventricles (Table 1). Right and left ventricle volume to body weight ratios were also determined in the two groups and the findings were significant only for the left ventricle to body weight ratio (P<0.05) (Table 1).
Volume, length, and diameter of the vessels
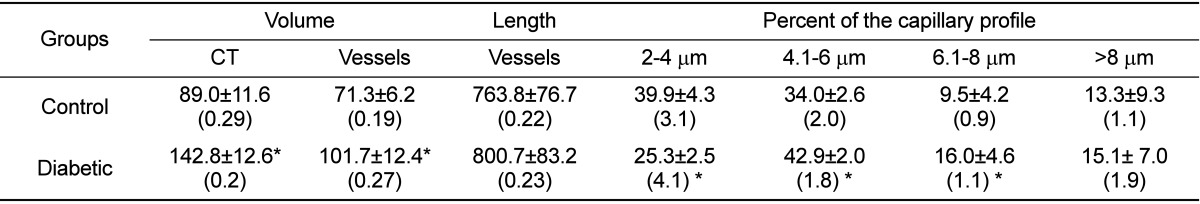
A significant difference was found between the two study groups regarding the volume of the vessels which had increased on the average by 43% in the diabetic rats (P<0.05). The percent of the vessel profiles with the diameter of 2-4 µm was decreased in the diabetic rats, while the percent of the vessel profiles with the diameter of 4.1-8 µm was increased in the diabetic hearts (P<0.05). However, no significant difference was found in the vessels with more than 8µm diameters in the two groups in this regard. Also, no significant difference was observed between the two groups regarding the total length of the vessels (Table 2).
Volume of the connective tissue
In comparison to the control group, a 60% increase was observed in the total volume of the connective tissue in the diabetic rats (P<0.05) (Table 2).
The total number of the nuclei and the mean volume of the cardiomyocytes
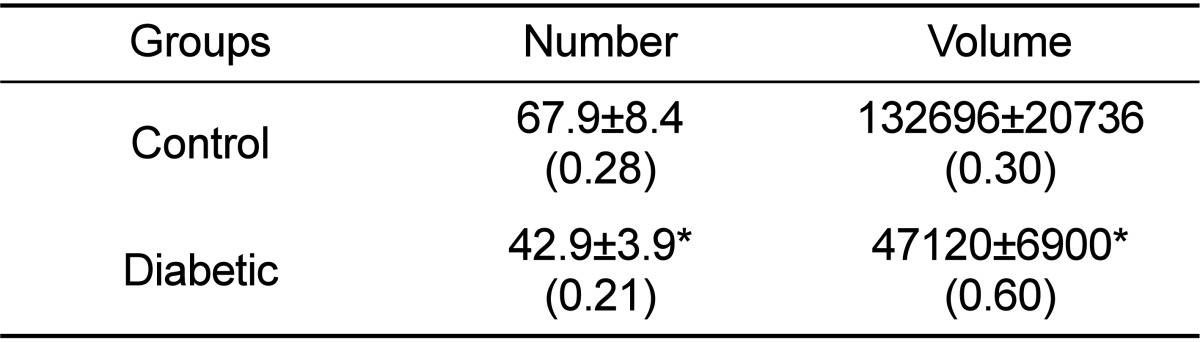
The total number of the cardiomyocytes' nuclei had significantly decreased by 37% in the diabetic group compared to the control group (P<0.01) (Table 3).
Furthermore, the number-weighted mean volume of the cardiomyocyte had decreased by 64% in the diabetic group in comparison to the control group (P<0.01) (Table 3).
Discussion
The present study quantitatively evaluated the structural changes of the heart in a diabetic animal model using the stereological methods.
Pathologic findings have described diabetic cardiomyopathy as a microvascular disease [6,7]. Previous studies have demonstrated that structural changes of coronary microvessels in diabetes include thickening of the vascular wall, perivascular fibrosis, capillary aneurysms, and decrease in capillary density [15,16]. One of the objectives of the present research was quantifying the length and diameter of the vessels. The findings of the present research showed no significant changes in the total length of the microvessels. It should be noted that length density is an orientation-dependent parameter in quantitative studies. In an interesting study, Fischer et al. (1992) showed that the capillary density (QA) was decreased in transverse sections, while increased in longitudinal sections in hypertensive and/or diabetic hearts [17]. To prevent any wrong conclusion about the length and diameter of the vessels, evaluation should be done on the isotropic uniform random microscopic sections as it was performed in the present study. Isotropic uniform random sections mean that all directions and positions of a specimen have equal chances to be sectioned and evaluated.
Another objective of the present work was evaluation of the volume of the ventricles walls. In an MRI study of diabetic rats, Loganathan et al. (2006) found an increased left ventricle wall volume to body weight ratio, suggestive of left ventricle hypertrophy and increase in the mean pixel intensity of the left ventricle wall perhaps due to the presence of fibrosis [7]. Similar results were also obtained in the present study.
When hypertrophy of a structure is studied, it is important to explain which structure has been increased. For instance, it was shown that connective tissue formation increased in diabetic hearts [7,18], which is consistent with the quantitative findings of the present research. However, estimation of the numerical density of the cardiomyocytes nuclei revealed a significant loss in the cardiomyocytes. It has been described that diabetes is sometimes characterized by cardiomyocyte necrosis/apoptosis and fibrosis [7,18]. Moreover, Mellor et al. (2012) and Lee et al. (2012) have described the role of autophagy in diabetic cardiopathology [19,20] and the cardiomyocytes loss can be explained using this finding. These changes might be the consequence of inflammatory and oxidative responses as well as the apoptotic effects [19,20].
Another objective of the present study was estimation of the mean volume of the myocytes. Soetikno et al. (2012) estimated the cardiomyocyte diameter as an index for reporting myocyte hypertrophy in the diabetic heart [18], which is not in line with our findings. This difference might be due to the measurement methods. In general, histomorphometrical studies rely on 2-dimentional measurement, such as diameter, while stereological methods can provide 3-dimentional data, including mean cell volume. In contrast to the study by Soetikno et al. (2012), Kawaguchi et al. (1999) estimated the myocytes' diameter size and concluded that the cardiac myocytes of the diabetic patients or animals appeared to be atrophic [18,21]. It can be concluded that diabetes can induce structural changes, including loss and/or atrophy of the cardiomyocytes, accompanied by increase in connective tissue in the rats' hearts 56 days after diabetes.
 XML Download