

 PDF
PDF ePub
ePub Citation
 Print
Print


Introduction
Chest pain is one of the most common complaints that brings a patient to the emergency department (ED). The percentage of patients who present at the ED with acute chest pain and are admitted to the hospital may actually be increasing. The differential diagnosis of chest pain is broad and includes cardiac as well as non-cardiac diseases. One of the initial goals in the ED evaluation of a patient presenting with chest pain is to rapidly and accurately diagnose the presence or absence of acute coronary syndrome. Diagnostic protocols to rule out coronary artery disease (CAD) are based on risk factors, multiple electrocardiographic (ECG) assessments, repeated cardiac biomarker assessments, noninvasive stress testing, and, if indicated, invasive coronary angiography (CAG). The diagnostic accuracy of the initial routine evaluation is often limited and results in frequent admissions for patients presenting with chest pain for further diagnostic testing.1)2) The misdiagnosis or overdiagnosis of patients with acute chest pain can be associated with serious clinical events or time-consuming and places a heavy burden on overcrowded ED.3) Conventional transthoracic echocardiography (TTE) is known to be useful in ED for the detection of acute myocardial infarction (AMI) with a higher sensitivity than ECG. However, a previous study showed that TTE was not useful for detecting patients with significant CAD without infarction when performed after resolution of chest pain.4) In addition, current guideline recommends TTE in patients with suspected myocardial ischemia as an appropriate use only if a resting TTE can be performed during pain. Furthermore, the detection of regional wall motion abnormality (RWMA) on TTE is subjective and observer-dependent. The analysis of regional myocardial velocity, strain rate or strain assessed using the tissue Doppler technique permits sensitive detection of post-systolic thickening and improves the accuracy of diagnosis of ischemic heart disease.5) However, the angle dependency of the Doppler technique frequently makes evaluation of RWMA.
B-mode tissue tracking is a promising method for evaluating regional wall motion without angle dependency.6) Using a novel feature-tracking algorithm, velocity vector imaging (VVI) can display velocity vectors of regional wall motion overlaid onto the B-mode image and allows the quantitative assessment of left ventricular (LV) myocardial mechanics.7) VVI is a unique technique with complex signal processing but a straight-forward user interface requiring only a single frame tracing of the endocardial border to extract quantitative time-motion data that not only facilitates regional myocardial velocity and strain measurement but also rapid visual assessment of synchronicity.8) However, its efficacy for diagnosing myocardial ischemia in ED has not been elucidated. We hypothesized that VVI would allow sensitive detection of RWMA induced by postsystolic thickening during ischemia in ED and be able to demonstrate the accurate spatial extent of the ischemic risk area without angle dependency.
Methods
Study subjects and protocols
Patients who were older than 18 years and who had presented to ED with acute chest pain between June 2005 and June 2007 were prospectively enrolled in our hospital's chest pain registry. Acute chest pain was defined chest pain of longer than 5 min experienced within the 48 h before the ED visit. All patients were initially assessed by an ED attending physician with initial ECG, cardiac enzyme (CK-MB and Troponin I), and chest X-ray. Patients with ST-elevation myocardial infarctions (STEMIs), unstable hemodynamic conditions, or alternative diagnoses of non-cardiac chest pain as based on the initial assessment were excluded in this study. Study candidates who required further cardiac evaluation underwent routine TTE including VVI in ED. After TTE, patients who met the following criteria were excluded from this study: patients with previous AMI, after coronary artery bypass graft, non-ischemic cardiomyopathy, fatal arrhythmia, high grade valvular disease, severe pulmonary hypertension or poor echocardiography image. The decision of whether to perform further tests for CAD using coronary computed tomographic angiography (CCTA) or CAG, or to discharge from ED was made by an ED physician and an on-call cardiologist. If there was significant stenosis on CCTA, CAG was performed subsequently. This study protocol was approved by the ethical committee of the Institutional Review Board at Seoul National University Hospital.
Conventional 2D Doppler echocardiography
In left lateral decubital position the patients underwent TTE according to the American Society of Echocardiography (ASE) guidelines4) on a Sequoia Ultrasound System (Siemens Healthcare, Erlangen, Germany) equipped with a phased array transducer (frequency range of 3.75–4.25 MHz). ECG-controlled parasternal long axis, parasternal short axis, apical 4-, 3-, and 2-chamber views of LV walls were obtained. LV ejection fraction was calculated by the modified Simpson's method. Left atrium and LV diameter were measured by M-mode echocardiography. Regional LV function was evaluated and scored for each segment by visual assessment of RWMA.
Velocity vector imaging
We employed the ASE recommendation of a 16 segments model for echo data. Basal and mid ventricular segments were labeled as anteroseptal, inferoseptal, inferior, inferolateral, anterolateral, and anterior. The parasternal short-axis apex is devided into the same four segments (septal, inferior, lateral, and anterior). The LV parasternal short-axis views were recorded with the same ultrasound machine. Three consecutive cardiac cycle loops were recorded at end expiration. Images were recorded with an acoustic method that provides information frame by frame. The frame rate was kept between 70 Hz and 100 Hz. The imaging sector was optimized to complete visualization of the LV. For the detailed evaluation of regional wall motion, the timing of mitral valve opening (MVO) was determined by measurement of mitral inflow in the apical 4-chamber view by pulse Doppler and that of aortic valve closure (AVC) was assessed from the aortic component of the second heart sound derived from the phonocardiogram, which was simultaneously displayed with Doppler data. High frame rate acoustic capture B-mode data were analyzed using off-line software (SyngoVelocity Vector Imaging, Siemens Healthcare). The observer defined the endocardial border manually and placed regions of interests in the middle of every segment. The endocardial border and the myocardium was then automatically tracked frame-by-frame by the VVI software throughout the cardiac cycle. Afterward, VVI automatically tracks the tissue beneath the initial trace, spatially and temporally for all the frames in the clip, using a feature-tracking algorithm.7) For measuring transmural radial strain, we manually placed the same number of epicardial points as defined in the endocardium. The epicardial border was tracked using the same algorithm as mentioned previously, and radial strain between the endocardial and epicardial borders was calculated. We measured peak systolic radial velocity (Vpeak) as a parameter of systolic function and radial velocity at MVO (VMVO) as a parameter of dyssynchronous motion induced by post-systolic thickening. Time-strain curves were also analyzed in the same points and peak systolic radial strain was measured.
Coronary angiography
CAG was performed in a median of 26 hours (interquartile range, 22 hours) after admission. Given the cut-off diameters of stenosis > 90% for three epicardial vessels and > 50% for the left main coronary artery as diseased artery, we defined the number of affected vessels.
Statistical analysis
Categorical variables are presented as a number and percentage (%). The chi square or Fisher's exact tests were used for comparison of categorical variables. Continuous variables are expressed as mean ± SD and were compared using an independent t test or the Mann-Whitney test. A post hoc test, Bonferroni's test, was also applied to compare the paired groups. Receiver operating characteristic (ROC) curve analysis was used to test the diagnostic accuracy of VVI for discriminating the true ischemic patients. To investigate intra-observer variability, measurements were done off-line on 20 randomly selected cases one month later and analysis was performed using Bland-Atman plot. A two-tailed p value of 0.05 was considered statistically significant. All statistical analyses were performed using SPSS 17.0 version (SPSS Inc., Chicago, IL, USA).
Results
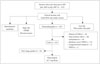
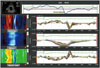
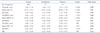
Between July 2005 and July 2007, 352 patients (183 men) with a mean age of 60.6 ± 12.5 years, who visited Seoul National University Hospital ED with chest pain, were selected in this chest pain registry as study candidates excluding patients satisfying initial exclusion criteria (hemodynamic instability, STEMI, non-cardiac origin chest pain). Among these patients, 183 (52%) were hypertensive and 90 (29%) were diabetic (Table 1). Routine TTE was performed in all 161 patients. Following obtaining a history and routine TTE, additional 34 patients with known CAD, non-ischemic cardiomyopathy (n = 28), arrhythmia (n = 19), moderate to severe valvular heart disease (n = 12), congenital heart disease (n = 3), or pulmonary artery hypertension (n = 1) were excluded. Of the remaining patients, total 64 patients underwent CAG. However, 16 patients were excluded from VVI because of poor echo window or poor patient cooperation which prevented precise evaluation. Therefore, in 677 of 768 segments (88%) the analysis by VVI was feasible among 48 patients (Fig. 1). Segments were excluded if the endocardial border was not tracked properly, if the digital storage of 3 cardiac cycles was not completed, and if movement of the files was evoked by breathing excursions of the patient. The mean picture frame rate was 75 ± 16 s-1. Visual RWMA was detected in 79 segments by visual assessment in 47 hypokinesia segments and 32 akinesia segments. VVI analysis including image acquisition usually took 2–5 min. We showed the comparison between RWMA by visual assessment and the data of VVI in Table 2. Velocity vector images at peak-systole, MVO time and AVC time in the same patient are shown in Fig. 2. Vpeak and strain significantly decreased according to visual RWMA (Vpeak, 3.50 ± 1.34 cm/s for normal myocardium vs. 3.46 ± 1.52 cm/s for hypokinesia, 2.51 ± 1.26 for akinesia, p < 0.001; peak systolic radial strain -31.74 ± 9.15% for visually normal myocardium, -24.33 ± 6.28% for hypokinesia, -20.30 ± 7.78% for akinesia, p < 0.001). However, the velocity vectors at the time of MVO were directed outward in the visually normal myocardium, inward velocity vectors were revealed in the visually akinetic area (VMVO, -0.85 ± 1.65 cm/s for normal area vs. 0.10 ± 1.46 cm/s for akinetic area, p < 0.001). The velocity vectors at the time of AVC were not significant different among visually assessed RWMA.
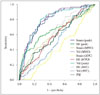
In the ROC curve analysis for detecting ischemia from values in the RWMA, the areas under the curve for Vpeak, peak systolic radial strain, VMVO were 0.791 [p < 0.01, 95% confidence interval (CI) 0.690 to 0.830], 0.792 (p < 0.01, 95% CI 0.701 to 0.841), and 0.781 (p < 0.01, 95% CI 0.780 to 0.836), respectively (Fig. 3).
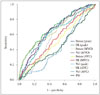
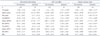
CAG was performed in all 48 patients. Seven patients had significant left anterior descending (LAD) stenosis, 10 patients had left circumflex (LCx) stenosis and 16 patients had right coronary artery (RCA) territory. Three of them are two vessel disease. Among 677 segments, 141 segments had significant coronary lesions (the presence of significant CAD was defined as ≥ 90% stenosis in one or more vessels on CAG). Interestingly, 100 segments among visually normal myocardial function area (negative RWMA) had shown to be significant stenosis area. Additionally, 38 segments in visually hypokinetic RWMA area were revealed as normal CAG. Table 3 showed quantitative parameters according to the CAG result in patient with normal wall motion abnormalities. The previously mentioned characteristics in all segments were also shown in the visually normal but significant CAG segments by the profiles of radial myocardial velocity at points in the stenosis area and the opposite normal area. For radial velocity, positive values represent inward wall motion and negative values represent outward wall motion. At CAG, Vpeak decreased in the ischemic area compared with that in normal area (Vpeak, 3.58 ± 1.30 cm/s for normal area vs. 3.15 ± 1.47 cm/s for ischemia area, p < 0.01). In ischemic area, inward wall motion was again revealed after AVC and reached a peak at MVO. As a result, VMVO clearly increased in the ischemic area (VMVO, -0.88 ± 1.56 cm/s for normal area vs. 0.70 ± 2.04 cm/s for ischemic area, p < 0.01). In the ROC curve analysis for detecting significant stenosis from values in the visually assessed normal myocardial wall motion, the areas under the curve for Vpeak, peak systolic radial strain, VMVO were 0.661 (p < 0.01, 95% CI 0.591 to 0.720), 0.641 (p < 0.01, 95% CI 0.601 to 0.703), and 0.60 (p < 0.01, 95% CI 0.521 to 0.679), respectively (Fig. 4). Table 4 showed quantitative parameters according to the CAG result by vascular territory. In the LCx and RCA territory, Vpeak significantly decreased in the ischemic area compared with normal area and VMVO clearly increased in the ischemic area. It means VMVO in the normal perfused area was markedly negative, indicating hyperkinetic dilatation as a compensatory motion.
Interobserver and intraobserver correlations
For the interobserver and intraobserver correlations in the VMVO measurement, mean difference were -0.02 and -0.05 and limits of agreement (± 1.96 SD) were ± 0.82 and ± 0.52, respectively. Mean differences in the Vpeak measurement were 0.18 and 0.12 and limits of agreement were ± 0.96 and ± 1.25 cm/s, respectively.
Discussion
In the present study, we investigated the applicability of new semi-automated cardiac function analysis tool, VVI, in the evaluation of the patients with acute chest pain in ED. The main findings of this study are 1) quantitative RWMA analysis using VVI showed good correlation with visually estimated RWMA. 2) Quantitative parameters were significantly different in the angiographically proven ischemic segment, compared with non-ischemic segment. 3) Although Vpeak significantly decreased in the ischemic area compared with normal area and VMVO clearly increased in the ischemic area. It means that the assessment of VVI at MVO could permit easy detection of dyssynchronous wall motion during myocardial ischemia that cannot be diagnosed by conventional measurement of systolic wall thickness. But, clinical utility of quantitative parameters to detect significant coronary stenosis would be limited due to its low area under the curve of ROC curve.
Myocardial ischemia is known to progress in a “cascade” of events in which the various markers are hierarchically ranked in a well-defined time sequence.9) Current stress testing modalities are limited in their ability to detect functional myocardial changes prior to the manifestation of systolic abnormalities. Conventional echocardiography is known to be useful in ED for detection of myocardial infarction, its assessment has generally been limited to the identification of ischemia as a stress-induced worsening of myocardial contractility when compared to baseline.10) The introduction of tissue Doppler imaging have shown that the diagnostic accuracy of strain echocardiography in patients with chest pain is superior to that of visually accessed RWMA by 2D echocardiography.11)12) Unfortunately, the parameters of regional myocardial function obtained using the tissue Doppler technique cannot be analyzed in several regions of the myocardium because of angle dependency.13)14) This limitation is fatal for the diagnosis of ischemic heart disease because of impairment of wall motion occurs regionally at ED. The newly developed technique of VVI, which uses a tissue tracking algorithm, displays velocity vectors in all segments of the myocardium without angle dependency.15) The vector expression of myocardial velocity permits the easy detection of dyssynchronous motion of the myocardium. These characteristics of VVI may be advantageous in detecting RWMA due to ischemic heart disease. Consequently, we devised a pilot study to test a new normalized strain algorithm to objectively assess RWMA of the LV myocardium in patients with and without documented occlusive CAD patients visiting at ED.
We measured VVI at three points; peak systolic time, MVO time and AVC time. In our results, Vpeak derived by VVI significantly decreased in the ischemic area. In contrast, VMVO increased in the ischemic area. Interestingly, some area of visually normal RWMA area with positive VMVO showed ischemic area during CAG. The increase in VMVO is considered to be caused mainly by post-systolic thickening in ischemic myocardium. Recently, Claus et al.16) have reported that post-systolic thickening is the result of the difference in contractility with the adjacent normal regions. Our results seem to support their theory because there was the significant difference in values of peak systolic radial strain and Vpeak between the normal and ischemic areas. VMVO significantly decreased in the normal area but increased in ischemic area. Masuda et al.17) also showed that sensitivity and specificity of VMVO for detecting ischemia were superior to those of other parameters. The assessment of VVI at MVO could permit easy detection of dyssynchronous wall motion during myocardial ischemia that cannot be diagnosed by conventional measurement of systolic wall thickness.
VVI echocardiography can be easily carried out in ED. It does not have the risks associated with the use of a contrast agent or radiation exposure. Furthermore, neither fasting nor additional medication is required for echocardiography. In this study, we used online strain analysis to evaluate acute chest pain in ED. The feasibility of this method was limited in some patients with a poor echocardiographic window, but its use could be acceptable in daily clinical practice when considering the lack of additional risks and the relatively low cost. However, in aspect of specificity and sensitivity it has still have limitation. Thus, consecutive work-up for patients with abnormal VVI value should be individualized according to clinical situation.
Limitation of the study
There were some limitations to this study. First only 48 patients underwent CAG and analyzed VVI. It is very small number of patients. This prevented us from calculating the diagnostic performance for significant CAG in all chest pain patients visiting in ED. The patients with visually assessed RWMA had twice more RCA territory ischemic insult compared with LAD territory. Additionally 100 segments among visually normal myocardial function area had shown to be significant stenosis area and most of them are RCA territory. We think the study population is relatively small so it makes selection bias for the result. So LAD disease did not showed quantitative parameters differences between non ischemia and ischemia. As in all other studies of echocardiography, image quality was an important limitation in our study. This could also be a significant limiting factor for application of TTE with VVI to patients in ED in real clinical setting. Myocardial velocity is always influenced by overall heart motion and tethering effects. The myocardial velocity derived by VVI is also influenced by these effects. Although it is suggested that post-systolic inward motion by VVI is mainly due to post systolic thickening, it can also be induced by the overall motion of the heart. Finally, we only included patients who visited the ED with acute chest pain and excluded patients who were considered as having non-cardiac chest pain on the initial assessment. Therefore, our result should not be applied to patients with chest pain in other settings.
Conclusion
VVI is a clinically feasible approach for strain measurements in ischemicmyocardium allowing an accurate assessment of global and regional myocardial function, and a differentiation between ischemic and non-ischemic segments in ED. Further research for the definition of cut-off values and technical standards will be needed to fully integrate this method into clinical practice at ED.


 XML Download