

 PDF
PDF ePub
ePub Citation
 Print
Print


Introduction
In the era of personalized medicine, founded in molecular genetics, comprehensive assessment of alterations in physiological performance is required in preclinical models for appropriate phenotyping. Increasingly, mice are being used as preclinical models for pulmonary hypertension and right heart failure due to availability of genetic models.1)2)3) Preclinical evaluation of pulmonary and right heart function by echocardiography is a highly-useful and reproducible non-invasive method.1)4) It enhances the temporal and spatial resolution for assessment of cardiac and vascular functions. For the left ventricle (LV) assessment echocardiography has been proven to be a versatile tool for evaluation of LV structure, systolic, diastolic, and vascular functions in mouse cardiomyopathy models.5) However, the right ventricle (RV) and vascular functions associated with it are not comprehensibly evaluated. There seems to be significant variability among mouse strains,6) as well as, age- and gender-related differences that have been reported.7) Therefore a comprehensive and standardized echocardiographic assessment of the right heart and vascular functions will be extremely critical.
In the field of clinical echocardiography, there have been dramatic advances over the past 20 years.8) However, many of these advances involving the assessment of left heart only. A few years ago guidelines and standard values were revised by the American Society of Echocardiography regarding the assessment of the right heart in clinical practice.9) Though these guidelines were released almost 5 years ago, many of the assessment parameters defined for the right heart are not being considered or applied to important preclinical experiments assessing therapeutic molecular modifications, specifically in genetically-modified murine models of pulmonary hypertension.
In preclinical studies, C57BL/6 and CD1 mouse models are the most commonly used for evaluation of cardiovascular function and changes occurring due to pharmacological, physiological or genetic variabilities.1)4)5)10)11) In this article, we have focused on providing a practical guide on how to image and assess the cardiovascular function of the right heart of both mouse models. We have listed experimental values for physiologic parameters of the right heart that can be used towards the creation of standardized reference values and also found differences in the structure of the right heart for both mouse models.
Methods
Animals
Four months old CD1 (n = 18) and C57BL/6 (n = 26) mice were used for echocardiography analysis. The experimental procedures were designed in accordance with National Institutes of Health and American Association for the Accreditation of Laboratory Animal Care guidelines, and approved by the Drexel University College of Medicine Institutional Animal Care and Use Committee, Philadelphia, PA, USA.
Echocardiography
A high-frequency, high-resolution digital imaging platform with linear array technology and color Doppler mode for in vivo high-resolution micro-imaging was used for echocardiography (Vevo® 2100 Imaging System, FUJIFILM VisualSonics Inc., Toronto, Canada). For assessing cardiovascular function of mice a high-frequency transducer probe (VisualSonics MS400, FUJIFILM VisualSonics, Inc., Toronto, Canada with a frequency range of 18–38 MHz) was utilized as it provides appropriate resolution and depth of penetration needed. All echocardiograms were performed by one trained individual, and images were reviewed in conjunction with a clinical cardiologist and echocardiographer to ensure optimal image quality.
Both strains of mice were anesthetized with 2.5–3.0% (v/v) isoflurane mixed with room air. A second group of mice was studied in which isoflurane was mixed with 95% oxygen (v/v) to assess any effect of hypoxia on pulmonary valve hemodynamics. Mice were evaluated with a toe pinch to ensure a complete anesthesia. After achieving an adequate anesthesia, anthropomorphic measurements were taken. We measured the total body weight and nose to anus length, and secured mice on a prewarmed (37℃) imaging platform. About 2 mL of electrode gel is applied to each paw to connect them with electrocardiogram leads embedded in the imaging platform. Hairs from the ventral chest were removed by the use of commercially available hair removal cream (Nair™, Church & Dwight Co., Ewing, NJ, USA).
Mice were continuously monitored and isoflurane concentrations were titrated (1–3%) during imaging to maintain heart rate at 425 ± 50 beats per minute (bpm), compared to a basal heart rate of that is typically greater than 600 in active, conscious mice of both CD1 and C57BL/6 strains.12) Isoflurane was used as this was shown to have the least effect on cardiac physiology in previous studies.12) Heart rates less than 300 bpm are typically indicative of severe respiratory and cardiac depression, at which point anesthesia was stopped.7) Heart rates greater than 500 bpm may indicate inadequate anesthesia. As with all anesthetics, isoflurane also decreases body temperature;1314)15) therefore a warming table is used to maintain core body temperature of 37℃.
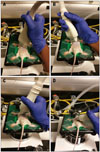
The transducer probe was positioned on the mouse chest wall for imaging acquisition either by hand or by the use of a rail system. The advantages of handheld transducer probe imaging include speed and fine adjustments in changing the viewing angle (Fig. 1). The disadvantages of performing echocardiography holding the transducer probe are significantly longer training period to ensure reliable technique and reproducible imaging. The rail system requires less training and enhances reproducibility of imaging, therefore can be effectively utilized.
Our echocardiography protocol for assessing the right heart in mice is derived from contemporary clinical imaging guidelines written by the American Society of Echocardiography, endorsed by the European Association of Echocardiography, a registered branch of the European Society of Cardiology and the Canadian Society of Echocardiography.9)
Practical guide to image the right heart and pulmonary vessels
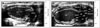
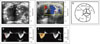
As shown in Fig. 1A, the parasternal long axis (PLAX) view is obtained by placing the mouse in the supine position, orienting the probe along the diagonal axis from the right forepaw to the left lower abdominal area and placing the transducer in vertical fashion, with the notch pointing towards the animal's head. Transducer is rotated by approximately 30–40° counter-clockwise (Fig. 1A). From the standard PLAX view (Fig. 2A), the pulmonary artery (PA) appears into the view on shifting the probe slightly to the left side of the mouse (Fig. 1B). In this modified PLAX view, or parasternal long-axis of the right ventricular outflow tract (RVOT), visualization of the proximal RVOT (PRVOT), pulmonic valve (PV) and PA is achieved (Fig. 2B).
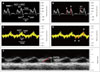
From the PLAX view, the probe is rotated 90 degrees clockwise into the parasternal short axis (PSAX) view (Fig. 1C). From this standard PSAX view, the transducer is shifted cranially, to the level of the aortic valve (AV), which appeard in the center of the image (Fig. 3A and C). Using color Doppler, flow turbulence and flow direction is assessed (Fig. 3B). Using pulse wave (PW) Doppler mode at the level of the AV (plane of leaflet coaptation), the PA flow is assessed using PW Doppler mode. This view allows measurements of PA acceleration time (PAT), pulmonary ejection time (PET) (Fig. 3D), pulmonary velocity time integral and peak pulmonary flow velocity (Fig. 3E).
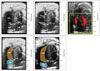
For the apical view, the probe is placed at a relatively flat angle towards the head from the lower thorax, with the base of the probe towards the operator (Fig. 1D). The apical four chamber view is used to visualize the RV and LV, with the atria at the bottom of the screen (Fig. 4). Due to the globular shape of the mouse heart, it is typically difficult to obtain all four chambers of the heart in one view therefore it is recommended to obtain a dedicated separate view of the right side of the heart by angling the probe, focusing on obtaining an accurate view of the RV and right atrium (RA), at the expense of the LV and left atrium. From the apical view, B-mode, M-mode, color Doppler, and PW Doppler are recorded for the tricuspid valve (TV) and analysis of flows across the TV. For RV function assessment, tissue Doppler-derived tricuspid lateral annular systolic velocity (S') and M-mode-derived tricuspid annular plane systolic excursion (TAPSE) were readily obtained from the apical 4-chamber view in mice directing the Doppler beam through the lateral annulus of the TV plane (Fig. 5D and E).
Measurements, calculations, and statistical analysis
All measurements and calculations were made using the Vevo® 2100 Imaging System (FUJIFILM VisualSonics Inc., Toronto, Canada). Results are provided as a mean ± standard deviation of the mean for 11 CD1 mice and 15 C57BL/6 mice that received anesthesia with room air, and for 7 CD1 mice and 11 C57BL/6 mice that received supplemental oxygen, except for the functional parameters noted. Data was analyzed using IBM SPSS Statistics software (IBM, Armonk, NY, USA), with two-tailed Student's t test being utilized to compare means for statistical significance.
Results
Right heart dimensions
Even with advance technology and imaging tools, RV structure and functional assessments of both humans and animal models are challenging to evaluate non-invasively primarily due to the unusual crescent shape and positioning.9) As per our knowledge, no standardized protocols or guidelines exist for assessing the RV morphology, RV function or PA pressures in mice. The lack of standardized protocols is partly due to the technical difficulty of visually assessing the right heart via both B-mode and M-mode.
In humans, RV function has been more fully evaluated with contemporary published guidelines, and RIMP, TAPSE, two-dimensional (2D) FAC and S' of the tricuspid annulus have demonstrated the most clinical utility and value.9) Based on these clinical guidelines, we demonstrate that similarly useful images can now be obtained in two different strains of mice, CD1 and C57BL/6, and assessing RV size and function is possible in most mice.
As shown in the Fig. 2, 3, and 4 and Table 1, RV size is measured using B-mode in three different views: the PLAX view, the PSAX view and the RV-focused apical 4-chamber view. In the PLAX view (Fig. 2A), RV size is measured using the PRVOT diameter. In the PSAX view (Fig. 3A), the PRVOT, distal RVOT and PA diameter are imaged and measured at end-diastole. The PRVOT 2D measurements in both these views are the same as expected and shown in the Table 1. Approximating the PRVOT measurements in these two views can also help obtain appropriate 2D views. In the RV-focused apical 4-chamber view (Fig. 4A and B), the following 3 RV measurements are obtained: the longitudinal RV basal and RV mid cavity dimensions. In addition, the right atrial area is measured in the RV-focused apical 4-chamber view (Fig. 4D and E). RV free wall thickness is measured at end diastole in the RV-focused apical 4-chamber view in this study, but can also be assessed from the modified PLAX as well.
In the age-matched CD1 and C57BL/6 mice, there was a significant difference in the net body weight. Right heart anatomical measurements revealed a larger RV in terms of length, diameter at the base as well as mid-cavity, proximal and distal RVOT in CD1 mice. RV free wall thickness as well as RA area showed no significant differences in the two strains. CD1 mice also had PA that was larger by diameter as compared to the C57BL/6 mice. All the standard anatomical measurements for both the strains are listed in the Table 1.
Right heart systolic function
The assessment of the right heart, including the RV, is difficult to analyze due to RV morphology and location. Majority of the RV functions are addressed qualitatively making it difficult to interpret in the disease models. After establishing the right heart dimensions, we measure right heart systolic function using the following parameters: RIMP (by pulsed and tissue Doppler), TAPSE, S', and FAC. These parameters are also utilized in clinical evaluations.
RIMP, also known as Tei index of RV, is a global assessment of both systolic and diastolic RV function. It is defined as the ratio of isovolumetric time divided by the ejection time (ET) of the RV.9) We have calculated RIMP using the following parameters: isovolumetric contraction (IVCT), isovolumetric relaxation time (IVRT) and ET, incorporated in equation 2.
We used both PW Doppler and tissue Doppler methods to calculate RIMP (Fig. 5A, B, and C). PW Doppler derived RIMP requires measurements in two different views; therefore similar R-R intervals were selected for measurements. Tissue Doppler derived RIMP was calculated from a single view (Fig. 5C). Major advantages of the RIMP are that it is easily obtainable and interpretable in the context of an often poorly visualized RV. We would like to point that RIMP should rarely be used as an isolated measure of RV function. Its main limitations are in irregular rhythms, in which the IVCT and RV ET are not constant, and in cases where RA pressure is elevated.9) Of note, similar to many of the values shown in this paper, the Tei index has only been validated for the LV in mice16) and not for the RV (RIMP). As shown in Table 2, there were no significance differences between RIMP estimated by either PW or tissue Doppler in both CD1 and C57BL/6 mice. Interestingly, the RIMP values calculated using PW and tissue Doppler for both strains of mice were approximately 0.4, similar to the mean values in humans.9)
To measure RV longitudinal systolic function we obtained TAPSE from the RV-focused apical 4-chamber view (Fig. 5E). TAPSE has shown good correlation with techniques estimating RV global systolic function in humans. In CD1 and C57BL/6 mice there were no significance differences and TAPSE for both strains was around ~1.0 mm. In addition, we also measured the tricuspid lateral annular S' using tissue Doppler. S' is easy to measure, reliable, and reproducible as a measure of the basal RV systolic function. In CD1 and C57BL/6, S' were 31.6 ± 8.3 mm/s and 32.1 mm/s, respectively. Any significant decrease in S' (from ~30 mm/s) could indicate RV systolic dysfunction. Another important parameter, 2D RV FAC, was also measured in both strains of mice. 2D RV FAC provides an estimate of RV systolic function and in humans; this measurement has more clinical value than right ventricular ejection fraction (RVEF).9) We measured the 2D RV FAC from a RV-focused apical 4-chamber view (Fig. 4D and E). The apex and lateral wall segments were clearly visualized and the trabeculations were excluded while tracing the area of the RV during end-systole and end-diastole. The 2D RV FAC for CD1 and C57BL/6 mice were found to be 33.4 ± 9.0% and 33.6 ± 9.1%, respectively.
Right heart diastolic function
RV diastolic function was assessed using PW Doppler of the trans-tricuspid flow, including the peak early filling (E) wave, the late diastolic filling (A) wave, the ratio of E/A wave velocities and the deceleration time (DT) of early filling velocity. As shown in Table 3, these TV inflow parameters were statistically similar in both strains of mice. However, as previous groups have reported,7)17)18) we found the assessment of TV inflow technically challenging and not possible in some of the mice, due to anatomic constraints and/or elevated heart rates. Similar to these prior reports, we were unable to assess several parameters in some of the mice due to either the inability to visualize the TV inflow Doppler envelope or partial fusion of the E and A waves, which precluded accurate assessment of the DT. Similar to assessment of RV diastolic function in humans, it can also be assessed in mice (and other small animals) by tissue Doppler of the lateral tricuspid annulus (E'). Several previous study found that in adult mice, the E/A ratio for Doppler flow across the TV are typically less than one.7)17)19) Egemnazarov et al recently showed that E' and IVRT are useful in assessing RV dysfunction and both parameters correlate well with enddiastolic pressure;18) a marker of diastolic dysfunction.20) As shown in Table 3, we measured IVRT (pulsed and tissue Doppler) and E/E' ratio and found no difference between CD1 and C57BL/6 mice.
Pulmonary Artery Hemodynamics
Adequate characterization of PA hemodynamic data is integral to a complete assessment of the right heart, and was performed using pulsed Doppler of the pulmonic valve in the PSAX view at the level of the AV. In human echocardiography estimates of PA pressures are collected via assessment of both pulmonic and tricuspid regurgitation flow velocities. Typically in the murine model these regurgitant jets are not found, however, and we have used other surrogate hemodynamic parameters in place of the standard PA pressure estimations. PAT, or the time from the initial onset of PA velocity to peak PA velocity, as well as the PET, or the total duration of flow through the PV, have been used as an alternative to PA pressure estimates in the assessment of pulmonary hypertension (PH). In Table 4 we report no significant difference in the PAT between the two strains observed, although the PET is prolonged in CD1 strains. PAT values that occur earlier in systole, and shorter PAT:PET ratios have been shown to correlate well with elevated RV systolic pressures (p = 0.01).21) Given that our initial results were concerning for elevated PA pressures compared to data published by Thibault, we repeated this series of studies with the use of supplemental oxygen to determine if our results were due to relative hypoxia. However, as shown in Tables 5 and 6, no significant difference was observed between the PAT or PET of mice that were anesthetized using isoflurane mixed with either room air or 95% oxygen (v/v).21)
Discussion
Many research studies in mice are performed and published using rudimentary and often inaccurate basic systolic functional assessments of the RV such as 2D RVEF, without any other parameter considered or measured. The unusual crescent shape of the RV poses added complexity to chamber size quantification and functional assessment. Measurements derived in one plane of view often do not accurately assess RV chamber size, morphology or function. This article aims to outline echocardiographic views and parameters in mice that are similar to the standardized views defined by contemporary clinical guidelines.9)
There is significant variability in the reported anatomical and physiological assessments of the RV and pulmonary hemodynamics in mice.6) The murine model poses several challenges to echocardiographic imaging, such as small size and relatively high heart rate.4)5)6) However, with the current imaging technology, many significant measurements and calculations can be made and meaningful data can be obtained. Here we have presented an outline of our echocardiographic imaging protocol as well as mean values in two strains of commonly used wild type mice.
The evaluation of tricuspid inflow by pulse Doppler in mice presents a significant challenge due to the anatomical shape of the heart, the orientation of the heart within the thoracic cavity and the relatively rapid heart rate. Measurements should ideally be made from the apical 4-chamber view or the subcostal view. Given the globular shape of the mouse heart, both apical and subcostal views may not clearly show the tricuspid valve and often underestimate peak E and A velocities. In such cases where the TV is not clearly observed with these views, a tricuspid jet can often be visualized in the modified short axis view at the level of the aortic valve. When distinct E and A peaks are identified, E/A ratios are typically less than 1, and our own results of peak E and A velocities are in agreement with previous literature.7)17)19) Consistent with established literature, in some animals it is difficult to clearly differentiate E and A waves due to fusion of these wave complexes in some animals due to excessively high heart rates.7)17) In our study, out of 26 total animals surveyed, 12 demonstrated fusion of the E and A peaks. Notably, there is a significant difference in the heart rate of those mice which displayed fusion compared to those mice that did not have fusion (449.7 ± 52.7 beats/min vs. 396.1 ± 60.1 beats/min, p = 0.03). Unlike previous reports7) stating that fusion can be a problem at heart rates of greater than 600 beats/min, we found that fusion can occur at lower heart rates as well. Therefore, for meaningful evaluation a larger sample size is recommended.
Unlike in humans, murine models of PH do not typically develop tricuspid regurgitation and pulmonary pressures need to be estimated using PA hemodynamics, such as PAT.21) In Table 4 we report no significant difference in the PAT between the two strains observed, although the PET is somewhat prolonged in CD1 strains. PAT values that occur earlier in systole, and shorter PAT:PET ratios have been shown to correlate well with elevated RV systolic pressures.14) Of note, there are many other parameters used in the echocardiographic evaluation of pulmonary hypertension in clinical studies as well as preclinical models. We have selected the parameters which provided relevant parameters in evaluating preclinical mouse models. However, we suspect there will be other measurements and parameters that should be considered in the future and needs evaluation. For example, though we have not been able to reliably assess hepatic vein flow patterns and inferior vena cava size and collapsibility, we do not necessarily feel that these parameters will not be used in future studies.
Limitations
Because of known variability in the genetic and phenotypic characteristics of specific mouse models,6)22) we only provide normal values for two strains of mice. Although three-dimensional (3D) RV ejection fraction seems to be more reliable with fewer reproducibility errors, there are insufficient data demonstrating its clinical value at present.
Future studies
Future work should outline the mean values and confidence intervals of these measurements in wild type mice.
Echocardiography is continually evolving with higher resolution imaging techniques rapidly developing. Two new modalities which we have not discussed here include the use of strain imaging and the use of 3D echocardiography.
Strain analysis at its core refers to changes in myocardial contraction, and the rate of contraction. Unlike traditional echocardiography strain analysis uses two points of myocardial tissue as reference points, rather than one point of myocardial tissue. This is useful in analyzing the more complex aspects of myocardial motion and contraction by allowing the characterization of 3D forces that affect the heart. Another advantage of strain analysis is that it can be done retrospectively on images that have previously been acquired.
3D echocardiography allows for the advanced imaging of cardiac structure and tissue, giving better definition to poorly visualized structures and also allowing for more in depth interpretation of cardiac wall motion and ejection fraction. Currently, its role in echocardiography has not yet been well defined.


 XML Download