

 PDF
PDF ePub
ePub Citation
 Print
Print


Introduction
Dobutamine stress echocardiography (DSE) is a well-established method for detecting myocardial ischemia. The classic echocardiographic findings of ischemia are new or worsening abnormalities of radial wall thickening.1) However, interpretation
of these findings is subjective and dependent on experience.2)3) Although speckle tracking strain imaging (STI) has been introduced as a novel method to overcome these limitations,1)4) wider application of STI in clinical practice has been constrained by technical problems such as image quality, frame rate5) and signal to noise ratio.6) In fact, the technical problem may be particularly questioned at peak-dose dobutamine.
Myocardial stunning occurs after dobutamine or exercise induced ischemia.7)8) Due to the ischemic cascade, persistent wall motion abnormalities (WMA) after ischemic insults are observed for a duration beyond the resolution of chest pain or electrocardiographic change.8) However, little is known about whether persistence of induced ischemia during the recovery period after DSE helps in the detection of significant coronary artery disease (CAD). Thus, the goal of this study was to investigate whether assessment of myocardial deformation using STI during the recovery period after DSE allows for detection of CAD in patients with chest discomfort.
Methods
Study population
Fifty-five consecutive patients with chest discomfort who underwent DSE and coronary angiography from October 2011 to December 2012 were recruited. Patients with acute coronary syndrome, WMA at rest or previous myocardial infarction, previous cardiac surgery, artificial pacemaker, non-sinus rhythm such as atrial fibrillation, valvular heart disease of greater than moderate grade, systolic dysfunction less than left ventricular (LV) ejection fraction (EF) < 40% and systemic diseases including chronic obstructive pulmonary disease, renal failure and hepatic failure were excluded from the study. Eleven patients were excluded from the analysis, including six patients with inadequate ultrasound images and five patients with WMA at rest. The remaining 44 patients [age, 65 ± 9 years; 23 men (52%)] were ultimately enrolled in this study. All patients gave written informed consent before undergoing DSE. This study was approved by the hospital ethics committees (IRB 2011-069).
Dobutamine stress echocardiography
Dobutamine stress and image acquisition
All patients underwent DSE using a standard protocol9) with an incremental dobutamine infusion rate of 5, 10, 20, 30, and 40 µg/kg/min every 3 minutes and up to 1 mg of atropine if the target heart rate (85% of the age-predicted maximal heart rate) was not achieved. Heart rate, blood pressure, 12-lead electrocardiography and symptoms during DSE were recorded at each DSE stage. Beta-blockers and calcium channel blockers (non-dihydropyridines) were discontinued at least two days prior to the test. Criteria for terminating the test were completion of the protocol, development of new WMA, severe chest pain, systolic blood pressure (SBP) > 220 mmHg or diastolic blood pressure (DBP) > 120 mmHg, symptomatic hypotension and serious ventricular or supraventricular arrhythmias. The examinations were performed in the left supine position with a Vivid E9 scanner (GE Vingmed Ultrasound, Horten, Norway). Complete 2-dimensional, color, pulsed, and continuous wave Doppler echocardiography were performed at rest according to standard techniques.10)11) Two cine loops from the apical 4-, 3-, and 2-chamber views were acquired for assessment of myocardial deformation in the end-expiratory holding state at rest, after dobutamine infusion at a rate of 10 µg/kg/min (low stress) and 5 min after cessation of dobutamine infusion (recovery), respectively. The 2-dimensional frame rates ranged between 50/s and 80/s. All images were digitally stored on hard discs for offline analysis (EchoPAC SW version 6.0.0, GE Vingmed Ultrasound AS).
Analysis of conventional echocardiography and speckle tracking imaging
Wall motion analyses12) were assessed using a 17 myocardial segment model at each DSE stage by one experienced reader who was blinded to all patient data.
The mean global longitudinal peak systolic strain (GLS) was quantified at rest, low stress and recovery of DSE using automated function imaging, which is an imaging technique based on STI.13) The values of GLS were assessed by an additional interpreter without information about clinical characteristics, DSE and coronary angiography (CAG) results. All data were exported to a spread-sheet (Microsoft excel 2002, Microsoft Corporation, Redmond, WA, USA).
Coronary angiography and fractional flow reserve
CAG was performed in all patients within 9.7 ± 23.9 days from DSE according to standard techniques. Angiographic results were analyzed by an experienced observer. Fractional flow reserve (FFR) with an intracoronary pressure guide wire (Certus Wire, Radi Medical Systems, Uppsala, Sweden) was also performed in the intermediate coronary artery lesion (30-70% diameter stenosis).14) At this time, intravenous adenosine infusion (140 µg/kg/min) was used to achieve a maximal steady state of hyperemia.15) Significant coronary stenosis was defined as having a ≥ 70% diameter stenosis as determined by computer-assisted quantitative CAG using multiple planes (QCA Quantcor, Siemens, Forchheim, Germany) or FFR < 0.8.16) Patients with these findings were assigned to the CAD (+) group.
Statistical analysis
Statistical analyses were performed using SPSS for Windows, version 15.0 (SPSS Inc., Chicago, IL, USA). Continuous variables were expressed as the mean ± standard deviations and were compared using an independent Student t test. Categorical variables were expressed as group percentages and were compared using the χ2 test. The intra-observer variability for values of GLS on Bland-Altman analysis was tested in 10 patients and the coefficient of variability was 4.8% at rest, 5.8% at low stress and 5.9% at recovery.17) Regression analysis was performed to assess whether values of GLS is independently associated with presence of CAD. The optimal GLS cutoff values for detecting CAD at each DSE stage were determined from receiver operating characteristic (ROC) curves. The area under the ROC curve (AUC) was used to compare the diagnostic validity, and a z-score was calculated to determine the difference of AUCs.18) Statistical significance was considered to be a p value of less than 0.05.
Results
Patient characteristics
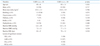
Fifteen patients with a finding of greater than 70% diameter stenosis on CAG were included in the CAD (+) group. Three patients with intermediate CAD were also included in the CAD (+) group after FFR analysis. The remaining 26 patients were classified into the CAD (-) group. The baseline clinical characteristics and lesions of significant stenosis are summarized in Table 1. Clinical characteristics including age, sex, risk factors, SBP, and DBP were not different between the two groups.
In the CAD (+) group, a significant stenosis was present in the left main artery in five patients (28%), in the left anterior descending artery in 12 patients (67%), in the left circumflex artery in eight patients (44%) and in the right coronary artery in four patients (22%). Eleven patients (61%) had single vessel disease, five (28%) had two vessel disease and two (11%) had three vessel disease.
The conventional echocardiographic findings are summarized in Table 2. LV thickness, LV size, left atrial size, LVEF, and several diastolic indices were not different between the two groups.
Hemodynamics and wall motion analysis
Target heart rate during DSE was achieved in 37 patients (84%). In the remaining seven patients, DSE was terminated due to ischemic signs in five patients, symptomatic hypotension in one patient and an inability to achieve the target heart rate despite dobutamine and atropine administration in one patient.
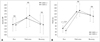
Neither group differed significantly with respect to SBP and DBP at any DSE stage (Fig. 1). At rest, patients with CAD significantly had higher heart rates than patients without CAD (Table 1, Fig. 1). However, there were no significant differences in heart rates at peak stress and recovery between the two groups (Fig. 1).
Visual wall motion assessment was successfully performed on all patients at each DSE stage. WMA were observed in four patients (15.4%) in the CAD (-) group and in 13 patients (72%) in the CAD (+) group. The sensitivity and specificity of WMA for CAD were 72.2% and 70.6%, respectively (Table 3). WMA were normalized at recovery of DSE except in one patient with two vessel disease.
Quantitative global longitudinal peak systolic strain and accuracy
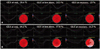
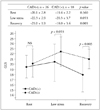
Data are exemplified in Fig. 2 and summarized in Fig. 3. In patients without CAD, the values of GLS significantly increased at low stress compared with those at rest (p < 0.001), and then decreased at recovery (p < 0.001 in comparison with low stress, p = 0.107 in comparison with rest). On the other hand, the values of GLS in patients with CAD slightly increased at low stress (p = 0.055 in comparison with rest) and then significantly decreased at recovery (p = 0.002 in comparison with low stress, p = 0.046 in comparison with rest). Both groups were not significantly different in the values of GLS at rest and at low stress. On the other hand, patients with CAD significantly had lower value of GLS at recovery than patients without CAD (Fig. 3).
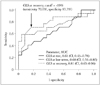
Upon ROC analysis (Fig. 4), the values of GLS at recovery significantly had greater AUCs than the values of GLS at rest (z statistic = 2.20, p = 0.028). However, these values were not greater than the values of GLS at low stress (z statistic = 1.12, p = 0.264). The optimal cutoff value of GLS at recovery for prediction of CAD was -19%, which resulted in a sensitivity and specificity of 70.6% and 83.3%, respectively. The sensitivity, specificity and positive and negative predictive values between visual WMA at peak stress and the quantitative GLS technique at recovery were similar (Table 3). Low value of GLS at recovery was associated with presence of CAD after adjusted with age, sex, hypertension, and diabetes (data not shown).
Discussion
Because conventional interpretation of DSE is often subjective and highly dependent on experience,2)3) quantification of LV function by STI is utilized to obtain an objective assessment. However, it has not been used commercially for several reasons such as the difficulty in achieving quality image acquisition with a high frame rate and in maintaining respiratory holding during imaging saving, and the fact the post-processing steps required for analysis are time consuming.1)5)6) Assessment of STI at peak stress of DSE is especially difficult because of an inadequate low frame rate for the rapid heart rate, failure to maintain respiratory holding in symptomatic patients, subsequent tracking problems and the development of signal to noise due to hyperdynamic LV contractility and excessive annular motion.19)20) On the other hand, assessment of STI at recovery is easier because of the ease of respiratory control due to improvement in symptoms, lower heart rate and decreased myocardial hyper-contractility. Owing to the development of tool that allow for better measurement, several recent works8)21) have shown that transient ischemic injury after DSE persists much longer than previously thought. Tsoukas et al.8) showed that delayed recovery of WMA after DSE occurs after the resolution of symptoms and electrocardiographic changes and can persist for at least 5 minutes in 90% of patients. Ishii et al.21) demonstrated that post-ischemic diastolic stunning after complete systolic functional recovery can persist for more than 24 hour after reperfusion. Likewise, we showed that the values of GLS at recovery after DSE may be a good marker for the detection of CAD, as well as newly developed WMA at peak stress. Furthermore, comparison of their respective diagnostic accuracies showed that the values of GLS at recovery were comparable with the expert wall motion analysis at peak stress (Table 3). On the other hand, WMA was normalized within 5 min after DSE in all patients with one exception. In this patient, WMA persisted for 15 min.
The amplitude cutoffs of GLS for the prediction of CAD at rest and at low stress are rather low (Fig. 4). This may be due to individual differences in the contractile state at rest and in the chronotropic response to dobutamine at low stress. In fact, comorbidities such as male, hypertension and diabetes are associated with low global strain regardless of myocardial ischemia.22)23)24) Additionally, low dose dobutamine infusion is associated with insufficient sensitivity.1)
In this study, the sensitivity of newly developed WMA at peak stress for detection of CAD was slightly lower than in earlier studies,2)3)25) in which an average sensitivity of > 80% was reported. However, using a similar patient cohort as utilized in our study, Ingul et al.26) showed a similar sensitivity of developed WMA at peak stress. In fact, the accuracy of developed WMA at peak stress is known to be greater in patients with ischemia in the left anterior descending artery than in patients with ischemia in the left circumflex artery or right coronary artery, and also in the multi-vessel disease cases than in the single vessel disease cases.1)
This study has some limitations. First, we did not analyze strain rate. In fact, the noise in the strain rate signal increased with higher heart rates and the image quality decreased.27) Second, we only showed global longitudinal strain analysis using an automatic functional imaging method. Although automatic functional imaging based on the speckle tracking method is less time consuming and feasible, objective assessment of regional myocardial function is still incomplete.26) And, in earlier studies,19)28)29) longitudinal strain had a higher diagnostic accuracy for detection of CAD than circumferential or radial strain. This is likely due to the fact that longitudinal strain is primarily determined by subendocardial fibers vulnerable to ischemia and from the LV base to apex and has higher reproducibility and correlation with sonomicrometry.21) Third, the combination of expert wall motion analysis and the values of GLS did not have higher diagnostic accuracy than either the wall motion analysis or the values of GLS individually (data not shown). Therefore, the values of GLS at recovery may be more useful to an inexperienced interpreter of wall motion analysis than to an expert. The fourth limitation is that this was a study of relatively small sample size. Therefore, we could not estimate that the value of GLS at recovery has a different accuracy according to CAD lesions in the prediction of CAD.
In conclusion, assessment of GLS at recovery of DSE might be a reliable and objective method for detection of significant CAD. This finding may suggest that systolic stunning after a transient ischemic event persists and that assessment by GLS during the recovery period allows this phenomenon to be objectively and quantitatively assessed.


 XML Download