

 PDF
PDF ePub
ePub Citation
 Print
Print


Introduction
Agitated saline contrast has been used several decades for the detection of right to left shunts and for the enhancement of Doppler signals for right-sided valves (e.g., tricuspid regurgitation). The gas bubbles that are formed by hand agitations of saline or saline-blood mixtures are composed of non-encapsulated nitrogen and oxygen entrained from ambient air and are too short-lived to serve any purpose for opacifying the left sided cardiac chambers. Accordingly, the field of contrast echocardiography with more stable ultrasound contrast agents was developed with the overall goal of opacification the entire blood pool. As we will discuss in this review, microbubble stability and safety has been accomplished by the production of microbubbles that are composed of inert and safe high molecular weight gases which are less diffusible than oxygen and nitrogen; and are encapsulated with protein, biopolymers, or lipids which reduce surface tension and control size distribution within the optimal range for trans-capillary transit.1) With these agents, it has been possible to produce ultrasound opacification of the entire blood pool, including the left atrium and ventricle and myocardial microcirculation, with intravenous administration. The production of stable microbubble contrast materials with controlled size distribution has not been the only technical advance that has been required for clinical adoption of this technology. Ultrasound imaging schemes that specifically detect the signals that return from the microbubbles and that do not produce acoustic destruction of the microbubble agents (inertial cavitation) have also been key to the widespread use of contrast echocardiography in specific patient settings. This review is intended to provide imaging specialists with practical knowledge on the technical components, procedural details, and clinical applications for contrast echocardiography.
Overview of Applications for Contrast Echocardiography
Left ventricular opacification
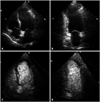
The accurate assessment of left ventricular (LV) dimensions (diameters and volumes) and both regional and segmental wall motion requires detection of endocardial borders. Despite rapid developments in ultrasound technology, echocardiographic imaging is still limited up to 20% of patients due to physical factors such as obesity and chronic lung disease. Increasingly, echo is being used to guide therapy in critically ill patients who may have barriers to high quality echocardiographic images due to mechanical ventilation, surgical dressings, and inability to position the patient appropriately. The ability to produced left ventricular cavity opacification (LVO) with contrast echocardiography provides a valuable option for improving endocardial border resolution in these patients (Fig. 1).1)
The purpose of LVO is to produce an image that has homogeneous opacification of the entire LV cavity against the darker myocardium. Therefore, LVO is generally performed using just enough microbubbles to produce full opacification of the LV cavity without attenuation (shadowing of far field structures from high microbubble concentration in the near field), and using low to medium acoustic powers which minimize microbubble destruction. By more clearly defining the endocardial surfaces, LVO has been shown to improve the both the accuracy and reproducibility in assessment of LV volumes and left ventricular ejection fraction.2)3) The importance of this role is underscored by the increasing clinical use of volumes and LV ejection fraction to help guide important treatment decisions such as the implantation of a defibrillator or bi-ventricular pacemaker, or the timing of valve surgery. The use of LVO for better defining LV dimensions or function has predictably been shown to be higher in those who have lower quality non-contrast images.4) However, the use of contrast echocardiography for LVO has been shown in certain populations to provide incremental value irrespective of the baseline study. These populations include patients hospitalized in an intensive care unit who generally have poorer quality images as a modifying factor, and patients receiving cardiotoxic chemotherapies in whom serial assessment of LV function is used to guide therapy.4)5)6)7) In these populations in particular, the use of contrast has also been shown to reduce overall costs by avoiding the need for other more expensive methods for assessing LV function.5)8)
LVO is also playing an increasing role in the practice of stress echocardiography. The use of microbubble contrast has been shown to increase the number of interpretable myocardial segments at rest and during stress.9)10) Because it is often difficult to predict which patients will have a deterioration in image quality during stress from hyperventilation and increase in cardiac translation, lower threshold for use of contrast in stress echocardiography has been advocated by some.
Contrast echocardiography has also been used in several niche applications of where LVO is critically important. It is quite useful for evaluating for the presence of intracavitary masses or thrombi and for detecting ventricular pseudoaneurysm.11)12) In particular, LVO can play a role in better defining pathology at the LV apex where image quality is often reduced because near field artifact caused by rib reverberation or because of lack of distance for harmonic signal generation. For this reason, LVO has been shown to provide useful information for detecting or excluding apical hypertrophic cardiomyopathy, non-compaction cardiomyopathy, and eosinophilic cardiomyopathy.13)14)15)
Myocardial perfusion imaging in coronary artery disease
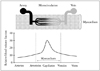
Myocardial contrast echocardiography (MCE) refers to the detection of contrast material present within the myocardial microcirculation. In the absence of any kinetic information, the degree of contrast enhancement is proportional to the relative microvascular blood volume which is the fraction of the LV mass that is attributable to actively perfused intramuscular vasculature. In order to quantify this signal, one needs to either subtract myocardial signal (pre-contrast) from the contrast-enhanced signal or to employ contrast-specific imaging techniques that eliminate tissue signal through frequency filtering and/or multipulse correlation/decorrelation techniques. In general, MCE is performed with slightly higher contrast doses than LVO due to the need to opacify myocardial tissue which is only approximately 5-10% blood volume. The volume of blood in the coronary vascular bed is distributed almost equally between the arterial system, the microcirculation, and the venous system (Fig. 2).16) However, most of the arterial and venous blood volume are located at the epicardium. Hence, the microcirculation represents the majority of the intramyocardial myocardial blood volume, of which approximately 80% at rest is contained within the capillary compartment. Thus, myocardial contrast enhancement represents the primarily the capillary blood volume.17)
The most common application of MCE is to quantify myocardial tissue perfusion in ischemic heart disease. There are situations where a simple binary "yes or no" answer to the question of perfusion is sufficient. An example is when MCE is used to assess whether reperfusion therapy for myocardial infarction has been successful at restoring blood flow to the myocardium. For evaluating myocardial viability, one needs to only spatially assess the presence or absence of an intact microvasculature which can be done by examining microvascular blood volume which is described in a later section. In patients with known coronary artery disease (CAD), MCE can also provide information on myocardial viability either early after infarction or in those with chronic ischemic LV dysfunction.18)19)20) Improvements in MCE imaging technology now allow for the assessment of transmurality of infarction which correlates well with delayed gadolinium enhancement on magnetic resonance imaging.21)
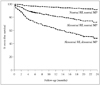
For most other situations such as the detection of ischemia at rest or during stress, assessment of myocardial microvascular blood flow is required. This measurement involves the assessment of both microvascular blood volume and the transit rate of contrast through the myocardium. Because MCE can be performed rapidly at the bedside and provides information immediately to the healthcare team, it has been used to diagnose or exclude acute myocardial infarction in patients with suspected acute coronary syndrome.22)23) In these patients, the addition of perfusion to wall motion improves diagnostic accuracy (particularly in those with left bundle branch block or other reasons for LV dysfunction) and also provides incremental information to wall motion on prognosis by discriminating patients with ongoing ischemia (reduced flow and function) from those with stunning who have had spontaneous return of perfusion (Fig. 3).23) Although MCE is highly sensitive in detecting resting hypoperfusion, specificity can be detrimentally altered by attenuation artifacts particularly in basal segments and the lateral LV wall. In this situations, the addition of wall motion data can improve specificity (i.e., reduce false positives) since resting hypoperfusion should always be associated with abnormal LV function.
In those with known myocardial infarction, MCE can also provide important information on the size of the ischemic territory, the presence and amount of collateral blood flow, whether therapy for epicardial revascularization has been successful, and whether microvascular no-reflow is present.24)25)26)27)
There have been many clinical trials that have demonstrated that stress-rest MCE can be used with high diagnostic accuracy to detect CAD in those without active acute coronary syndrome or those presenting to the emergency department with unstable symptoms but no evidence for ongoing myocardial necrosis. These studies have generally compared vasodilator, exercise, or inotropic stress MCE with either other methods for detecting ischemia (e.g., SPECT radionuclide perfusion imaging, stress echo for wall motion) or with angiography.28)29)30)31)32) Unlike the flow-function relationship at rest, during stress wall motion may apparently normal in region with abnormal flow reserve due to moderate coronary stenosis.28)33) Accordingly, MCE during dobutamine and vasodilator stress has been shown to be more sensitive than wall motion alone at detecting ischemia, especially if workload achieved during stress is below target.28) MCE has also been shown to provide a better estimate of the territory of ischemia and to improve diagnosis of multivessel CAD.28)30)34)
Miscellaneous perfusion imaging applications
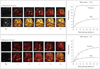
The ability of MCE to quantify microvascular perfusion has led to numerous other applications in cardiovascular disease. MCE with intra-arterial injection of contrast agent is considered vital for intraprocedural optimization of alcohol septal ablation by mapping the perfusion territory of the septal perforating vessel engaged.35) Echocardiographic perfusion imaging may also aid in the differentiation of cardiac masses by differentiation of thrombus from tumor, and for identification of high vascularized malignant masses such as angiosarcoma.36) Certain perfusion patterns can also be used to suggest the presence of stress cardiomyopathy (e.g., takotsubo cardiomyopathy), particularly if performed early in the process.37) In a related matter, quantitative MCE at rest and during vasodilator stress has been used as one of the few confirmative tests for microvascular dysfunction as the cause of angina symptoms in patients without epicardial arterial stenosis. The ability to assess skeletal muscle blood flow and flow reserve with contrast ultrasound is also currently being investigated as a method for assessing the presence and impact of peripheral artery disease (Fig. 4).38) The clinical need for such a technique is emphasized by increasing the prevalence of diabetes which results in more diffuse disease and co-existence of obstructive disease and microvascular dysfunction. Finally there are exciting potential future applications of contrast echocardiography that are reviewed elsewhere and which include molecular imaging and therapeutic applications such as sonothrombolysis.
Contrast Agents
The rationale for the use of microbubbles and other gas- or emulsion-containing nanoparticles as ultrasound contrast agents is based on their ability to undergo acoustic activation. With few exceptions, all of the clinical applications described above rely on the ability to inject microbubbles by intravenous route and have them remain intact and acoustically active after their pulmonary transit into the systemic circulation. This capability has relied on technical innovations to control microbubble size and stability. In order to pass unimpeded, microbubbles must be no larger than the pulmonary capillary bed (5-8 µm). An average microbubble diameter of < 5 µm also ensures recirculation of microbubbles through the systemic microvascular bed and is important for ensuring safety of the contrast agent.
Hand-agitated or sonicated unencapsulated air-filled microbubbles often result in too wide of a range of microbubble size and concentration to achieve any meaningful opacification after intravenous injection. Any microbubbles that are of small enough diameter to pass through the pulmonary bed undergo rapid and free diffusion of the gasses (nitrogen and oxygen) so that acoustic activity is quickly lost.
The intravascular stability of newer generation agents that produce systemic opacification has been markedly enhanced by modification of the microbubble shell and the gas core. Encapsulation of microbubbles with lipid, protein or biopolymer shells reduced outward diffusion of the gas through barrier function and by reducing microbubble surface tension. The use of gases that are less diffusible and soluble than air have also led to remarkable increases in bubble in vivo lifespan. These gases include perfluorocarbons (octofluoropropane, decafluorobutane) and sulfur hexafluoride. These gases are inert, safe, and have a high-molecular weight which reduces the diffusion coefficients and low aqueous phase solubility (low Ostwald coefficient). Any further improvements in the stability of ultrasound contrast agents through shell and/or gas composition must be weighed against potential detrimental effects on the viscoelastic properties and compressibility of the agent which are critical for signal generation.
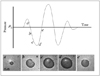
By virtue of being gas-filled and smaller than the ultrasound wavelength, microbubbles undergo radial oscillation which involves sequential compression and expansion in the alternating pressures of the ultrasound field (Fig. 5).39) Stable cavitation is a term that refers to the oscillation without significant loss of microbubble integrity whereas inertial cavitation refers to disruption of the microbubble caused by excessive oscillation. The latter event can result in the release of transient free microbubbles. Radial oscillation of either encapsulated or free microbubbles results in strong acoustic signals that can greatly exceed conventional ultrasound backscatter signals. The degree of oscillation is in turn dependent on the density of the gas core, material properties of the surrounding medium, the nature of the bubble shell, and ultrasound characteristics such as frequency and pressure amplitude. It is also important to note that microbubble destruction with inertial cavitation can reduce overall contrast signal, and yet is also a necessary component of quantitative perfusion imaging.
Many different commercially-produced stable microbubble contrast agents are now marketed worldwide (Table 1). The availability and indications for each agent are slightly different for each agent and each country. With regards to practical issues, most agents require refrigeration and some require either reconstitution of a lyophilized product or the use of specialized devices to activate the agent through controlled physical agitation. Most of these agents are stable for several hours after reconstitution or activation. Since microbubbles are sensitive to pressure, for many agents it is suggested that one uses venting techniques when withdrawing microbubbles from a vial so as not to expose them to low negative pressure, and to avoid high pressure injection (e.g., large volume through a small orifice I.V.). Contrast agents can be administered intravenously via either bolus or infusion methods. The advantage of bolus injection is the ease of use. However, bolus injection often produces far field attenuation from excessive blood pool concentration early after microbubble injection. Furthermore, quantitative assessment of perfusion is more difficult since microbubble concentration in the blood pool should be stable during all phases of multiplane assessment of signal intensity. Continuous venous infusion techniques are also often used. Although this approach requires longer for initial set up than bolus injection, it has advantages since imaging can be performed without having to cease imaging to give repetitive boluses and it results in a constant concentration of microbubbles in the blood pool during MCE perfusion imaging.17)40)41)
Imaging Methods
Contrast specific imaging
Contrast specific techniques have been developed for most echocardiography imaging systems currently on the market. Most of these algorithms rely on the signals that are produced by non-linear oscillation when microbubbles are exposed to ultrasound of a sufficient power and, in particular, near the ideal resonant frequency which is in turn determined by microbubble size and composition.36) A very basic but important advance has been to detect harmonic overtones produced by microbubbles which are multiples of the fundamental (transmit) frequency.42) This simple approach to improving contrast signal-to-noise is still often used for LVO studies. Various high-power contrast-specific ultrasound imaging techniques for tissue perfusion have been developed and are reviewed elsewhere.42)43)44)45) However, most laboratories rely on multipulse techniques that through pulse correlation methods serve to eliminate linear and some non-linear tissue responses and provide high microbubble signal-to-noise ratio at low mechanical index (MI; 0.1 to 0.2) without microbubble destruction. Pulse-inversion (or phase inversion) and power modulation imaging are examples of these low-power techniques and again are described elsewhere.46)47) Although these techniques have greatly facilitated routine use of MCE for perfusion imaging, they do have some drawbacks such as reduced frame rate owing to the need for multiple pulses, and motion (flash) artifacts that are seen especially during exercise or inotropic stress.
System optimization
Irrespective of the technique used to detect microbubble signal, certain principles must be kept in mind when performing contrast echocardiography. If real-time imaging is performed, then the MI must not be so high as to produce microbubble destruction. Generally for myocardial perfusion imaging an MI of 0.1 to 0.2 is used. For LVO, the MI can be a bit higher since microbubble concentration is quite high. Destruction on MCE will be manifest as low contrast signal which resolves when pauses are introduced between frames (e.g., activating an ECG triggered mode). Destruction on LVO studies will be manifest as swirling in the LV cavity, particularly at the apex when imaging in the apical views. Attention should also be paid to the location of the acoustic focus since excessive destruction at the LV apex can occur when the acoustic focus is in the far field. For MCE imaging, gain settings should optimally be set just before administration of contrast material in order to have the maximal gain without much tissue speckle. However, it is important to note that for LVO studies some tissue signal is beneficial since ventricular function is best assessed by myocardial thickening which requires not only discrimination of the endocardial surface which is highlighted by contrast but also the epicardium.
Myocardial perfusion imaging protocols
The degree of blood flow in the myocardium can be defined as the blood volume within the microcirculation which is moving at a certain flux rate through the tissue. Hence, blood flow at the myocardial capillary level can be increased or decreased through changes in functional capillary density and/or the velocity by which blood passes through the capillary bed. MCE protocols have been developed to measure perfusion through the parametric assessment of these two parameters.
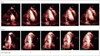
When the steady state concentration of microbubbles in the blood pool is constant and microbubbles are not being destroyed by ultrasound imaging, then the signal intensity from microbubbles in the tissue reflects the relative concentration of blood within the myocardium. If this signal is normalized to blood pool, the absolute microvascular blood volume (mL per gram of tissue) can be calculated provided that intensity in the blood pool has not reached dynamic range saturation. If one then destroys microbubbles through inertial cavitation, then the rate at which the signal reappears reflects microvascular flux rate of blood since microbubbles have a similar microvascular behaviour as erythrocytes.48) Generally, this kinetic information can be achieved by two different methods. The first approach is to use a high-power set of frames to destroy all microbubbles within the volume of the ultrasound sector. Low-power real-time imaging can then be used over the next five to fifteen cardiac cycles to image microbubble re-entry into the microcirculation (Fig. 6). In general, only end-systolic frames should be used for quantitative analysis since they contain the least signal from large intramyocardial vessels. If one does not need to evaluate wall motion in the same digital clip, then only end-systolic frames need to be acquired which can be achieved through ECG gating. A second method for measuring flux rate is to perform high MI imaging which simultaneously destroys and images microbubble signal, and to progressively prolong the interval between ultrasound frames. This high MI technique has the advantage of providing more robust signal enhancement and generates several frames for each interval which reduces noise; however, it requires more time and is much more difficult to perform due to the need to keep the transducer in a fixed position between static frames. The time (or pulsing interval) versus intensity relation can then be fit to a 1-exponential function in order to determine the rate constant of the curve, which represents microvascular flux rate, and the plateau intensity once the entire elevation is refilled which when normalized to blood pool represents blood volume.
Lab Policy
It is the key that all laboratories that perform contrast echocardiography must have quality assurance policies to ensure safety and make the greatest impact on improving study quality and accuracy. Ideally, the decision to use contrast should reside with the individual who is acquiring images, such as the sonographers. This workflow requires a lab policy on who should receive contrast and active feedback between sonographers and interpreting physicians. Institutional policies vary with regard to whether written consent is needed for ultrasound contrast. Hospital or clinic policy needs to also reflect who is able to administer contrast and what actions should be taken for any unexpected adverse reaction.
With regards to safety, studies have indicated that microbubbles are generally among the safest contrast agents that are used for non-invasive imaging. Just over one of every ten thousand patients receiving ultrasound contrast materials will have a serious cardiopulmonary reaction, most of which are probably attributable to non-IgE-related pseudoanaphylaxis. Because of this rare possibility, it is important the laboratory contains an emergency cart with appropriate therapy and appropriate laboratory personnel be trained in their use. The only major contraindications to the use of ultrasound contrast agents are previous hypersensitivity to the contrast agent or large intra-cardiac right-to-left shunts. Other contraindications that vary between agents include pregnancy, lactation, pulmonary hypertension, and severe hepatic diseases.
Conclusions
In summary, contrast echocardiography is now considered an essential component of any state-of-the-art echocardiography laboratory because of its ability to provide unique and/or more accurate information to the interpreter. There are particular situations and clinical questions where the use of contrast for LVO is particularly useful including stress echo, serial assessment of LV function, and the assessment for ventricular thrombi. While MCE perfusion imaging for assessment of CAD is not yet mainstream, there are still niche applications where the assessment of perfusion with microbubbles has a high impact. The optimization of contrast for any hospital or clinic requires unique knowledge of contrast-specific imaging protocols, knowledge of microbubble administration techniques, and a sound laboratory policy that promotes the use of microbubbles in a safe fashion in patients who are most likely to gain benefit.

 XML Download