

 PDF
PDF ePub
ePub Citation
 Print
Print


Introduction
Measurement of right ventricular (RV) systolic function is essential to the management of patients with acute pulmonary embolism (PE).1) The presence of RV systolic dysfunction is a major indication of thrombolytic therapy and a well-known prognostic marker in these patients.2)3) However, the assessment of RV systolic function is difficult for the complex RV shape.4) To overcome this difficulty, many imaging modalities, including cardiac magnetic resonance imaging, computerized tomography (CT) and RV radionuclide ventriculography, were used to estimate RV systolic function. Although many imaging methods can be used to evaluate RV systolic function, 2-dimensional echocardiography (2DE) is the most commonly and routinely used imaging method in the assessment of RV systolic function in acute PE.
Recently, newer 2-dimensional speckle-tracking echocardiography (2DSTE) has been introduced to the evaluation of RV systolic function.4)5) The 2DSTE is based on an analysis of the spatial dislocation of speckles on routine 2DE images. It can give us more angle-independent and multi-directional strain values than tissue Doppler based strain measurement.5) It can also provide non-geometric RV assessments like its evaluation of left ventricular (LV) function.6) Because the direction of RV muscle fibers runs predominantly longitudinally, the global longitudinal strain of RV (GLSRV) by 2DSTE can be a good indicator of RV systolic function.7)8) However, there are several different mechanisms in the measurement of myocardial mechanics. Velocity vector imaging (VVI: Siemens Medical Solutions, Mountain View, CA, USA) and EchoPAC PC software (EchoPAC: GE Medical Systems, Milwaukee, WI, USA) are the two most commonly used 2DSTE methods in the assessment of LV systolic function.9)10) Variations in strain measurement with different algorithms have limited the application of these techniques for the assessment of RV function. We sought to compare the two most commonly used methods (VVI and EchoPAC) for the assessment of RV systolic function in patients with acute PE.
Methods
Patient characteristics
We recruited consecutive patients with acute PE occurred between August 2007 and May 2011 in our PE cohort study.11) The diagnosis of PE was based on the findings of contrast-enhanced CT in patients with clinical suspicion of acute PE in the emergency room. Standard contrast-enhanced PE protocols were performed in patients without renal dysfunction using 16-slice (SOMATOM Sensation16, Siemens Medical Solutions, Milwaukee, WI, USA) multi-detector-row CT scanners with the acquisition of 1-mm sections of the entire chest. The diagnosis of PE was confirmed in the presence of at least one filling defect in the pulmonary arterial tree, including the subsegmental level. Patients with arrhythmias or inappropriate echocardiographic image quality were excluded from this study.
Echocardiographic examination
Transthoracic echocardiographic examinations with Doppler studies were performed using Vivid 7 or E9 (GE Vingmed, Horten, Norway) at the time of admission according to the guidelines and standard recommendations of the American Society of Echocardiography.12) The echocardiographic images of all subjects were obtained from the parasternal, low parasternal, and apical views, and all obtained views were stored digitally. The digitally stored echocardiographic images were retrieved and analyzed with off-line software. Conventional parameters of RV systolic function were measured in the manner which was described in the previously published paper.11) RV fractional area change (RVFAC) was calculated from the apical 4-chamber view using the percentage change in areas of the end-diastolic and end-systolic areas of the RV.12) Tricuspid annular plane systolic excursion (TAPSE) was measured as the distance of systolic movement of RV tricuspid annular segment along its longitudinal plane.12) RV myocardial performance (Tei) index was defined as the ratio of isovolumic relaxation time and isovolumic contraction time divided by ejection time of RV.12)
Pulmonary artery systolic pressure was estimated from the maximal continuous-wave Doppler velocity of the tricuspid regurgitation (TR) jet plus the estimated central venous pressure.12) An index of pulmonary vascular resistance was derived by dividing the maximal velocity of the TR jet by the RV outflow tract velocity-time integral.13) An average of 3 measurements was used.
GLSRV-VVI was measured with VVI software. After selection of the optimal beat of the stored image, the endocardial border of RV and interventricular septum was initially traced manually. RV endocardial borders were tracked throughout the cardiac cycle automatically and myocardial velocity was derived as the ratio between frame-to-frame displacement of the speckles and the time interval.14) If the tracing was insufficient, manual adjustment of the tracking was permitted. GLSRV-EchoPAC was analyzed using a speckle-tracking algorithm with EchoPAC PC software.15) After retrieving the optimal image, the endocardial border of the RV was traced on an end-diastolic frame and region of interest was adjusted to the thickness of the RV. The software tracked the contour on subsequent frames automatically. The tracking was verified in real-time and corrected by manually adjusting the contour to ensure optimal tracking.
The GLSRV value obtained from the averaged value of all 6 segments of RV free wall and interventricular septum. Global longitudinal strain of RV free wall was calculated from the average measurements of 3 RV segments (basal, mid, and apex) and interventricular septum from the values of 3 septal segments. The same apical 4-chamber images used for conventional RV measurements were analyzed with VVI or EchoPAC algorithms by two investigators who were blinded to the conventional echocardiography data.
Reproducibility
Intraobserver and interobserver variabilities in GLSRV were evaluated in 15 random subjects by two investigators, measured by calculating intraclass correlation coefficients.
Statistical analysis
The data were analyzed using standard software (SPSS version 19.0, IBM, Chicago, IL, USA) and MedCalc (version 12.3.0, MedCalc Software, Mariakerke, Belgium). Summary data were expressed as mean values ± standard deviation or a percentage of the patients. Linear regression analysis was performed to evaluate the relationship between GLSRV-VVI, GLSRV-EchoPAC, and other conventional echocardiographic variables. Due to skewed distribution, B-type natriuretic peptide (BNP) concentration was assessed using logarithmically transformed values (base 10). The optimal cutoff value for predicting RV systolic dysfunction, defined by RVFAC < 35%, was determined through receiver-operating characteristic curve analysis. Comparison of areas under the curve (AUC) was done with the method suggested by Hanley and McNeil.16) A p value less than 0.05 was considered statistically significant.
Results
Patient characteristics
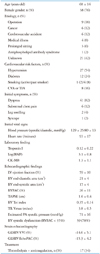
A total of 50 consecutive patients (38 females, mean age 68 ± 14 years old) were included in this study. Their baseline clinical and routine echocardiographic data are listed in Table 1. Common underlying etiologies were histories of previous operation, malignancy and cerebrovascular accident. However, underlying causes were not identified in about 42% of cases. RV systolic dysfunction, defined by a RVFAC of less than 35%, was present in 39 patients (78%) and 17 patients (34%) underwent thrombolytic therapy. Of them, 2 had complications associated with thrombolytic therapy (1 minor bleeding and 1 major bleeding).
RV strain findings
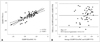
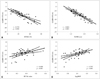
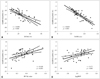
GLSRV-VVI and GLSRV-EchoPAC showed significant correlation (r = 0.793, p < 0.001) and small bias (-0.7, 95% limits of agreement was -6.9 to 5.4%) (Fig. 1). GLSRV-VVI showed significant correlations with RVFAC (r = -0.794, p < 0.001), TAPSE (r = -0.861, p < 0.001), RV Tei index (r = 0.468, p = 0.001) and LogBNP (r = 0.595, p < 0.001) (Fig. 2). GLSRV-EchoPAC also showed significant correlations with RVFAC (r = -0.696, p < 0.001), TAPSE (r = -0.828, p < 0.001), RV Tei index (r = 0.438, p = 0.003), and LogBNP (r = 0.471, p = 0.001) (Fig. 3).
GLSRV-VVI showed significant correlations with serum cardiac biomarkers of RV dysfunction such as troponin-I level (r = 0.294, p = 0.040) and creatinine kinase-MB (r = 0.367, p = 0.010). However, the GLSRV-EchoPAC did not reveal the correlation.
Detection of RV systolic dysfunction
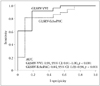
There were 39 patients with RV systolic dysfunction, as determined by RVFAC (< 35%). The best cutoff value of GLSRV-VVI for the detection of RV systolic dysfunction was -16.7% [95% confidence interval (CI) = -23.0-16.8%] (AUC = 0.91, p < 0.001) with a sensitivity of 92% and a specificity of 82%. The best cutoff value for GLSRV-EchoPAC was -16.8% (95% CI = -22.2-16.8%) (AUC = 0.84, p = 0.001), for sensitivity 82%, and for specificity 91%. There was no significant difference in the comparison of AUC's by the Hanley-McNeil method (difference = 0.07, 95% CI: -0.03-0.17, p = 0.188) (Fig. 4).
Variability
The interobserver variability of GLSRV-VVI was small [intraclass correlation coefficient was 0.86 (95% CI = 0.63-0.95), p < 0.001], and similar to the intraobserver [0.92 (95% CI = 0.78-0.97), p < 0.01]. Interobserver variability of GLSRV-EchoPAC was [intraclass correlation coefficient was 0.88 (95% CI = 0.65-0.96), p < 0.001], and similar to intraobserver [0.91 (95% CI = 0.80-0.97), p < 0.01].
Discussion
In this study, we showed a good correlation between GLSRV-VVI and GLSRV-EchoPAC in patients with acute PE. GLSRV-VVI and GLSRV-EchoPAC also revealed good correlations with conventional echocardiographic RV parameters.
Though PE is a relatively common cardiovascular disease, it is difficult to diagnose because of its non-specific clinical presentation.1) The consequences of acute PE are mainly hemodynamic and become evident only when more than a third of the pulmonary arterial bed is obstructed.17) Emboli might abruptly increase pulmonary arterial resistance and pressure by obstructing the pulmonary vascular bed. The increased pulmonary arterial resistance can affect the structure and function of RV.18) Markers of RV dysfunction are used for risk stratification and guide treatment in acute PE.1)3)19) Echocardiography remains the most common first-line test in these patients. RV dilatation, hypokinesis and pressure overload of RV are echocardiographic markers of RV dysfunction. The absence of echocardiographic signs of RV overload or dysfunction can exclude PE from being diagnosed in patients who are at high risk for it and presenting with symptoms of shock or hypotension. Echocardiography also can give additional information about the differential diagnosis of the cause of shock. Also, echocardiographic assessment of RV systolic function can be used to determine treatment modality in these patients. However, the assessment of RV systolic function is usually difficult due to the complex shape of RV. Recently, strain echocardiography has been used in the measurement of RV systolic function like in the measurement of LV systolic function.14)20)21)22) Unlike conventional echocardiography, it can evaluate myocardial deformation and provide parameters of regional and global ventricular function that may be useful in the assessment of systolic and diastolic performance.5) Strain echocardiography can also be used to differentiate acute PE from chronic pressure RV overload in chronic pulmonary diseases.23)
However, strain echocardiography, especially speckle-tracking echocardiography, was originally designed to evaluate LV regional and global function, and it has been validated by sonomicrometry.24)25) Because the RV has a different anatomy and structure from the LV, the application of the same LV algorithm to the RV remains problematic. Moreover, variations in strain measurement by different vendors with different algorithms have limited the simple application of these techniques for the assessment of RV systolic function. VVI and automated function imaging with EchoPAC are the two most commonly used speckle-tracking algorithms which are applied to evaluate global and regional LV systolic function.26) In the present study, we found that GLSRV-VVI and GLSRV-EchoPAC correlated well with each other and also showed strong correlations with conventional RV echocardiographic parameters. Because the direction of RV muscle fibers runs predominantly longitudinally, longitudinal shortening is a major contribution of the RV and longitudinal strains can represent RV systolic function accurately.7)8)
Despite there being no statistically significant difference, GLSRV-VVI showed larger AUC than GLSRV-EchoPAC in the detection of RV systolic dysfunction in patients with acute PE. GLSRV-VVI showed significant correlations with conventional echocardiographic markers and serum biomarkers of RV dysfunction. These results may come from algorithmic difference. Because EchoPAC uses region of interest much larger than the thickness of the RV free wall, VVI strain value seems to be better in the assessment of RV systolic function.
Limitations
First, this is an observational study with analysis of relatively small numbers of stored digital images. Bias may have been introduced from patient selection, and analysis may have been affected by image quality. Second, assessed RV systolic function by RVFAC in the differentiation of RV systolic dysfunction. Other more accurate and objective imaging modalities, such as cardiac magnetic resonance imaging or RV angiography, would have increased this study's reliability. Unfortunately, patients with acute PE usually need intensive therapy and so are not suitable for these imaging studies in their presentation. Third, we used a vendor-independent platform to measure GLSRV-VVI with stored echocardiographic images studied by a GE machine. A prospective study with a large number of patients and using different echocardiographic machines simultaneously will be needed to confirm the correlations and the clinical impact of this measurement.
 XML Download